
Abstract
When using the propensity score method to estimate the treatment effects, it is important to select the covariates to be included in the propensity score model. The inclusion of covariates unrelated to the outcome in the propensity score model led to bias and large variance in the estimator of treatment effects. Many data-driven covariate selection methods have been proposed for selecting covariates related to outcomes. However, most of them assume an average treatment effect estimation and may not be designed to estimate quantile treatment effects (QTEs), which are the effects of treatment on the quantiles of outcome distribution. In QTE estimation, we consider two relation types with the outcome as the expected value and quantile point. To achieve this, we propose a data-driven covariate selection method for propensity score models that allows for the selection of covariates related to the expected value and quantile of the outcome for QTE estimation. Assuming the quantile regression model as an outcome regression model, covariate selection was performed using a regularization method with the partial regression coefficients of the quantile regression model as weights. The proposed method was applied to artificial data and a dataset of mothers and children born in King County, Washington, to compare the performance of existing methods and QTE estimators. As a result, the proposed method performs well in the presence of covariates related to both the expected value and quantile of the outcome.
Keywords
Introduction
The investigation of causal effects is a topic of interest in many research fields. To investigate the causal effects, the effect of treatment on individual outcomes was evaluated. Additionally, one may not only be interested in the average treatment effect on multiple targets but also in the effect of treatment on the upper or lower side of the distribution of outcome by evaluating quantile treatment effects (QTEs). Studies using QTEs include an evaluation of the effect of maternal smoking during pregnancy on birth weight 1 and the effect of job training on annual income. 2
When estimating QTEs from the observed data, the distribution of covariates affecting the outcome may differ between the group receiving the treatment (treatment group) and the group not receiving the treatment (control group). It is difficult to distinguish the effect of treatment from the effect of confounding variables when the distribution of confounding variables differs between the two groups. In such cases, an adjustment (covariate adjustment) is necessary to ensure that the distribution of covariates affecting the outcome is equal among treatments. Several methods have been proposed to estimate QTEs from observed data with covariate adjustments. Using an estimator weighed by the propensity score,3,4 the method of estimating the QTEs on panel data 5 are well-known examples. In this study, we consider estimating QTEs by performing covariate adjustment using the method weighed by propensity scores, as this method is easy to apply to real data.
Selecting the covariates to be included in the propensity score model is an important issue when estimating the treatment effects using propensity scores. The covariates included in the propensity score model are well discussed.6–8 In fact, it has been reported that including covariates unrelated to both the outcome and treatment in the propensity score model can bias the estimator of the treatment effect and that including covariates related to the treatment reduces the efficiency of the estimator. Therefore, the inclusion of covariates in the propensity score model should be carefully considered. In many cases, selecting covariates to be included in a propensity model is difficult a priori. To address this issue, several data-driven covariate selection methods have been proposed in the context of average treatment effects using propensity scores.9–11
Although covariate selection methods for estimating average treatment effects have been well discussed, covariate selection methods for QTE estimation have not been sufficiently discussed. QTE estimation considers two possible relationships for the outcome, expected value and quantile value. In a linear model, it is easy to imagine that when it is related to the expected value, it is also related to the quantile. However, some variables were only related to the quantiles. For example, in the case of normal distribution, the covariate associated with variance is associated with its conditional quantile. Thus, existing covariate selection methods for average treatment effects are unsuitable for selecting covariates related to the outcome quantile.
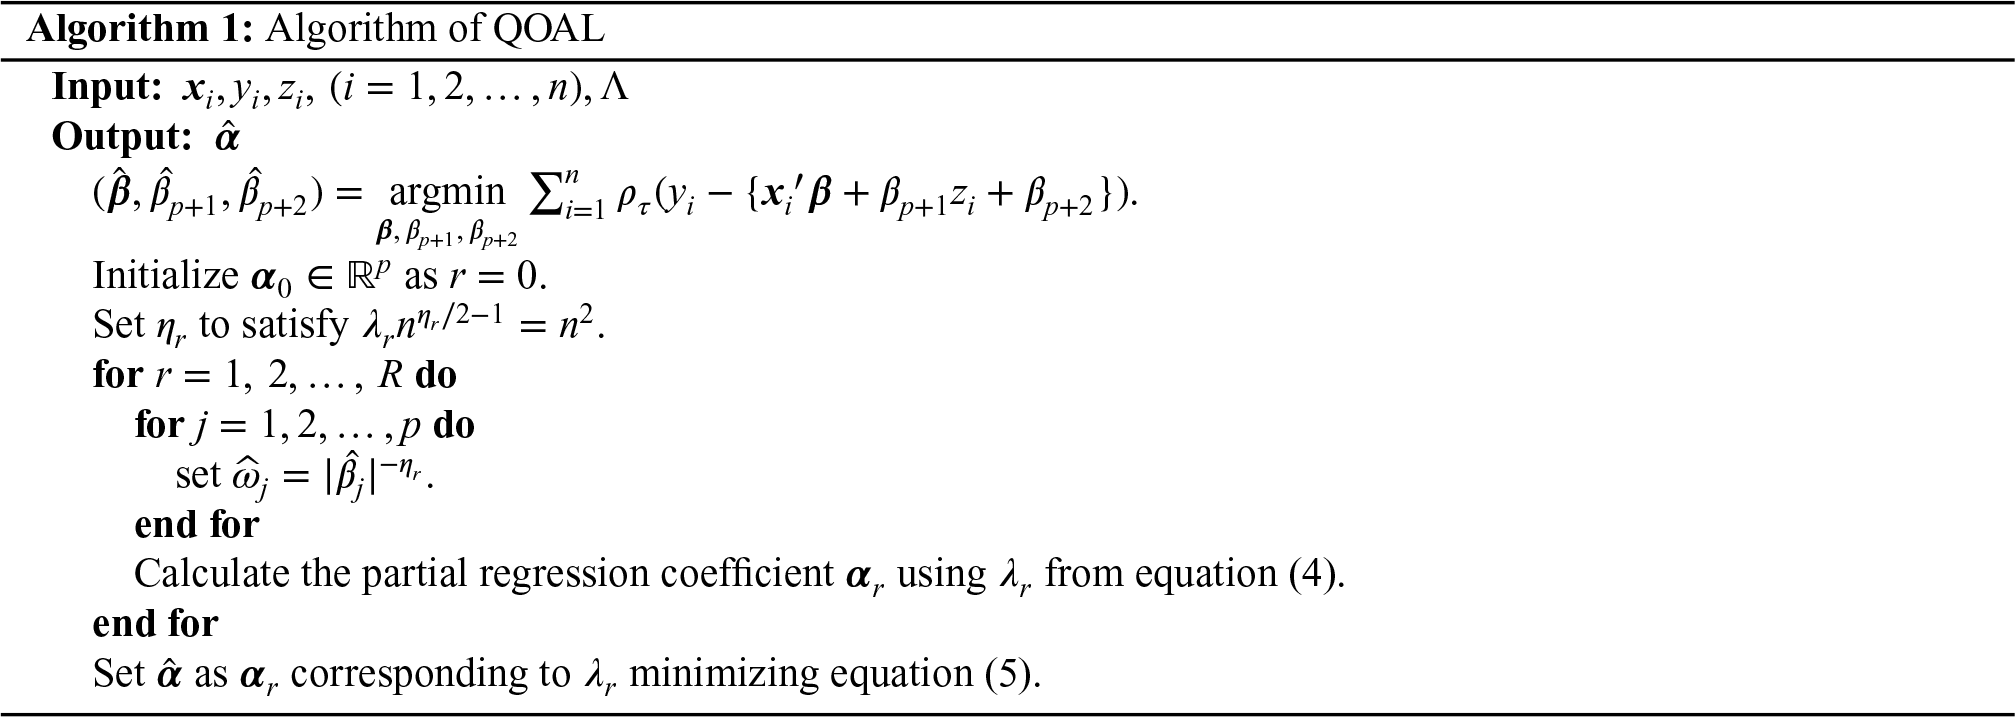
We propose a covariate selection method called quantile outcome adaptive lasso (QOAL) for QTE estimation using the propensity score method. Specifically, we modified the weights of regularization terms in the outcome adaptive lasso (OAL) 11 covariate selection method, which assumes an average treatment effect. In OAL, the weights of regularization terms are partial regression coefficients of the multiple regression model, with the outcome as the objective variable. In QOAL, the weights of the regularization terms are partial regression coefficients of the quantile regression model, 12 with the outcome as the objective variable. Using the partial regression coefficients of quantile regression as weighting terms, the proposed method is expected to select covariates associated with outcome quantiles.
This study proposes a covariate selection method for QTE estimation. Section 2 describes the details of QOAL, a covariate selection method for QTE estimation; Section 3 reports the results of numerical experiments to evaluate the performance of QOAL; Section 4 reports the results of applying the proposed method to real data; and Section 5 concludes the paper.
Quantile outcome adaptive lasso (QOAL)
Estimand
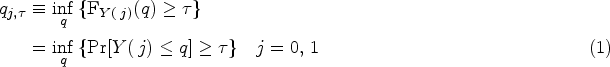
To define QTE, let
For the definition of a QTE, We define a quantile. For
Let
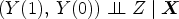
(Strong ignorability 13 )
The following condition holds for all Conditional on the covariate

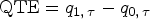
Consider two quantiles,
For
There exists a non-empty set
Next, we defined the propensity scores. The probability that a subject is assigned to a treatment conditional on the covariate


This study proposes a covariate selection method for the propensity score model in equation (2) assuming QTE estimation. Let
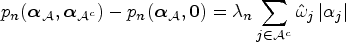
The proposed covariate selection method estimated the following propensity scores:
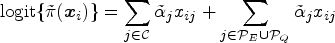
In this study, we assume that the

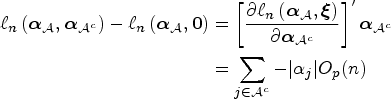
QOAL uses the estimated regression coefficients of the outcome regression model in equation (3) to estimate the partial regression coefficient vector of the propensity score model.

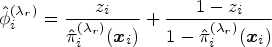
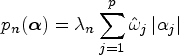
The QOAL estimate
For

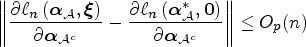
The above theorem guarantees that as the sample size increases, QOAL estimates the partial regression coefficients that are not related to the quantile of the outcome to be zero. This does not guarantee that the partial regression coefficients associated with the quantiles of the outcome are estimated as nonzero.
Selection criteria for regularization parameters
The candidate regularization parameter predefined by the analyst is

We describe the procedure for estimating the parameters of the QOAL. First, we estimate the partial regression coefficients of the outcome regression model. Next, we calculate the partial regression coefficients of the propensity score model and estimate the propensity score by penalized logistic regression using the partial regression coefficients of the outcome regression model. Next, the estimated propensity score is used to calculate the QTE by Firpo’s method. The
Simulation
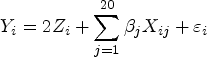
Numerical simulations are conducted to evaluate the performance of the proposed method. We generated a dataset for use in numerical experiments with reference to the OAL article.
11
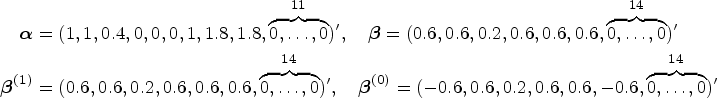
The 20 covariates of each target
Simple regression model
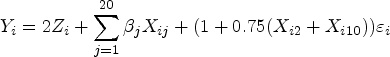
Models with heterogeneous error variance
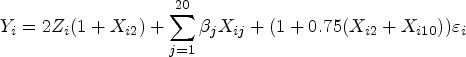
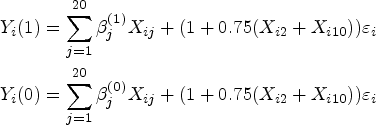
Model with interaction between treatment variables and covariates
Outcome regression models that differed by treatment
where
To determine the effect of sample size on performance, 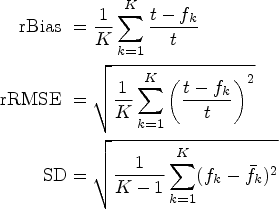
Eight methods were used for comparison. The four methods with covariate selection are Lasso, 15 adaptive lasso (Adl), 16 average treatment effect estimation assumed outcome adaptive lasso (OAL), 11 and the proposed QOAL. Lasso and Adl are expected to select the covariates associated with treatment. The OAL selects the covariate associated with the expected outcome value. For further details on Lasso, OAL, and Adl, please refer to their respective studies.
The four methods without covariate selection fixed the covariates to be included in the propensity score model. The methods that include covariates and confounding related only to the expected value of the outcome in the propensity score model (Targ_Ex) include only confounding (Conf) and covariates related to the expected value of the outcome and treatment (Pot_Conf).
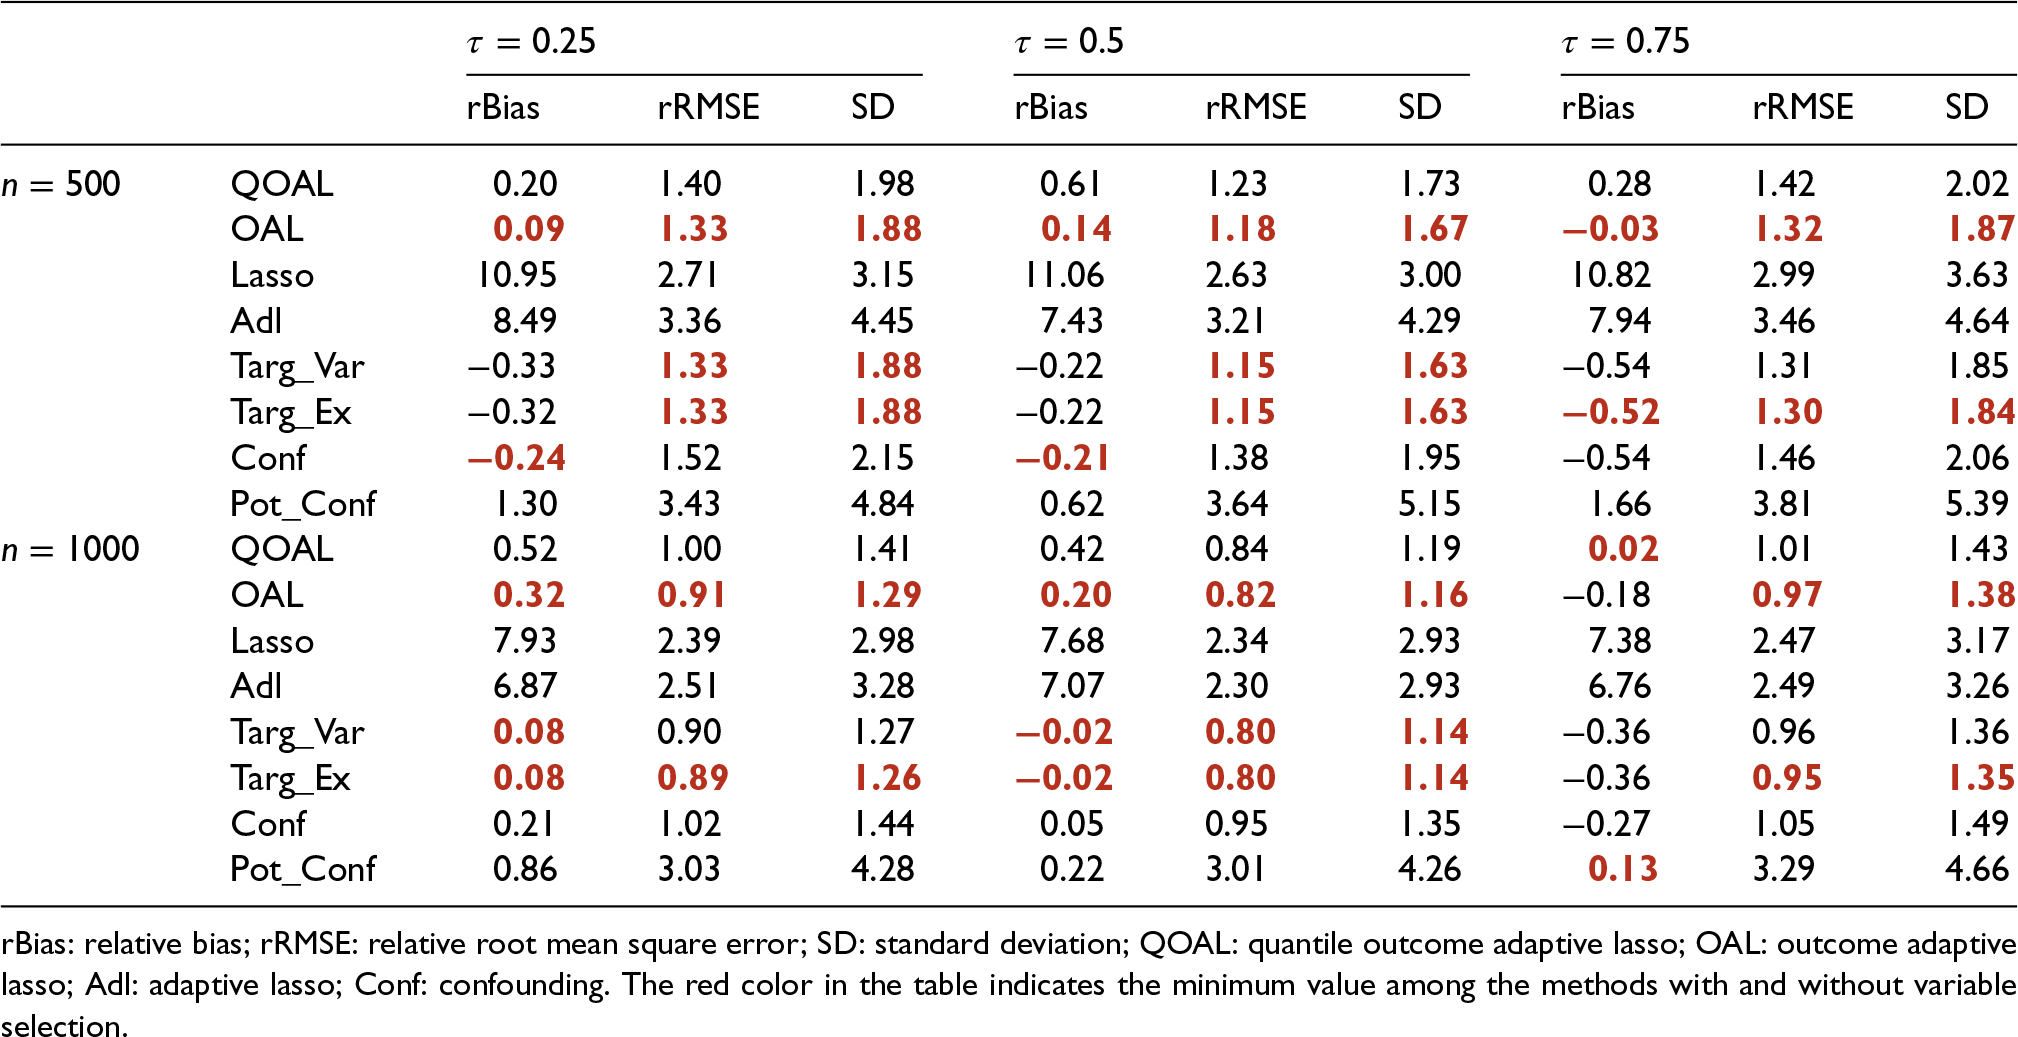
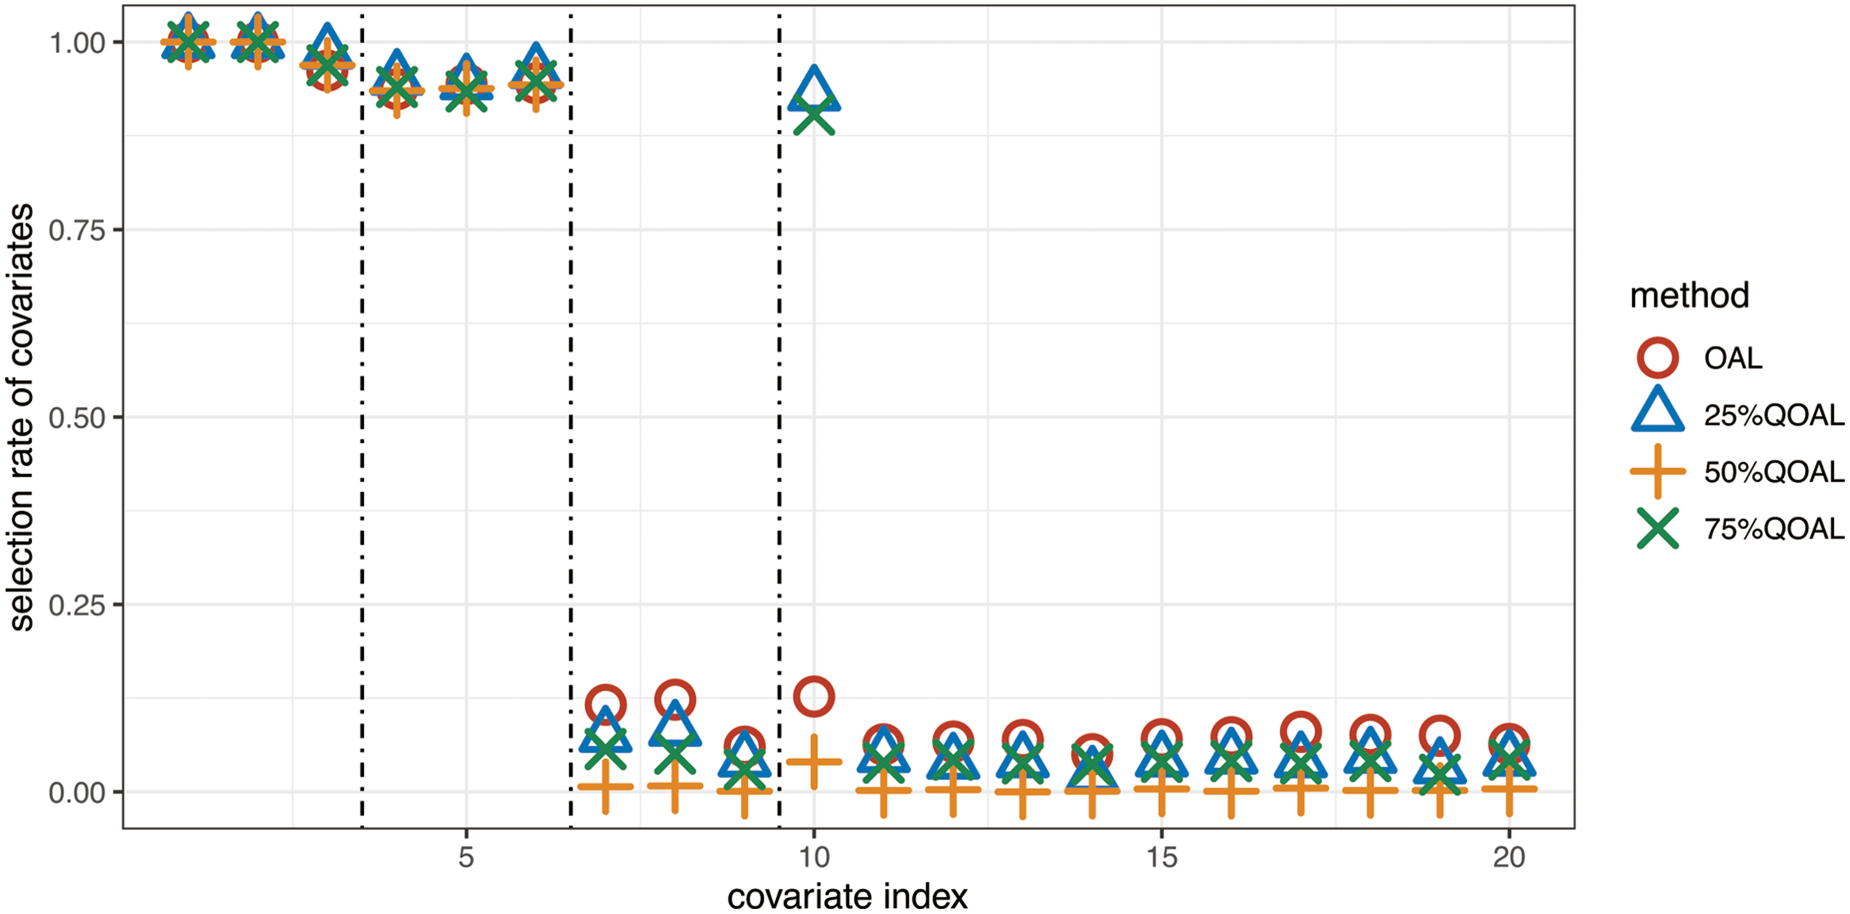
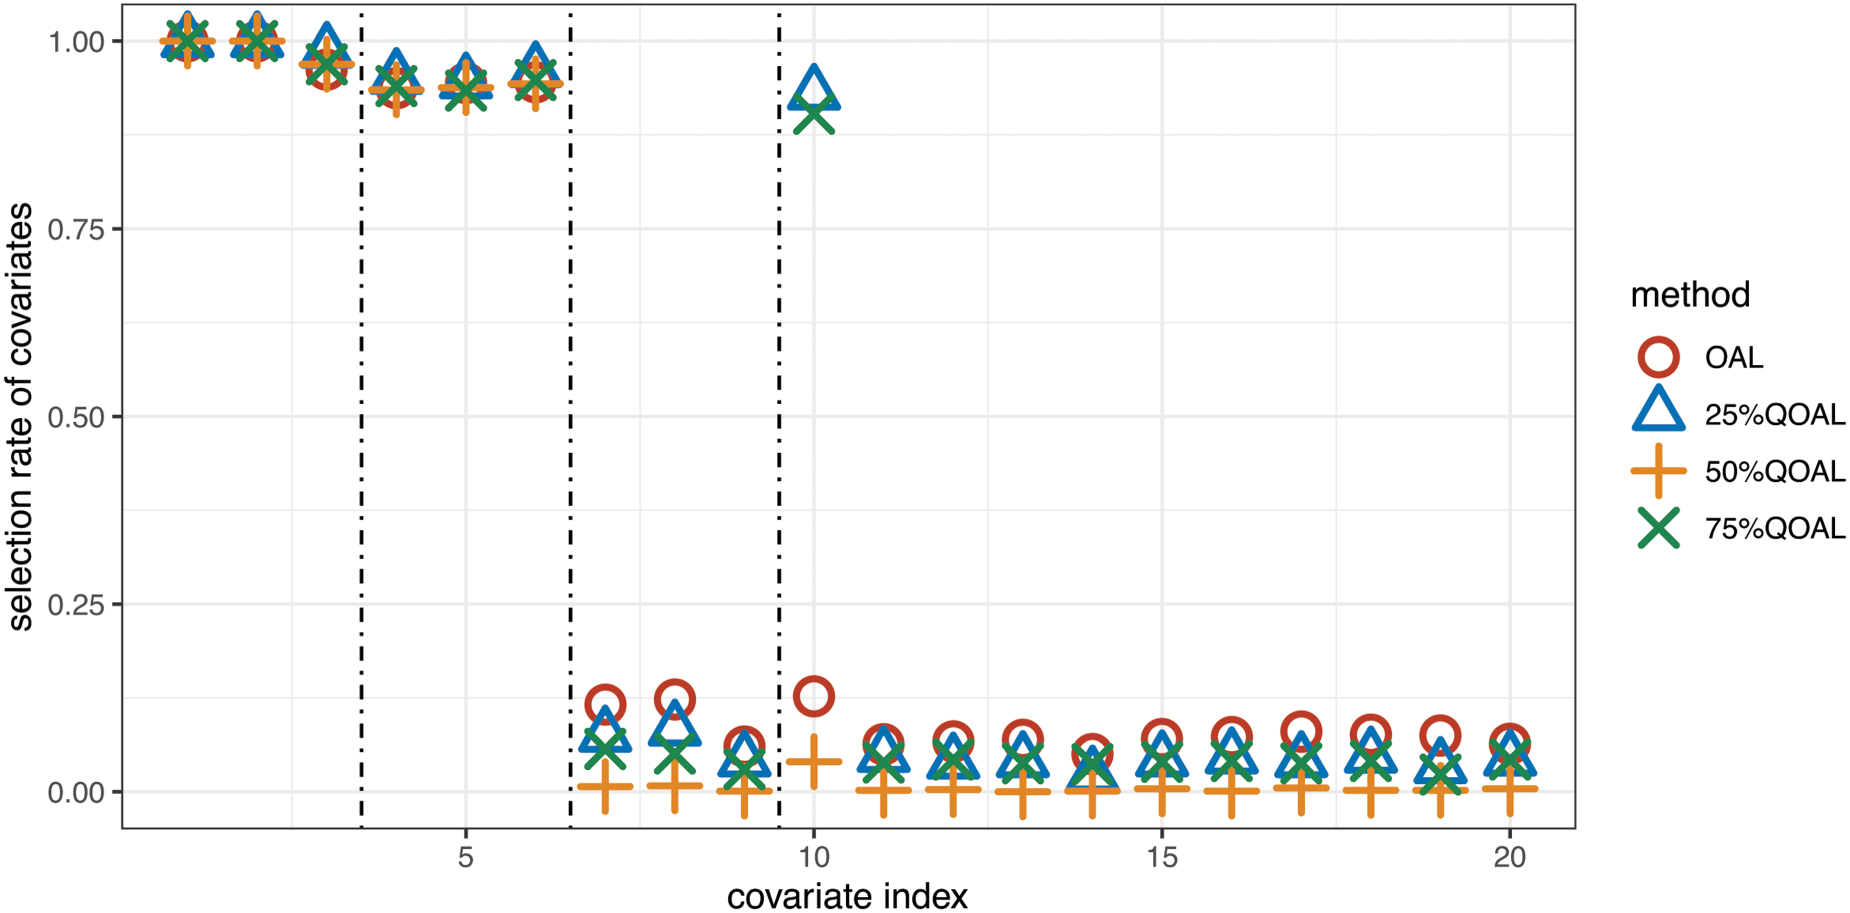
The results of Scenario 1 are listed in Table 1. In Scenario 1, the outcome was generated using a normal regression model. Thus, Scenario 1 is ideal for OAL. The method with covariate selection produced smaller values for all evaluation indices of OAL at almost all quantiles. For the method without covariate selection, the values of rBias and rRMSE for Targ_Ex are small. The covariate selection rates of QOAL and OAL in Scenario 1 are shown in Figure 1. There were no differences in the covariate selection rates between the two groups.
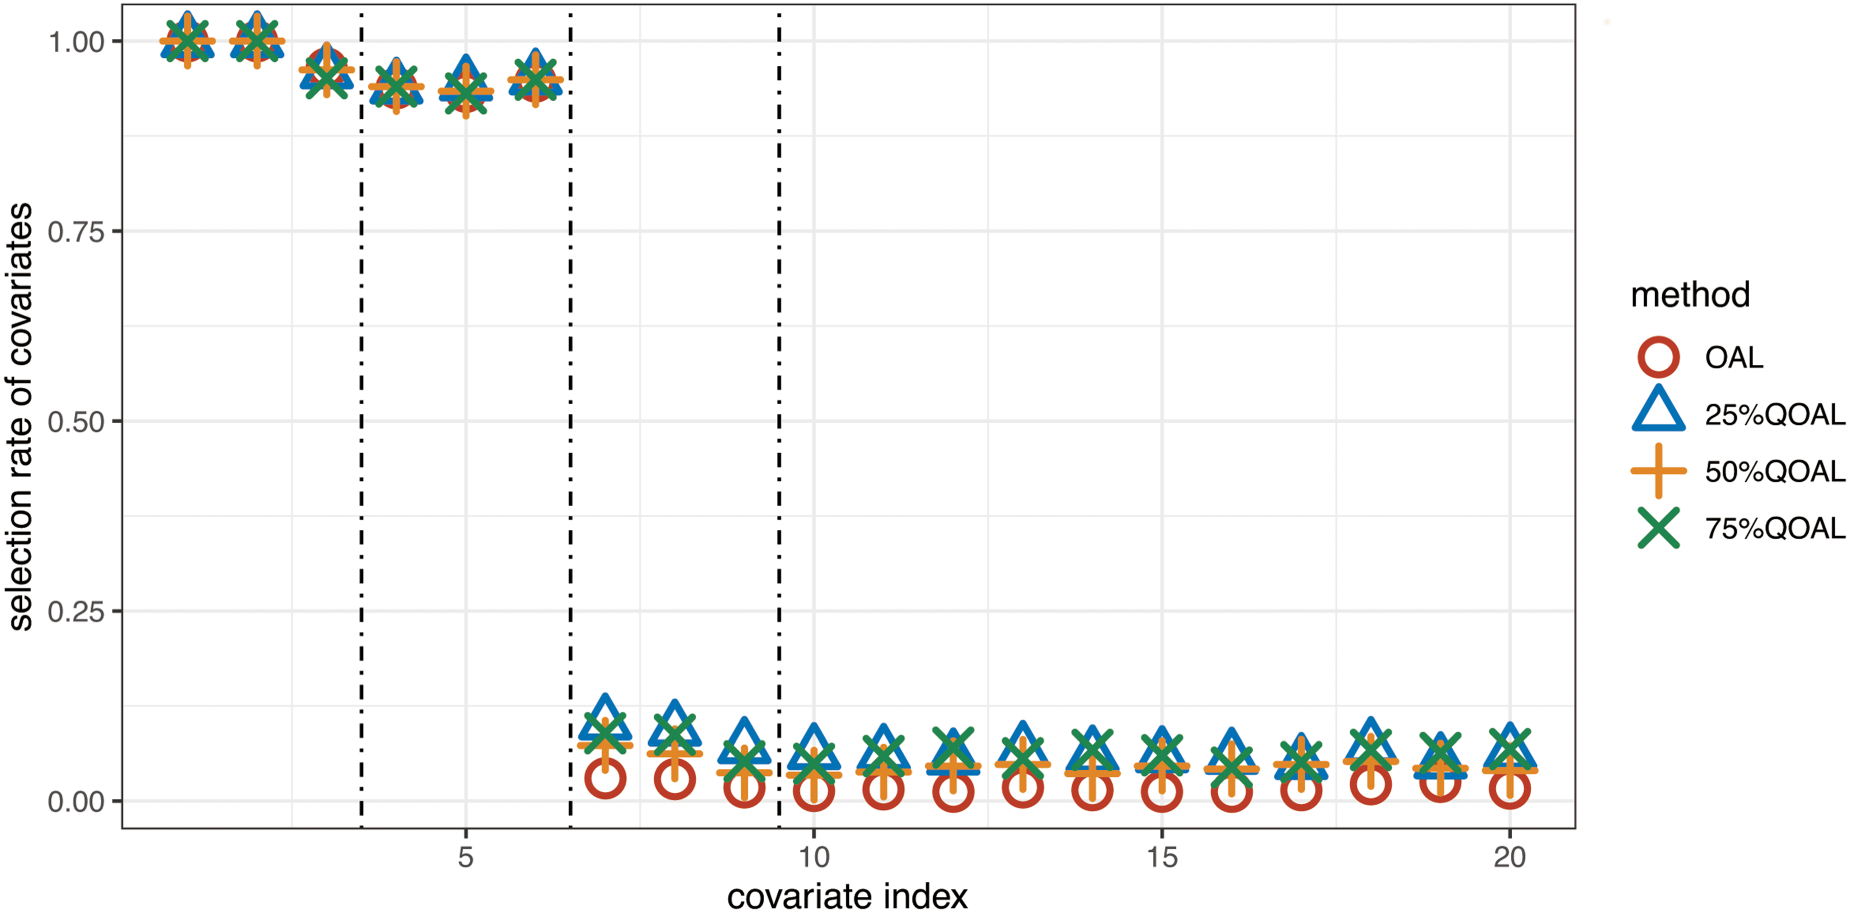
Rate of covariates selection for
Results of Scenario 1: Scenario 1 generated the outcome from a normal regression model.
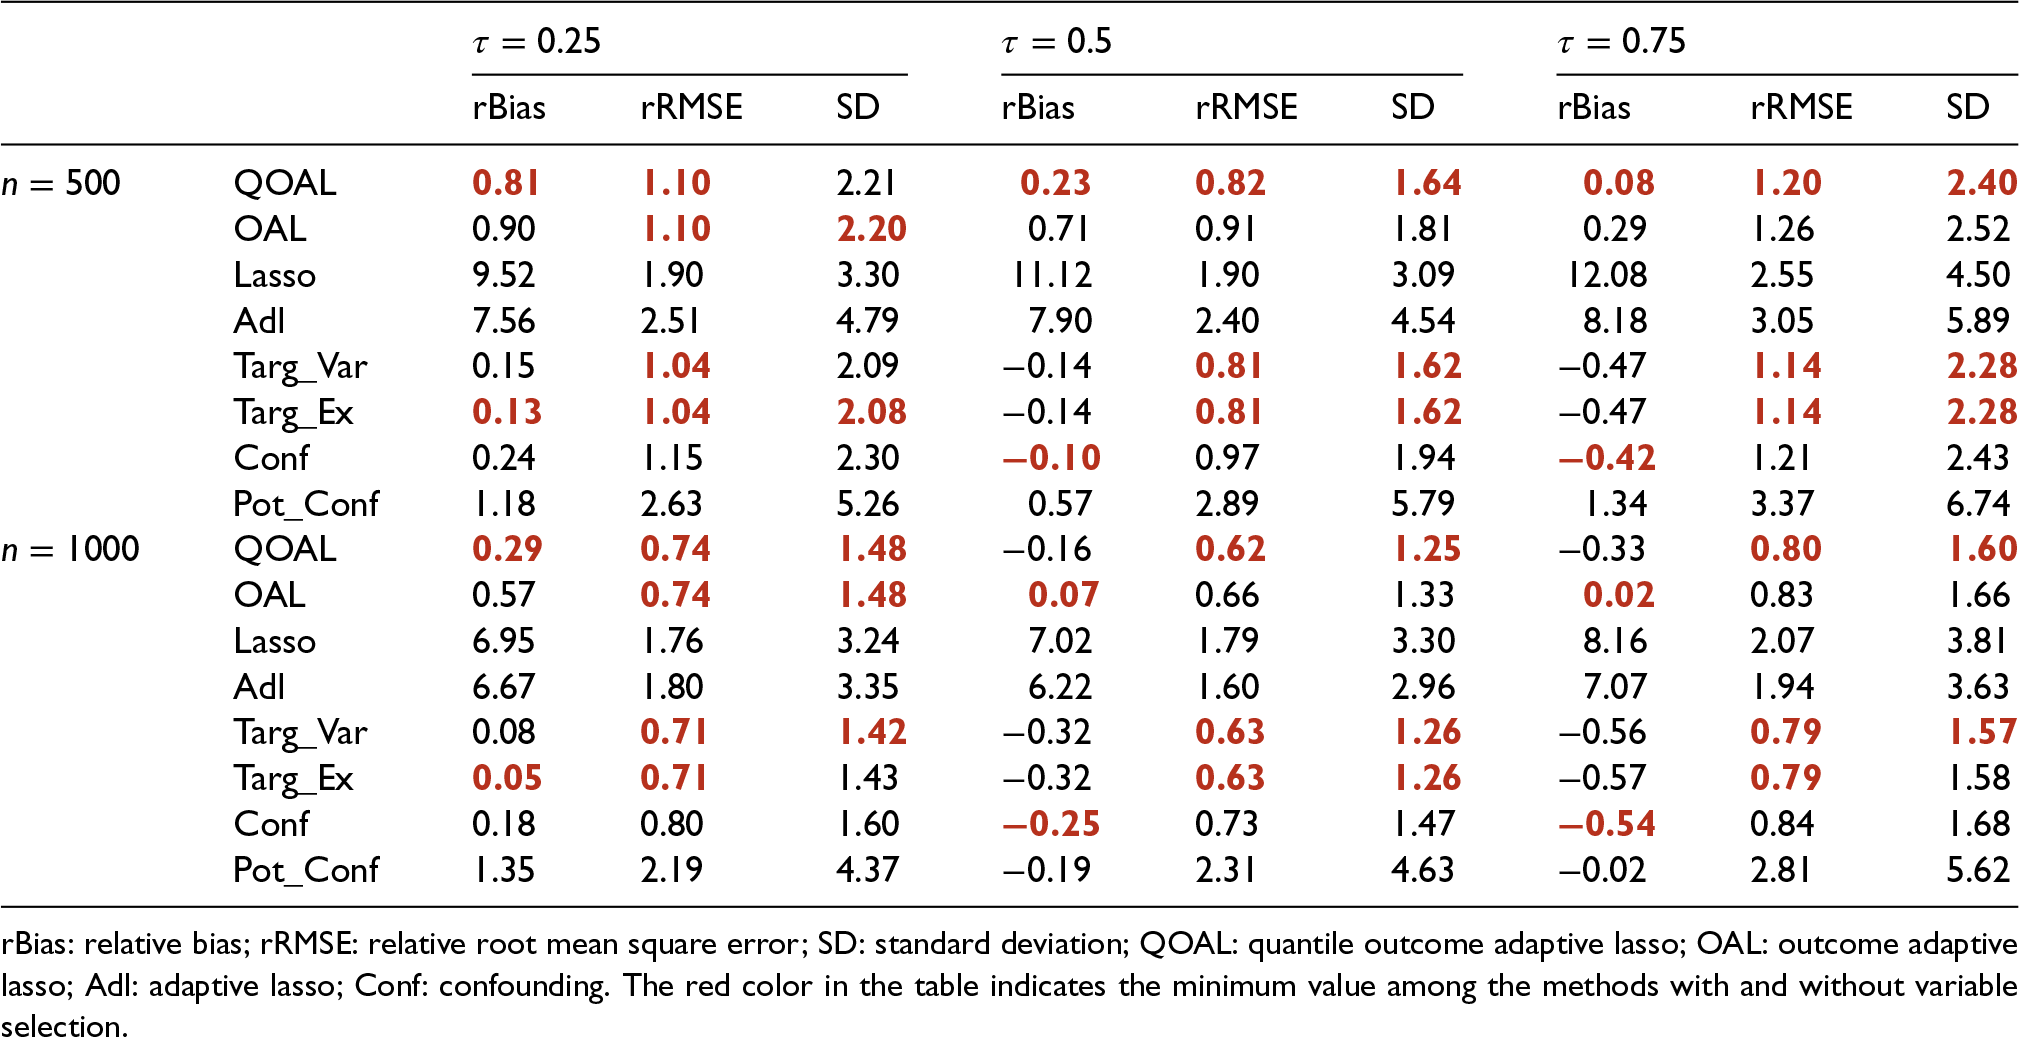
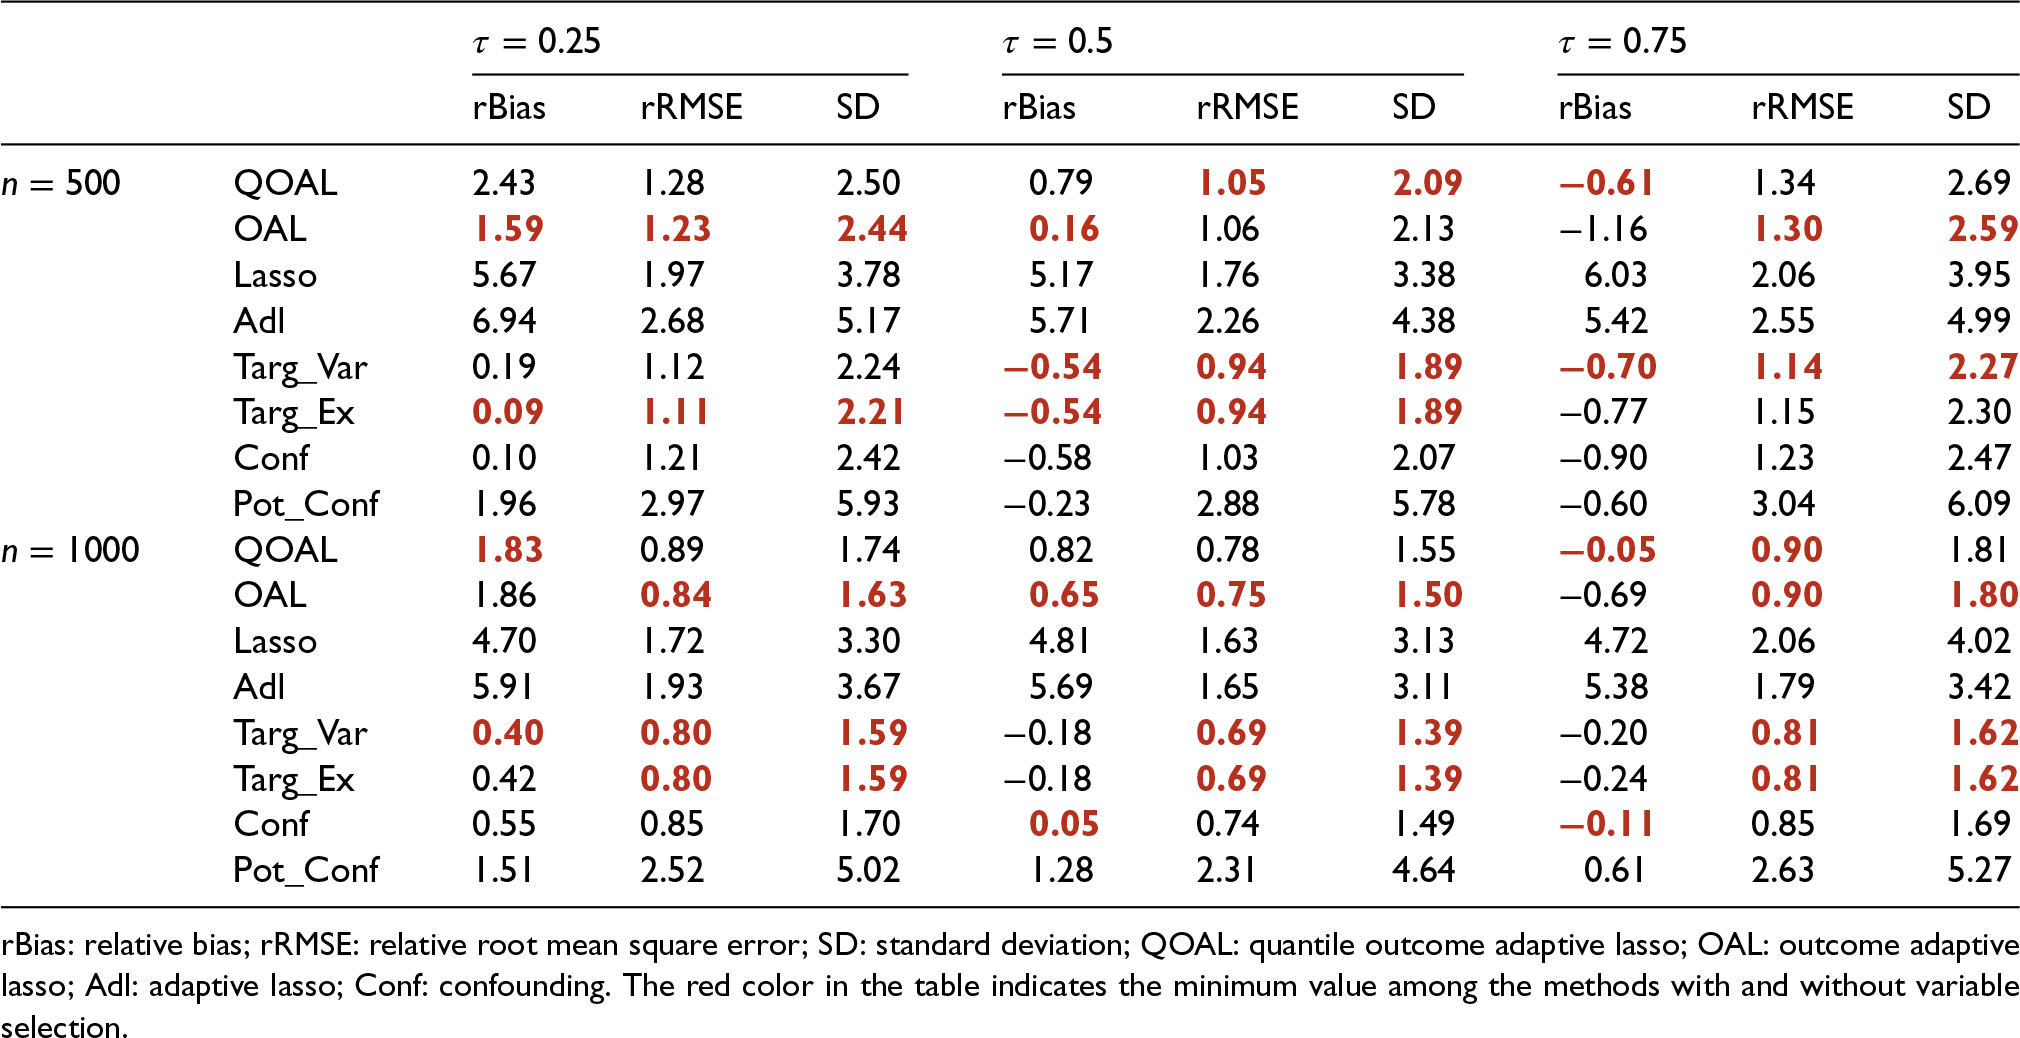
The results of Scenario 2 are presented in Table 2. Scenario 2 is the ideal situation for QOAL because the variance of the outcome depends on the covariates. QOAL has smaller SD and rRMSE values for all quantiles among the method with covariate selection. For some quantiles, OAL has smaller values of rBias in the

Rate of covariates selection for
Results of Scenario 2: Scenario 2 generated an outcome from a model with heterogeneous error variance.
The results for Scenario 3 are listed in Table 3. In Scenario 3, the outcome was generated using a model with an interaction between the treatment variable and covariates. For
Results of Scenario 3: Scenario 3 was generated from a model with an interaction between the treatment variable and the covariates.
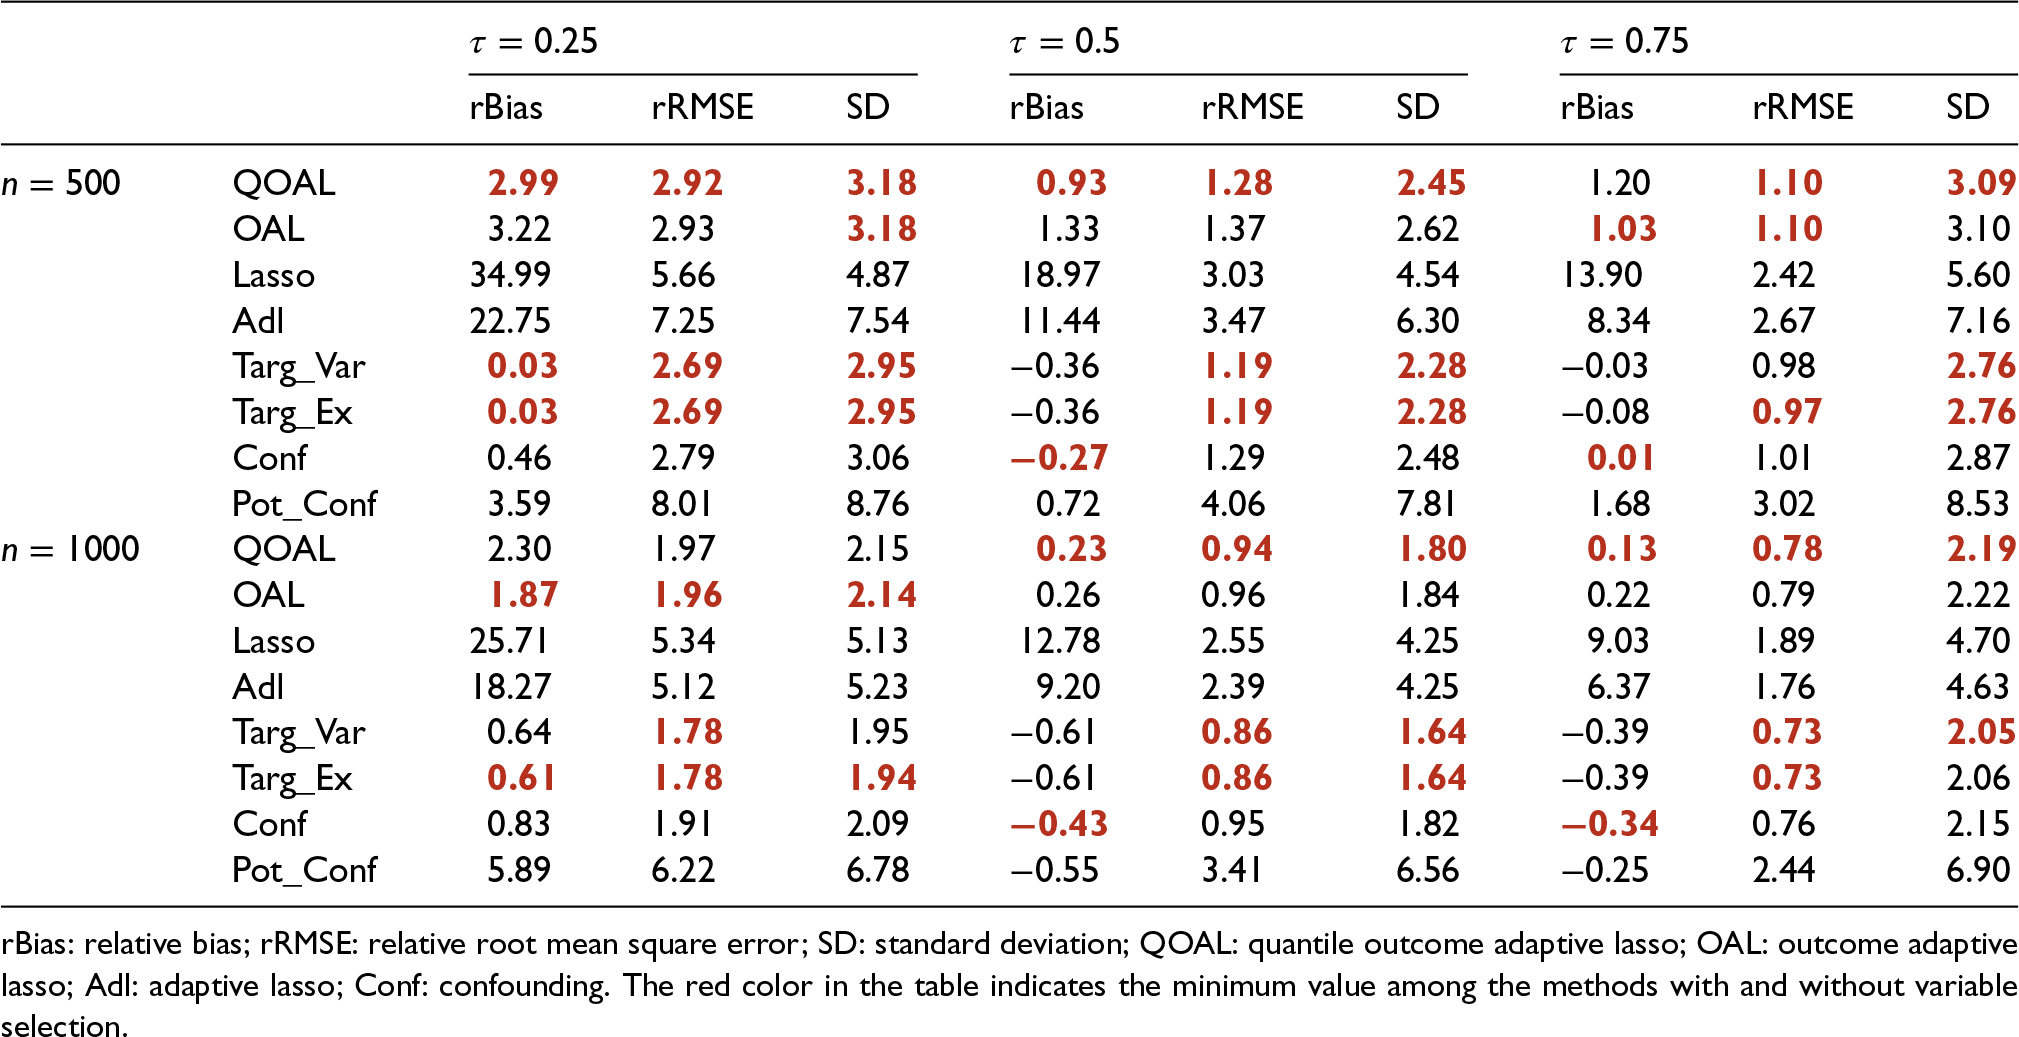
For
Rate of covariates selection for
The results of Scenario 4 are listed in Table 4. In Scenario 4, the outcome model differed depending on the treatment. Among the methods with covariate selection, OAL had a smaller SD and rRMSE at
Rate of covariates selection for
Results of Scenario 4: Scenario 4 generated outcomes from different models by treatment.
This study investigated the effects of maternal smoking during pregnancy on birth weight using QTEs. Several studies have investigated the relationship between smoking during pregnancy and birth weight. For example, prospective population studies have shown that smoking at conception leads to an average reduction in birth weight of
We evaluated the QTE of smoking at conception on birth weight (g) using a dataset 20 of mothers and children born in King County, Washington, in 2001. The sample size was 2500. The dataset includes 15 covariates. The covariates included in the dataset are as follows: Table 5. Among the covariates in Table 5, “plural” was excluded from the analysis because all observations are 1. “smoker” and “drinker” were excluded from the dataset because they are highly correlated with “smokeN” and “drinkN.” The non-continuous values “gender,” “race,” “married,” “firstep,” and “welfare” were dummied and used in the analysis. The “race” category contains five races,“asian,” “black,” “hispanic,” “other,” and “white.”
List of covariates used in application.
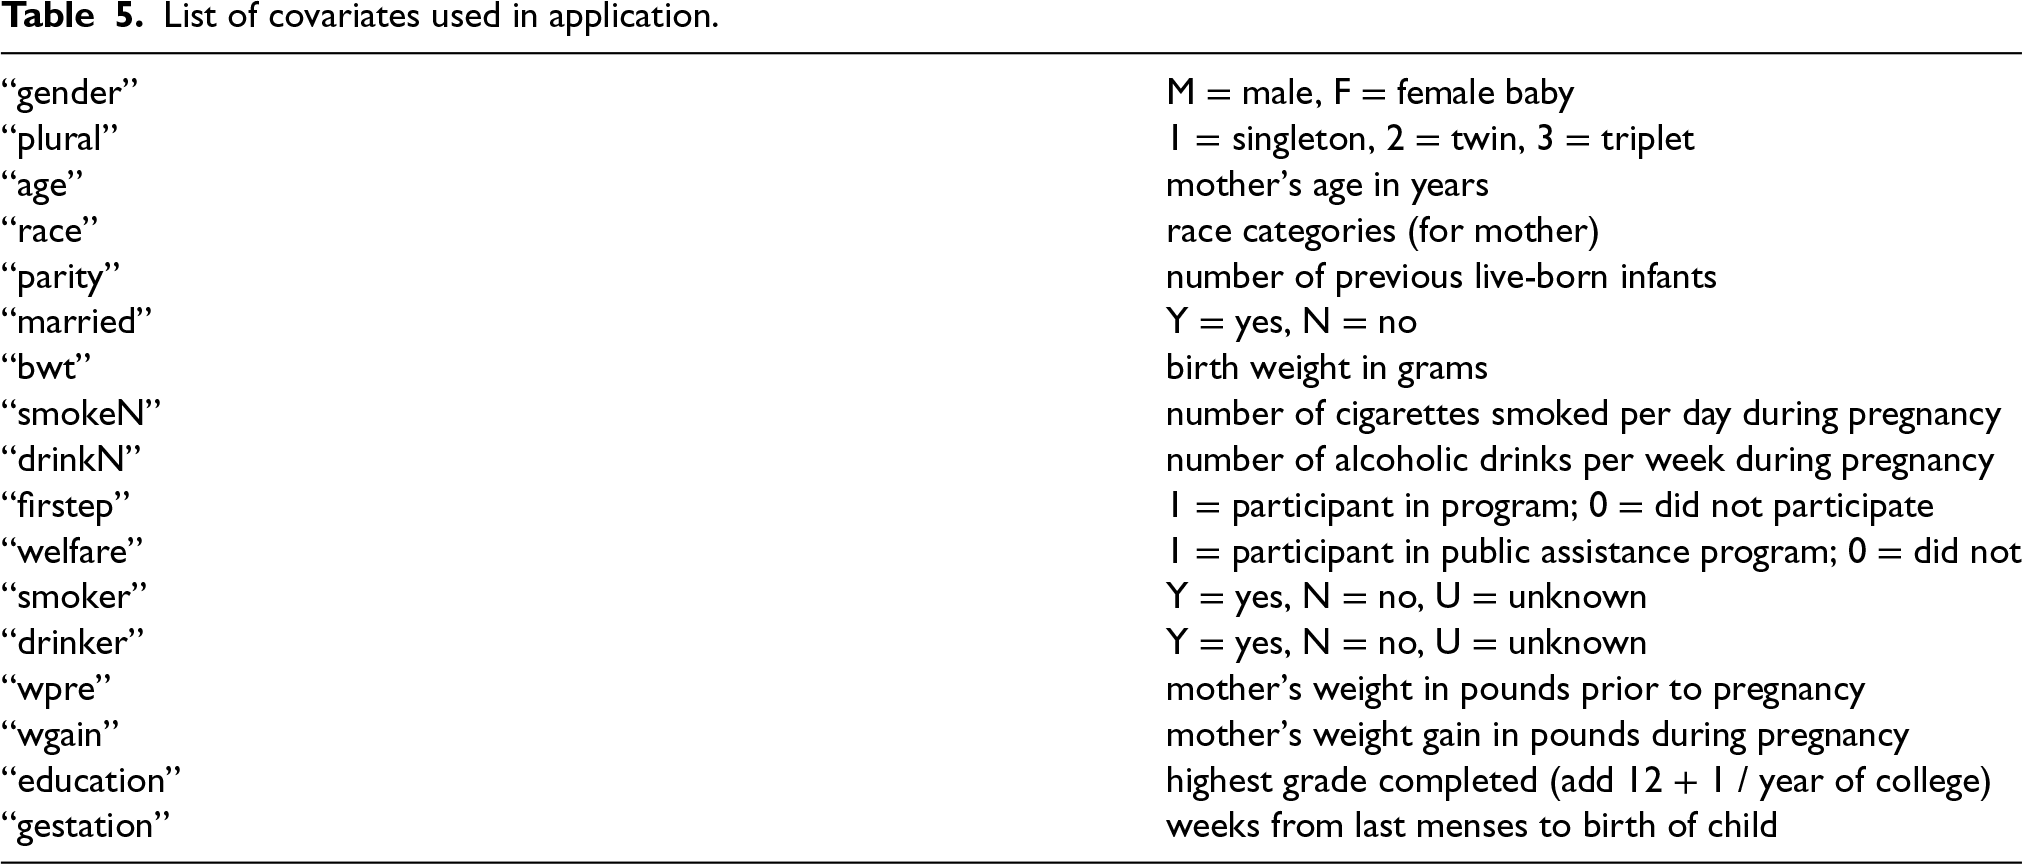
List of covariates used in application.
As we did not identify any relationship between the variables, we applied methods with covariate selection. We used OAL and QOAL as covariate selection methods because they perform well in the simulations. Sampling was repeated 100 times. The mean of estimated QTE by each method is shown in Table 6. The results suggest that the
The mean of estimated QTE of maternal smoking on birth weight.
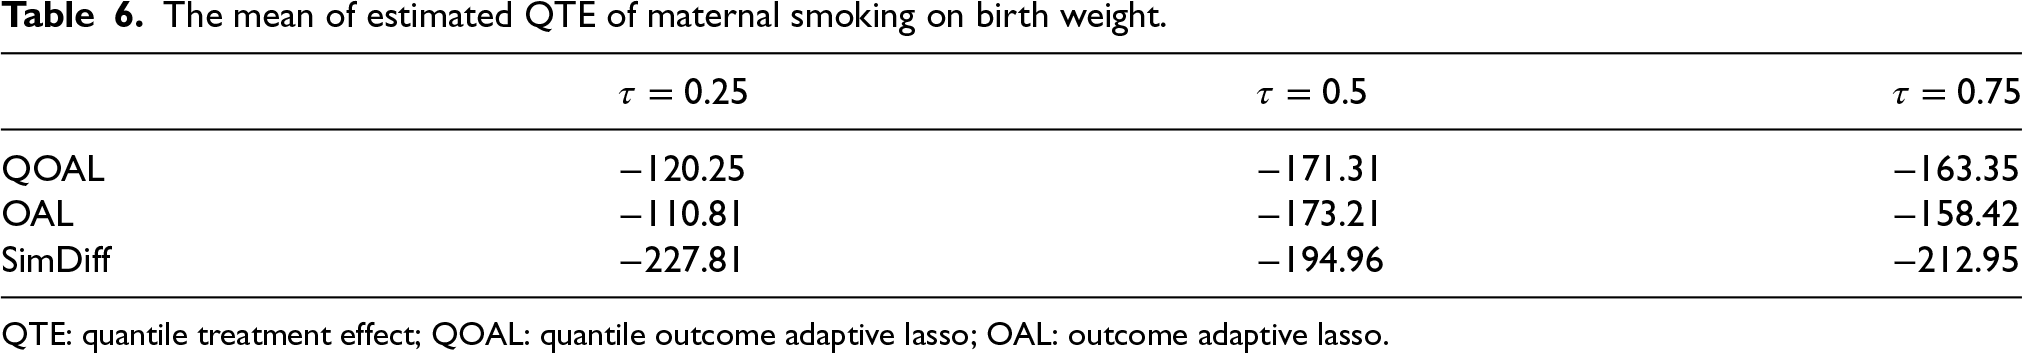
QTE: quantile treatment effect; QOAL: quantile outcome adaptive lasso; OAL: outcome adaptive lasso.
This study proposes a covariate selection method for a propensity score model that assumes QTE estimation. By using the partial regression coefficients of the model to estimate the conditional quantile of the outcome as weights for the regularization term, it was possible to select covariates related to the quantiles of the outcome. The theoretical properties of QOAL guarantee that an increase in sample size does not select covariates that are irrelevant to either the treatment or the outcome. This does not guarantee selection associated with the outcome when the sample size increases.
Through simulation, we confirmed that QOAL performed better in QTEs than the other methods, with covariate selection in many cases. Additionally, QOAL tended to select covariates related to the outcome quantile. The results of the simulation suggest that using QOAL tends to provide a better QTE estimation than using OAL when the relationship between the covariates and outcome is not obvious, although we examined the performance of these methods in a simple situation. However, if a linear model is assumed for the outcome regression model and the covariates associated with the expected value of the outcomes are known a priori, it is recommended to use a method without variable selection instead of a method with covariate selection.
We examined the effect of maternal smoking on birth weight using QTE with covariate selection. These results suggested that maternal smoking during pregnancy leads to weight loss in the upper quartiles. The results are similar to those of a previous study,
17
in which maternal smoking during pregnancy was known to reduce birth weight by approximately
Four points should be noted when using the proposed method. First, the regularization method employed in QOAL estimates the regression coefficients of covariates related to the treatment to be 0. Thus, QOAL tends to misspecify the propensity score model. Particularly, if the proportion of covariates related only to treatment among all covariates is high, the difference between the estimated and true models of the propensity score will be large. This may have caused a bias in the treatment effect. Although the propensity score can be estimated for data with more covariates than the sample size, the difference between the estimated and true models of propensity score may also be large. Hence, we carefully applied the proposed method to high-dimensional data and selected covariates for QTE estimation a priori.
Second, as in Scenario 3, when the outcome regression model has an interaction term between the treatment variable and covariates, the covariate selection rate related to the outcome is lower than that in the no-interaction case. Additionally, in Scenario 3, the selection rate of the covariate that was neither treatment nor outcome-related was higher. This may have caused a difference in the selection rates of the confounding variables. To achieve this, we extend the proposed method to consider the interaction term of the quantile regression.
Third, as in Scenario 4, we did not assume a situation in which the outcome regression models of the treatment and control groups differed. This may lead to instability in the selection of covariates and estimation of the treatment effect.
Fourth, the estimation of the treatment effect in extreme quantiles may be unstable. This may be improved using the QTE 21 for extreme quantile and quantile regression 22 for the extreme quantile as weights for the regularization term. The performance of the proposed method was highly dependent on the quantile regression model, which is an outcome regression model.
Supplemental Material
sj-zip-1-smm-10.1177_09622802241299410 - Supplemental material for Quantile outcome adaptive lasso: Covariate selection for inverse probability weighting estimator of quantile treatment effects
Supplemental material, sj-zip-1-smm-10.1177_09622802241299410 for Quantile outcome adaptive lasso: Covariate selection for inverse probability weighting estimator of quantile treatment effects by Takehiro Shoji, Jun Tsuchida and Hiroshi Yadohisa in Statistical Methods in Medical Research
Footnotes
Acknowledgements
We would like to thank the reviewer for their considered and valuable comments, which have vastly improved this manuscript.
Declaration of conflicting interests
The authors declared no potential conflicts of interest with respect to the research, authorship, and/or publication of this article.
Funding
The author(s) disclosed receipt of the following financial support for the research, authorship, and/or publication of this article: This work was supported by JSPS KAKENHI Grant Number JP22K17862.
Supplemental material
Supplemental material for this article is available online.
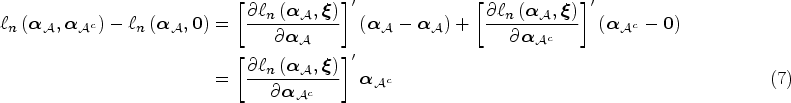
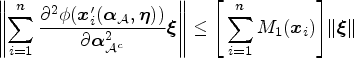
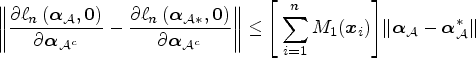
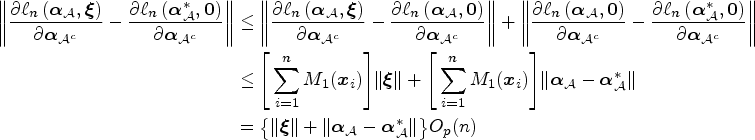
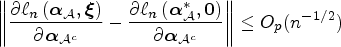
Proof
We assumed the following regularity condition: Regularity conditions
The Fisher information matrix is positive definite.
For a neighborhood


Application
Summary statistics for King County 2001 birth data are shown in Table 7. Partial regression coefficients and covariate selection rates for the propensity score model applied to real data are shown in Table 8. For categorical variables, the frequency (%) should be stated, and for numerical variables, the mean Violin plot of estimated quantile treatment effects (QTEs). Summary statistics for King County 2001 birth data. Average of estimated coefficients and rate of covariates selection. QOAL: quantile outcome adaptive lasso; OAL: outcome adaptive lasso.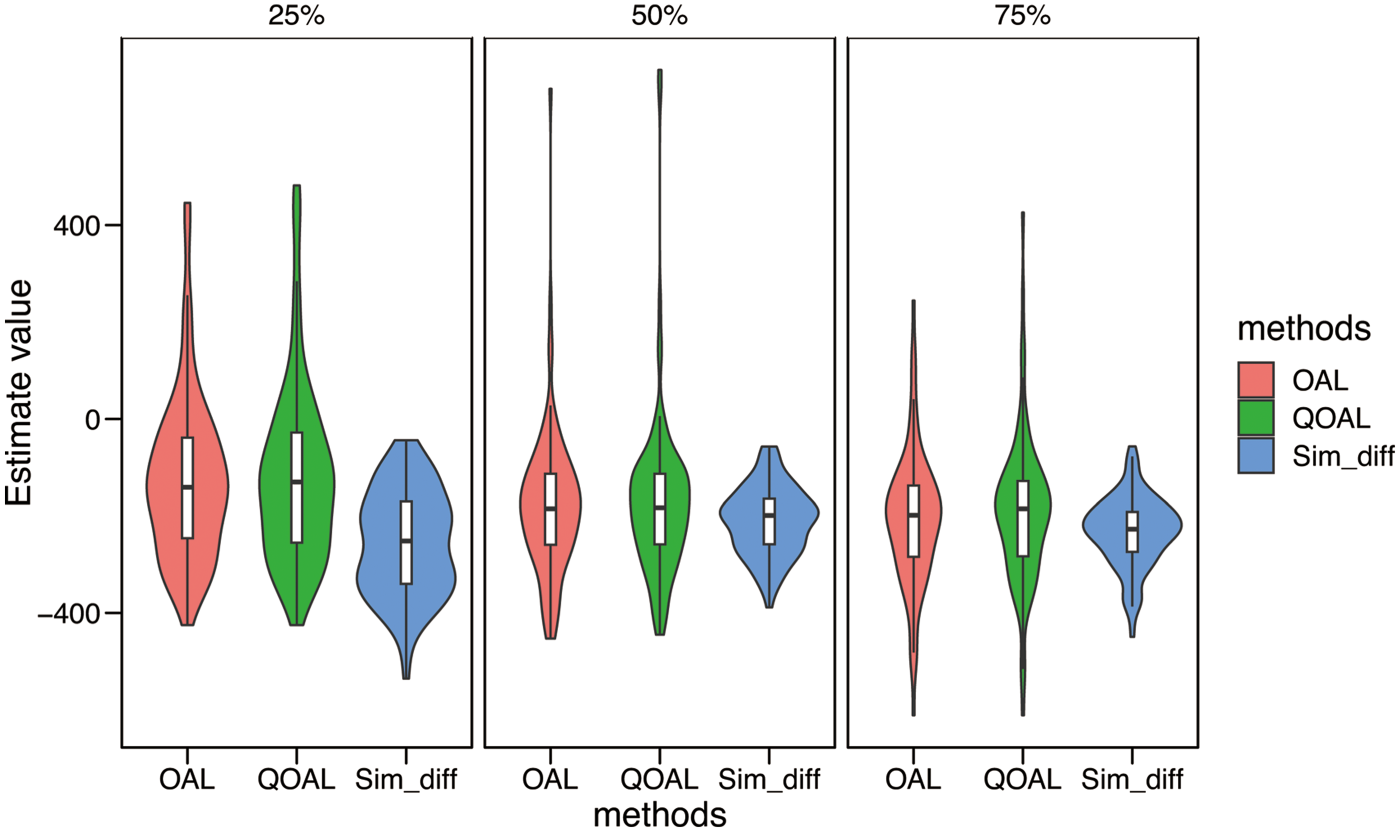
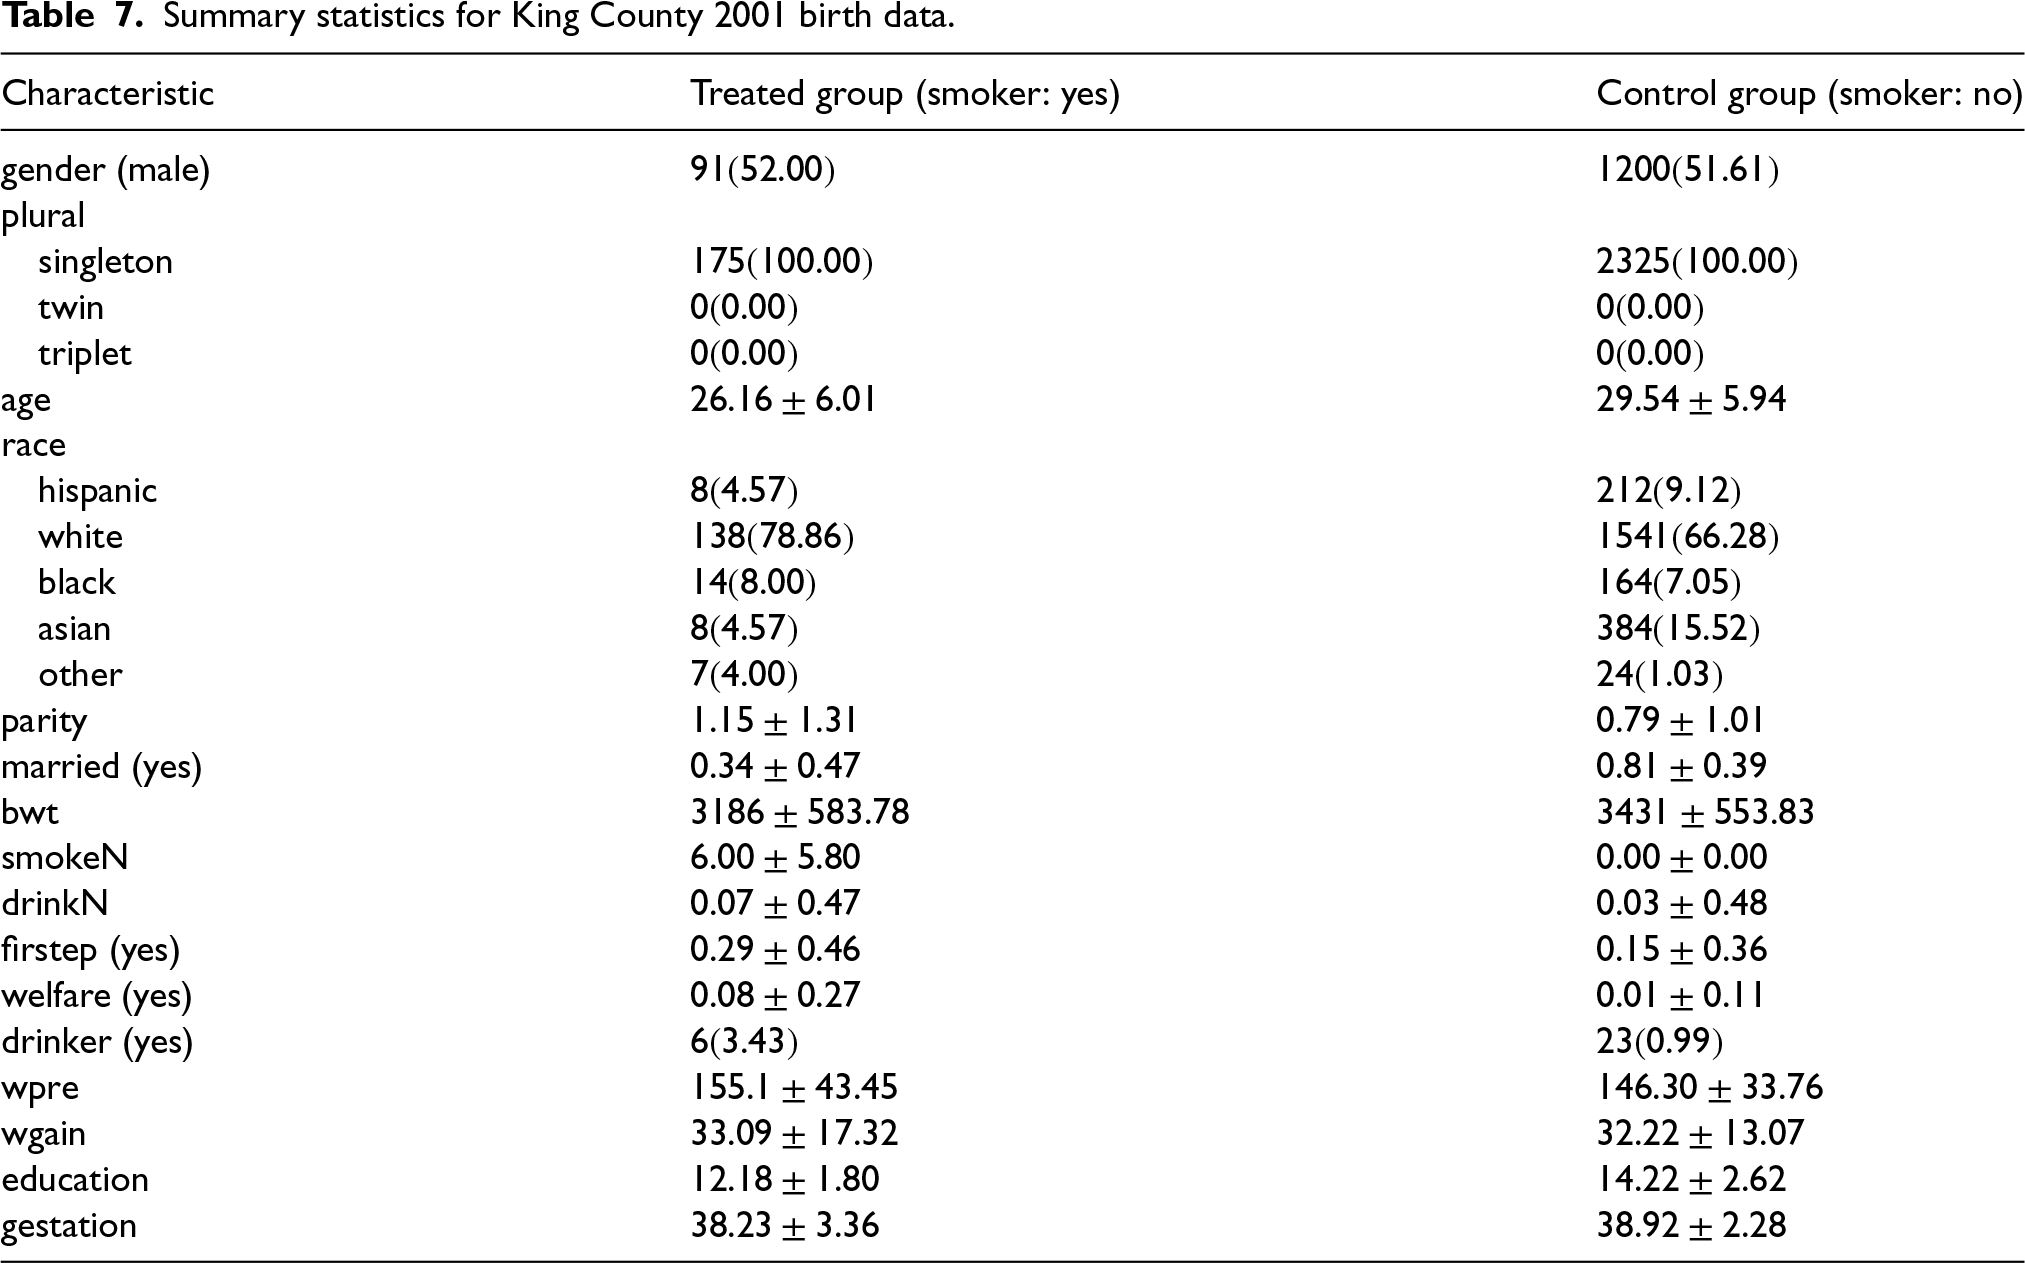
Characteristic
Treated group (smoker: yes)
Control group (smoker: no)
gender (male)
plural
singleton
twin
triplet
age
race
hispanic
white
black
asian
other
parity
married (yes)
bwt
smokeN
drinkN
firstep (yes)
welfare (yes)
drinker (yes)
wpre
wgain
education
gestation
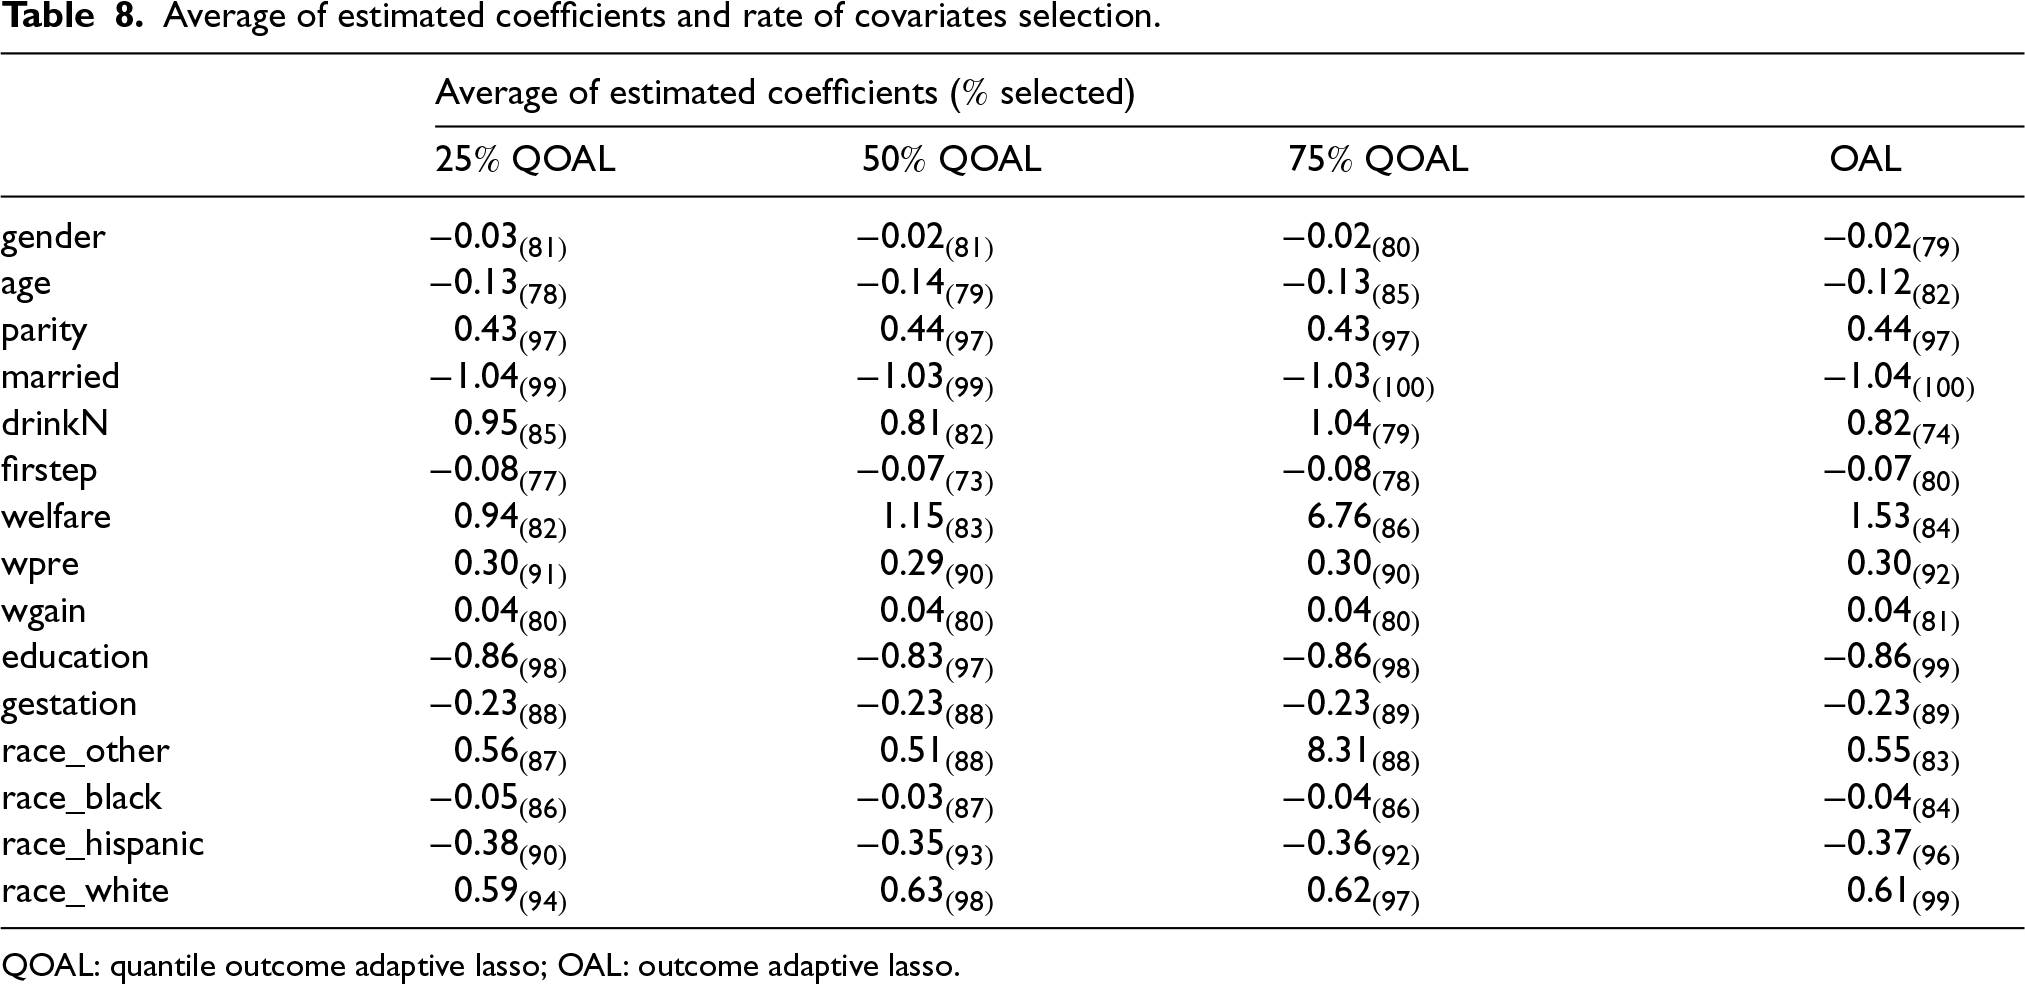
Average of estimated coefficients (
OAL
gender
−0.03(81)
−0.02(81)
−0.02(80)
−0.02(79)
age
−0.13(78)
−0.14(79)
−0.13(85)
−0.12(82)
parity
0.43(97)
0.44(97)
0.43(97)
0.44(97)
married
−1.04(99)
−1.03(99)
−1.03(100)
−1.04(100)
drinkN
0.95(85)
0.81(82)
1.04(79)
0.82(74)
firstep
−0.08(77)
−0.07(73)
−0.08(78)
−0.07(80)
welfare
0.94(82)
1.15(83)
6.76(86)
1.53(84)
wpre
0.30(91)
0.29(90)
0.30(90)
0.30(92)
wgain
0.04(80)
0.04(80)
0.04(80)
0.04(81)
education
−0.86(98)
−0.83(97)
−0.86(98)
−0.86(99)
gestation
−0.23(88)
−0.23(88)
−0.23(89)
−0.23(89)
race_other
0.56(87)
0.51(88)
8.31(88)
0.55(83)
race_black
−0.05(86)
−0.03(87)
−0.04(86)
−0.04(84)
race_hispanic
−0.38(90)
−0.35(93)
−0.36(92)
−0.37(96)
race_white
0.59(94)
0.63(98)
0.62(97)
0.61(99)
References
Supplementary Material
Please find the following supplemental material available below.
For Open Access articles published under a Creative Commons License, all supplemental material carries the same license as the article it is associated with.
For non-Open Access articles published, all supplemental material carries a non-exclusive license, and permission requests for re-use of supplemental material or any part of supplemental material shall be sent directly to the copyright owner as specified in the copyright notice associated with the article.