With the recent advances in oncology treatment, restricted mean survival time (RMST) is increasingly being used to replace the routine approach based on hazard ratios in randomized controlled trials for time-to-event outcomes. While RMST has been widely applied in single-arm and two-arm designs, challenges still exist in comparing RMST in multi-arm trials with three or more groups. In particular, it is unclear in the literature how to compare more than one intervention simultaneously or perform multiple testing based on RMST, and sample size determination is a major obstacle to its penetration to practice. In this paper, we propose a novel method of designing multi-arm clinical trials with right-censored survival endpoint based on RMST that can be applied in both phase II/III settings using a global test as well as a modeling-based multiple comparison procedure. The framework provides a closed-form sample size formula built upon a multi-arm global test and a sample size determination procedure based on multiple-comparison in the phase II dose-finding study. The proposed method enjoys strong robustness and flexibility as it requires less a priori set-up than conventional work, and obtains a smaller sample size while achieving the target power. In the assessment of sample size, we also incorporate practical considerations, including the presence of non-proportional hazards and staggered patient entry. We evaluate the validity of our method through simulation studies under various scenarios. Finally, we demonstrate the accuracy and stability of our method by implementing it in the design of two real clinical trial examples.
Multi-arm trials with time-to-event outcomes are increasingly common today due to the limited number of patients and the presence of multiple promising treatment regimens. In a review of PubMed published randomized trials in December 2012 by Odutayo et al.,1 79% of them were parallel-group designs, of which 21% had more than two groups. These trials typically involve a combination of active treatments, different regimens or doses of an intervention, a placebo, or standard treatment. The primary objective of the trial will dictate the appropriate analysis strategy, such as using a single global test to examine intervention differences or adopting a dose–response model in phase II to detect trends.
In the design stage of a multi-arm trial, an important issue is that the sample size required is more complex than a two-arm trial. The complexity arises because of the limited information available for all arms and the need to account for multiple comparisons. In the past, Makuch and Simon2 and Liu and Dahlberg3 proposed heuristic approaches to calculate the required sample size for two-group comparisons and then multiplied it by the number of groups. These methods do not give adequate power and have stringent survival curve settings. Later approaches built the sample size formula on the global test of no overall treatment effects. Ahnn and Anderson4 proposed a sample size formula for comparing more than two survival curves using the log-rank test, and they5 generalized it by allowing for flexibility in patient entry, non-compliance and more using the Tarone–Ware class of test statistics. Recent extensions proposed by Halabi and Singh6 and Barthel et al.7 have addressed issues such as unequal allocation ratios and non-proportional hazards (NPHs) in survival curves. Besides parallel design for multi-arm comparison, multi-arm design based on dose-finding studies such as the method proposed by Andrillon et al.8 and Bornkamp et al.9 have also emerged, as well as the sample size calculation procedure developed by Deng et al.10
The methods discussed earlier mainly use hazard ratios (HRs) to quantify treatment effects analytically. However, with the recent evolution of oncology studies, where the proportional hazards (PHs) assumption is often violated, there is a growing trend of using supplementary measurements, such as mean survival times, to summarize the treatment benefit. NPHs are prevalent in immunotherapy studies, where the treatment effect may be delayed such as the case in Alexander et al.11 This delay makes it challenging to draw clinically meaningful conclusions from HRs, which could lead to misleading results due to model mis-specification.12,13 Furthermore, the HR, averaged over the duration of the trial, does not provide any information about the absolute effect along with accumulated risks or timescale. As a result, it may be difficult for clinicians and patients to comprehend the results. In such cases, restricted mean survival time (RMST), by allowing the treatment effect to be communicated throughout different periods of time in life, can give clinicians a better understanding of treatment benefit and avoid misleading conclusions when NPHs occurs.14
In light of the advantages of RMST, there is a need for the development of sample size formulae based on this measure in multi-arm trials. In fact, there is a surge of interest in developing study designs with RMST, such as the non-inferiority trial proposed by Weir and Trinquart ,15 equality trial by Eaton et al.14 and group sequential design by Lu and Tian16 and Murray and Tsiatis.17 However, there has been little research on sample size calculation for comparing RMST in multi-arm trials. To fill this gap, we propose two main strategies for sample size determination and analysis with different aims. According to the Consolidated Standards of Reporting Trials (CONSORT) extension for reporting multi-arm parallel trials,18 two of the main objectives and analysis strategies in multi-arm trials are to compare all groups at once with a global test and to examine the trend of different doses of intervention with dose–response models. The first research objective is commonly seen in phase III trials. The second objective becomes more popular these years in phase II dose-finding studies such as the chronic obstructive pulmonary disease (COPD) example (see Section 5.2), where four once-daily doses were considered along with a placebo and the five dosage levels were treated as five different arms and an optimal dose along with a dose–response model were finally selected. Given these two aims, we enriched the study for multi-arm treatments using RMST by providing innovative designs tailored to these two objectives. In particular, under the first objective of comparing all groups, we proposed a test for the overall RMST difference and derived a closed-form sample size formula. Under the second objective of finding the optimal dosage level, we extend the classical multiple comparison procedures combined with modeling techniques (MCP-Mod) proposed by Bretz et al.19 to the context of RMST measure and develop a new sample size determination procedure in this context. Both strategies offer valuable insights for researchers working with the RMST endpoint in multi-arm trials. Notice that multi-arm designs may have several other features, such as crossover or factorial designs. However, due to the limitations of space in our manuscript, we primarily focused on the parallel design and its related strategies.
In addition to the above-mentioned benefits, another appealing aspect of the proposed RMST-based sample size formulae is their robustness to the misspecification of distribution assumption compared to conventional HR-based sample size formulae. This is because it requires less setting-up a priori before the trial on survival curves and the variance estimator of the RMST ratio is often smaller than that for HR.20 Furthermore, our approach is also flexible and cost-saving, as it adjusts for piece-wise survival distribution and staggered patient entry in the sample size formula, and it turns out in simulation studies that it achieves the targeted power with a smaller sample size than required by other methods. In addition, RMST benefits from its robust nonparametric inference when compared with the Cox model-based HR.21 The asymptotic normality of RMST and its analytic form of the variance estimator facilitate the calculation of power and sample size. Given the above flexibility and robustness, it can be widely applicable in the practical development of cancertreatments.
The rest of this article is organized as follows. In Section 2, we propose a global test for equality of RMSTs in multi-arm parallel design and the underlying sample size determination method accommodating NPH and staggered patient entry. In Section 3, we provide the MCP-Mod technique built on RMST with its sample size determination procedure. The performance of the proposed methods is demonstrated with simulation results in Section 4 and two real trial examples in Section 5. Section 6 concludes this paper with some discussions.
Multi-arm parallel design for global comparison
Multi-arm parallel design with the aim of global comparison is common in phase II and phase III trials. For example, one of the primary objectives of phase II trials with multiple candidate dose levels is to identify the optimal biological dose to be used in phase III trials that produce the most desirable effect. It is appropriate to compare multiple treatment arms altogether using a single global test to detect the efficacy signal, which is critical to the go/no-go decision at the end of phase II studies. In addition, in phase III trials, multiple treatment comparisons are also very common when considering drug combinations in cancer treatments. In this section, we propose a sample size calculation procedure built upon RMST under the global test of examining whether the intervention effects differ instead of how they differ.
Global test
Suppose in a clinical trial the primary endpoint is a disease-related event, such as death or disease progression, and the variable of interest is the time to event, namely . Consider a trial setting with parallel study arms labeled , in which individual subjects are randomized into one of them with individuals in the th arm. We let represent the control group. The aim is to compare the RMST of the arms globally at a specified restriction time . Let be the RMST in group (). It is of interest to test
against
Further, let and assume for simplicity .
In the cases with right-censored data, RMST is often estimated by the area under the Kaplan–Meier curve , where is the Kaplan–Meier estimator of the survival function . Meier22 proved that the asymptotic mean and variance of are and , respectively, where is the sum of squared coefficient of variation for . Further, Klein and Moeschberger23 provided the Greenwood plug-in variance estimator in the following form:
where are the censoring indicators and number of at-risk samples at the observed time of th sample in group , and is the total number of observed events in group . Tian et al.24 demonstrated that under a mild condition on the censoring distribution, the asymptotic normality for is valid up to the time point , where can be less than or equal to the largest follow-up time in the study. Following their condition, we assume a sufficient condition on the censoring distribution that
for an where is the censoring time, is the probability density function of and . This condition is satisfied as long as the censoring distribution does not approach zero too fast. Given the sample data, , the finite sample approximation of can be defined as the largest follow-up time (either censored or uncensored). If we assume a staggered patient entry under piece-wise uniform distribution with moderate rates, as in most clinical trials, this condition is still satisfied because censoring does not become sparse even close to under the flat and moderate rates of patient accrual. Hence, the test proposed in this article is based on the asymptotic normality of for .
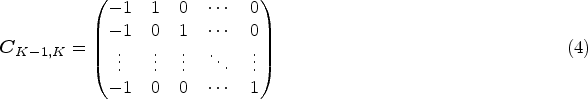
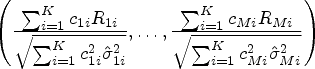
Notice that the global hypothesis in (1) can also be expressed as a form of linear combinations of RMST. We let
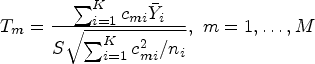
be the coefficient matrix with the th row being a vector of coefficients for the th linear combination of , the global test is equivalent to testing against . Similar to Wald’s statistic testing uncensored means, we propose a statistic for the RMST global test
where is the estimated RMST until and is the estimated variance covariance matrix of , where is the Greenwood plug-in variance estimator of RMST of the th arm as specified in (3). Due to the asymptotic properties that follows a multivariate normal distribution , where can be consistently estimated by , has an asymptotic distribution under .
Sample size calculations for the global test
In the study design stage, we propose to set a priori specification of restricted time in the protocol guided by clinical, practical, and financial considerations as no data is obtained before the trial. In addition, deriving the sample size formula for survival endpoints in multi-arm trials is a complex task that typically requires more specification of the survival curves and their corresponding variances for each treatment group. However, obtaining complete information about survival distributions is often challenging for investigators. To address this issue, we propose a new approach that only requires specification of the survival distribution of the treatment group with the maximum treatment effect, which we call the representative treatment group. For other treatment arms, we assume the same estimated variance of RMST as that in the representative treatment arm. By avoiding the need to specify all treatment survival distributions, this technique offers greater flexibility and reduces the risk of mis-specifying survival curves, making it a valuable tool in real-world situations. We will later confirm through empirical study that this assumption is reasonable, and even if violated, it does not significantly affect the power.
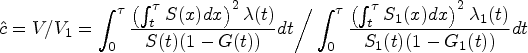
Consider a multi-arm clinical trial with arms, where the first arm represents the control group. We assume that the variance in each treatment group is equal and denoted as . However, the control arm may have a different variance, denoted as , and we define a constant to account for this difference. To simplify the study design, we assume an equal allocation of subjects in each group. Under these assumptions, we can express the difference in RMST between each treatment group and the control group as , where . The hypothesis in (1) can be formulated as for . With this notation, the test statistic can be simplified as follows:
where and A detailed derivation can be found in the Appendix. It is important to note that the simplification discussed here is only intended to facilitate the sample size calculation procedure by linking the required sample size to the desired power through statistical information. The exact test still takes the form of (5). Under the alternative hypothesis , where for at least one , we have . As a result, the test statistic follows a non-central distribution, where represents the degrees of freedom and is the non-centrality parameter.
On the one hand, the non-centrality parameter needs to be known to achieve a given power and significance level that
where is the upper quantile of .
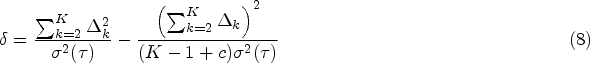
On the other hand, the non-centrality parameter can be derived from the known ’s and . By equating the first moment to , that is, the expectation of , we have
A detailed derivation of can be found in the Appendix.
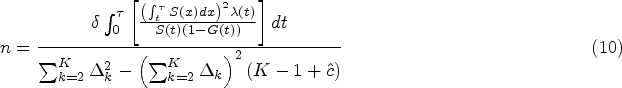
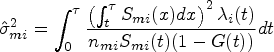
Then the required sample size can be solved by equating (7) and (8) after replacing by its asymptotic value. Specifically, Pepe and Fleming25 showed that given the known RMST margin and setting the survival distribution , hazard function , cumulative loss to follow-up distribution of the representative treatment group and control group, respectively, as well as the restriction time , asymptotic variance in the representative treatment group can be expressed as
where . can be derived in a similar manner. Then, for a simple case of equal allocation of sample size, the sample size required in each arm is given by
where
It is worth noting that the sample size calculation procedure presented in (10) assumes a simple case of equal allocation of sample size. However, in practice, it is often the case that more patients are assigned to the new treatment than those in the control group to learn more about the new drug. In this case, an unbalanced allocation ratio between treatment and control is used, denoted by , where is the sample size for the control group. The sample size required for the control arm can be obtained by modifying equation (10) as follows:
Note that the above sample size formulae can also accommodate NPH by flexibly selecting the survival distribution such as a piece-wise exponential distribution.
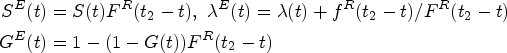
Another concern is that in reality, patients are often not all recruited at the beginning of the trial, but enter the trial sequentially over an accrual period, and then are followed up for another fixed period with no new patients entering. At the end of the trial, administrative censoring occurs with some of them not experiencing the events yet. This is known as staggered patient entry, and it can be accommodated in the sample size calculation framework with a minor modification. Define a cumulative distribution function of the patient recruitment time such as the piece-wise uniform distribution within an accrual period from calendar time 0 to , and the planned follow-up time , where , administrative censoring is brought into the trial. Let be the calendar time when the patient is accrued, due to the administrative censoring, the potential exposure time since patient entry becomes where denotes the patient survival time. Then the survival function, hazard function, and censoring distribution adjusting for staggered patient entry are, respectively,
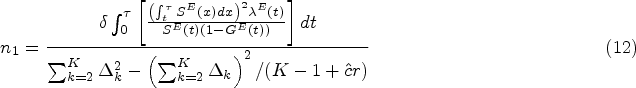
Hence the required sample size in the control group under a certain allocation ratio becomes
Multi-arm dose-finding studies with modelling
Parallel design aims to detect an overall difference in intervention effects. In phase-II dose-finding studies where the main objective is to examine a trend of the dosage effects, the proposed global test is not sufficient and a dose–response model should be considered in the test. In this section, we propose a more sophisticated hybrid approach for multi-arm dose-finding study with RMST motivated by MCP-Mod19 as well as the sample size calculation. The test still utilizes the linear combinations of RMST but in addition, provides flexibility in modeling the relationship between dosage levels and RMST. We will start this section by introducing MCP-Mod first.
Multiple comparison procedures combined with modeling techniques (MCP-Mod)
MCP-Mod is a unified approach in dose-finding study, which innovatively combines the proof-of-concept (PoC) with dose-finding into a single study. By combining multiple comparison procedures with modeling techniques into one step, this method leads to a seamless design. In their framework, the response is an uncensored continuous variable observed for a given set of groups of patients corresponding to an increasing dose sequence , where represents the dose in the placebo group. For the purpose of detecting a global dose–response trend, MCP-Mod assumes a linear model of the response
where is the mean response at dose and is the candidate dose–response model with parameter , while refers to the dose group and refers to the patient within group . Historical data and clinical experts’ opinions will provide initial knowledge or guess to determine the parameters of the dose–response model.
To achieve the goal of model selection, a set of parameterized candidate models is assumed, corresponding to the mean response vectors for model under the doses , . Under these models, contrast coefficient subject to and is further determined for the purpose of constructing the test of PoC for each model (see Section 3.1** in Bretz et al.19). Then each of the dose–response models is tested by a single contrast test with against . This leads to the contrast test statistic defined as
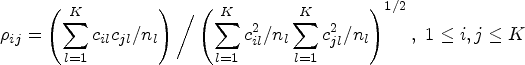
where is the pooled variance and . Note that although the true model is unknown, MCP-Mod can control the familywise error rate (FWER) when establishing PoC and selecting the best model out of the candidates. To achieve a single decision of the existence of the trend, that is, at least one is rejected, the final test statistic for verifying PoC takes . PoC is established if , where is a multiplicity adjusted critical value obtained by the equicoordinate upper quantile of the joint distribution of the vector of contrast statistics under in (1). It follows that , a multivariate distribution of dimension with degrees of freedom and correlation matrix , where
Once PoC is established, the best model among all significant candidate models is selected for dose estimation in the last stage of MCP-Mod. A -value method or other criteria Akaike information criterion or Bayesian information criterion can be adopted to select the best model. After that, the target dose of interest can be estimated by the selected dose–response model, but this is beyond the scope of this paper.
MCP-Mod with endpoint measured by RMST
Now, we consider dose-finding clinical trials where the response of interest can be right-censored such as time-to-toxicity in oncology trial designs with an aim of detecting an overall trend as well as model selection, and completing the MCP-Mod for a right-censored response from the perspective of RMST. In this case, although the survival outcome no longer follows a normal distribution, we can still apply the candidate models on RMST thanks to the asymptotic properties of the RMST estimator. Suppose that patients are followed up for an observation window until time . We concentrate on the PoC stage to test the difference of RMST among dosage levels and model selection, while the followed dose selection procedure can be done naturally by any covariate-adjustment RMST method such as the method proposed by Tian et al.,26 which we leave to the readers for further exploration.
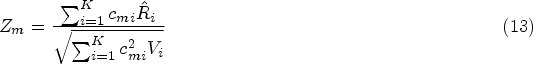
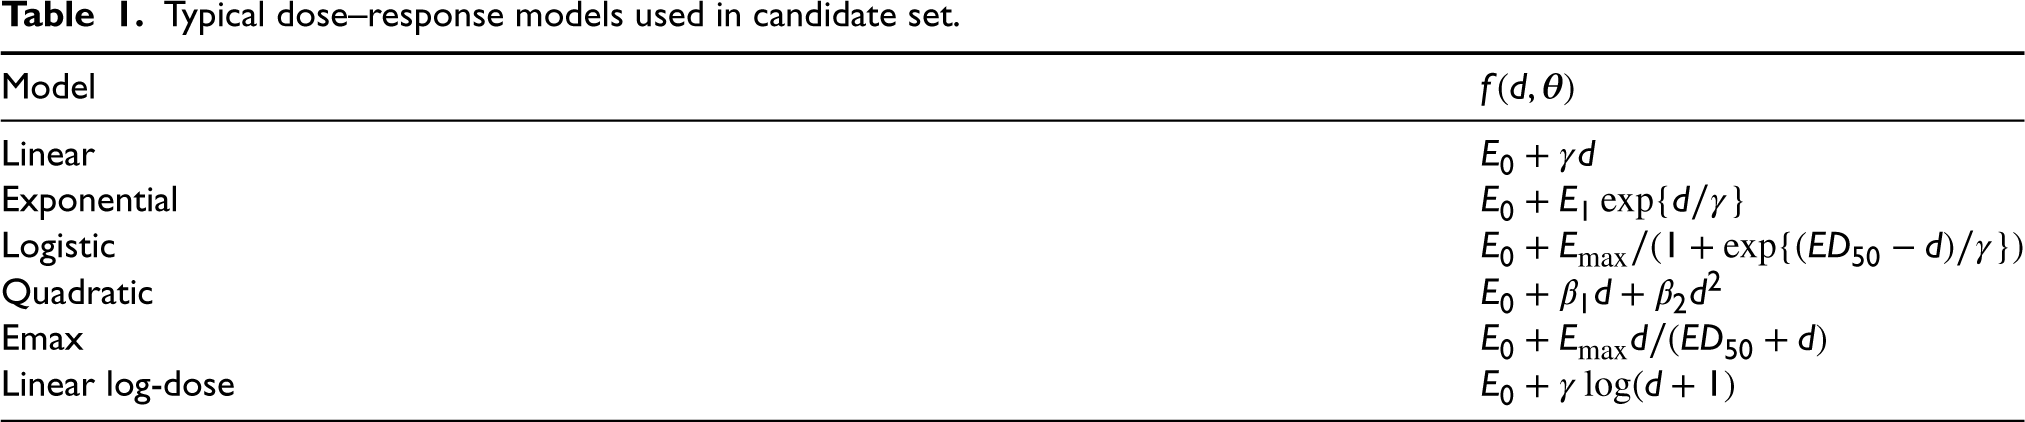
Assume that with some clinical knowledge, a candidate model set and the model parameters at a specified time point are given, that is, for each dose planned, the model generates . can be viewed as in Section 3.1, and . Frequently used potential candidate models are listed non-exhaustively in Table 1. Further assuming the pre-determined known contrast coefficients has been computed (Section 3.2.1) under the constraints and , we test on the null hypothesis . Without loss of generality, we suppose that if a dose–response relationship exists, dosages higher than always result in a larger RMST. Then the alternative hypothesis corresponds to while in the other way around a left-tailed test is adopted. Either way, the test statistic becomes
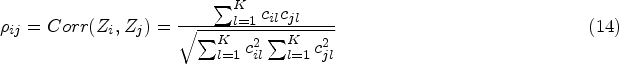
where is the estimated RMST and is the same Greenwood plug-in estimator in group as defined in equation (3). In this way, the unified statistic proposed in equation (5) is split into -statistics to achieve the goal of model selection. Due to the asymptotic normality of , follows under and jointly follows , where is the variance–covariance matrix with
A detailed derivation is shown in the Appendix. Then, the critical value can be derived by computing the equicoordinate quantile function of this distribution, or by solving
In order to combine them into a single decision of PoC, we take such that for a critical value , a significant dose–response signal is established if .
Typical dose–response models used in candidate set.
Model
Linear
Exponential
Logistic
Quadratic
Emax
Linear log-dose
Once at least one individual test is significant, PoC is established with a reference model set leading to significant contrast tests. Note that FWER is also strongly controlled at for each single contrast test. In the second step after PoC is verified, we go through the tests one by one and decide upon the best model among those in the reference set. Good candidate models can be evaluated by simple criteria such as the minimum -value or absolute predicted error.26 It is shown in the simulation that under a sufficient sample size, the model can be selected accurately even if the candidate model parameters do not fit the true ones well.
An additional advantage of the proposed method is its emphasis on modeling. Once the multiple comparison procedure is completed with a selected optimized model, the final step in MCP-Mod consists of fitting the dose–response model. We propose to estimate the relationship between RMST and dosage levels by nonlinear least squares estimates given in Bates and Watts.27 Since the optimization relies heavily on the initial parameter estimates and sometimes the data is not enough to fit a model due to limited dosage levels, we propose to do data augmentation before modeling to increase the amount of data. Specifically, we add simulated copies of RMSTs at each dosage level from to the original . Then the estimated model can be used in dose selection, for example, the selection of the smallest dose that shows a clinically relevant and statistically significant effect.28
Optimum contrast coefficients
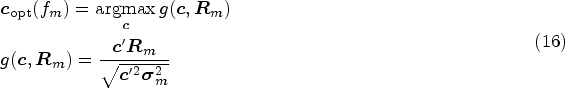
The implementation of the above method starts by assuming the parametric candidate models, doses, and sample size, followed by computing the optimum contrast coefficients. Candidate models fitting the true curves well, together with the contrast coefficients will boost the power of the test and reduce the required sample size. In this subsection, we discuss the determination of optimum contrast coefficients given a specified model . Under the same sense from Bretz et al.,19 we aim to maximize the probability of rejecting the null hypothesis when the model is correct.
Let be the objective function of rejecting when the model is correct, where is the RMST vector under model and is the vector of contrast coefficients. Denote the vector of optimum contrast coefficient under model with constraints of and . It can be shown that maximizing the chance of rejecting when the model is correct it is equivalent to
where the theoretical variance of RMST under model is is derived from (9) by assuming exponential survival for group and a same loss to follow-up distribution. Specifically, we obtain by solving . Notice that cannot be expressed in closed form so we adopt the technique of spherical parameterization29 to reparameterize the coefficients. The detailed optimization procedures are presented in the Appendix. In this way, constrained optimization translates into a more robust and easier unconstrained one, and standard numerical optimization is available in any software to obtain .
Power and sample size calculations for MCP-Mod of RMST
In practice, it is a crucial step at the study design stage to determine the sample size required for certain purposes. For dose-finding studies with time-to-event response variable, we aim to determine the sample size required to ensure a minimum power level for detecting the dose–response relationship under a certain dose–response model with RMST vector . For simplicity, we restrict ourselves to the equal allocation of sample sizes in each dose group, while the general cases of unbalanced design are also straightforward. Assuming the candidate set of models , the common cumulative loss to follow-up distribution , hazard and survival functions (e.g. the exponential survival distribution) that yields the corresponding , restriction time , type-I error , and power , under the above MCP-Mod method for survival endpoint, we first consider the power calculation under model . It follows from the distribution of the test statistic in Section 3.2 that the power to detect PoC is
where is the critical value. can be computed by the “pmvnorm” function in R of a multivariate normal distribution with correlation matrix and mean vector
where
is the theoretical variance under model 30 in terms of the design parameters. Then under certain sample size , a power vector can be obtained without any knowledge of the true model under . To synthesize the power vector into a single value, we can adopt different weight functions or any summary function, for example, we can simply use a conservative approach to condense it into as the unified power measure. Then the sample size can be determined by searching for the smallest integer from an initial value until the unified power reaches the target .
In the next section, we will investigate how the restriction time and RMST margins between each treatment and control group affect the sample size required. Basically, the required sample size relies mainly on the combination of effects of candidate models and parameters.
Simulation studies
We conducted simulation studies to investigate the performance of the proposed sample size determination methods for the global test and dose-finding studies. Specifically, we aimed to answer the following questions: Does the proposed sample size formula for global testing provide accurate estimates under PH and NPH scenarios? Secondly, how well do the sample size estimator and model selection procedure with MCP-Mod perform in dose-finding studies? Thirdly, how do factors such as restriction time, number of treatment arms, RMST margins, and candidate model settings in MCP-Mod affect the performance of sample size determination? Lastly, how does the performance differ between the two proposed sample size determination procedures and conventional methods in multi-arm designs? To answer these questions, we look into global tests for PH scenarios and NPH scenarios, as well as the dose-finding studies separately in the following subsections.
In all sets of simulations, we assumed patients would be accrued at a constant rate over two consecutive periods before months and would be followed up until months. Specifically, patient entry followed a piece-wise uniform distribution with a rate of 1 out of 16 before 8 months and then a rate of 1 out of 8 until 12 months. Independent right-censored time follows an exponential distribution with an annual dropout rate of 5%. Other design specifications included a 9-month median survival time for the control group with exponential survival, a goal of attaining 90% power, and a type-I error of . We present all simulation results of the required sample size and empirical power based on 1000 simulated trials in Tables 2 to 4.
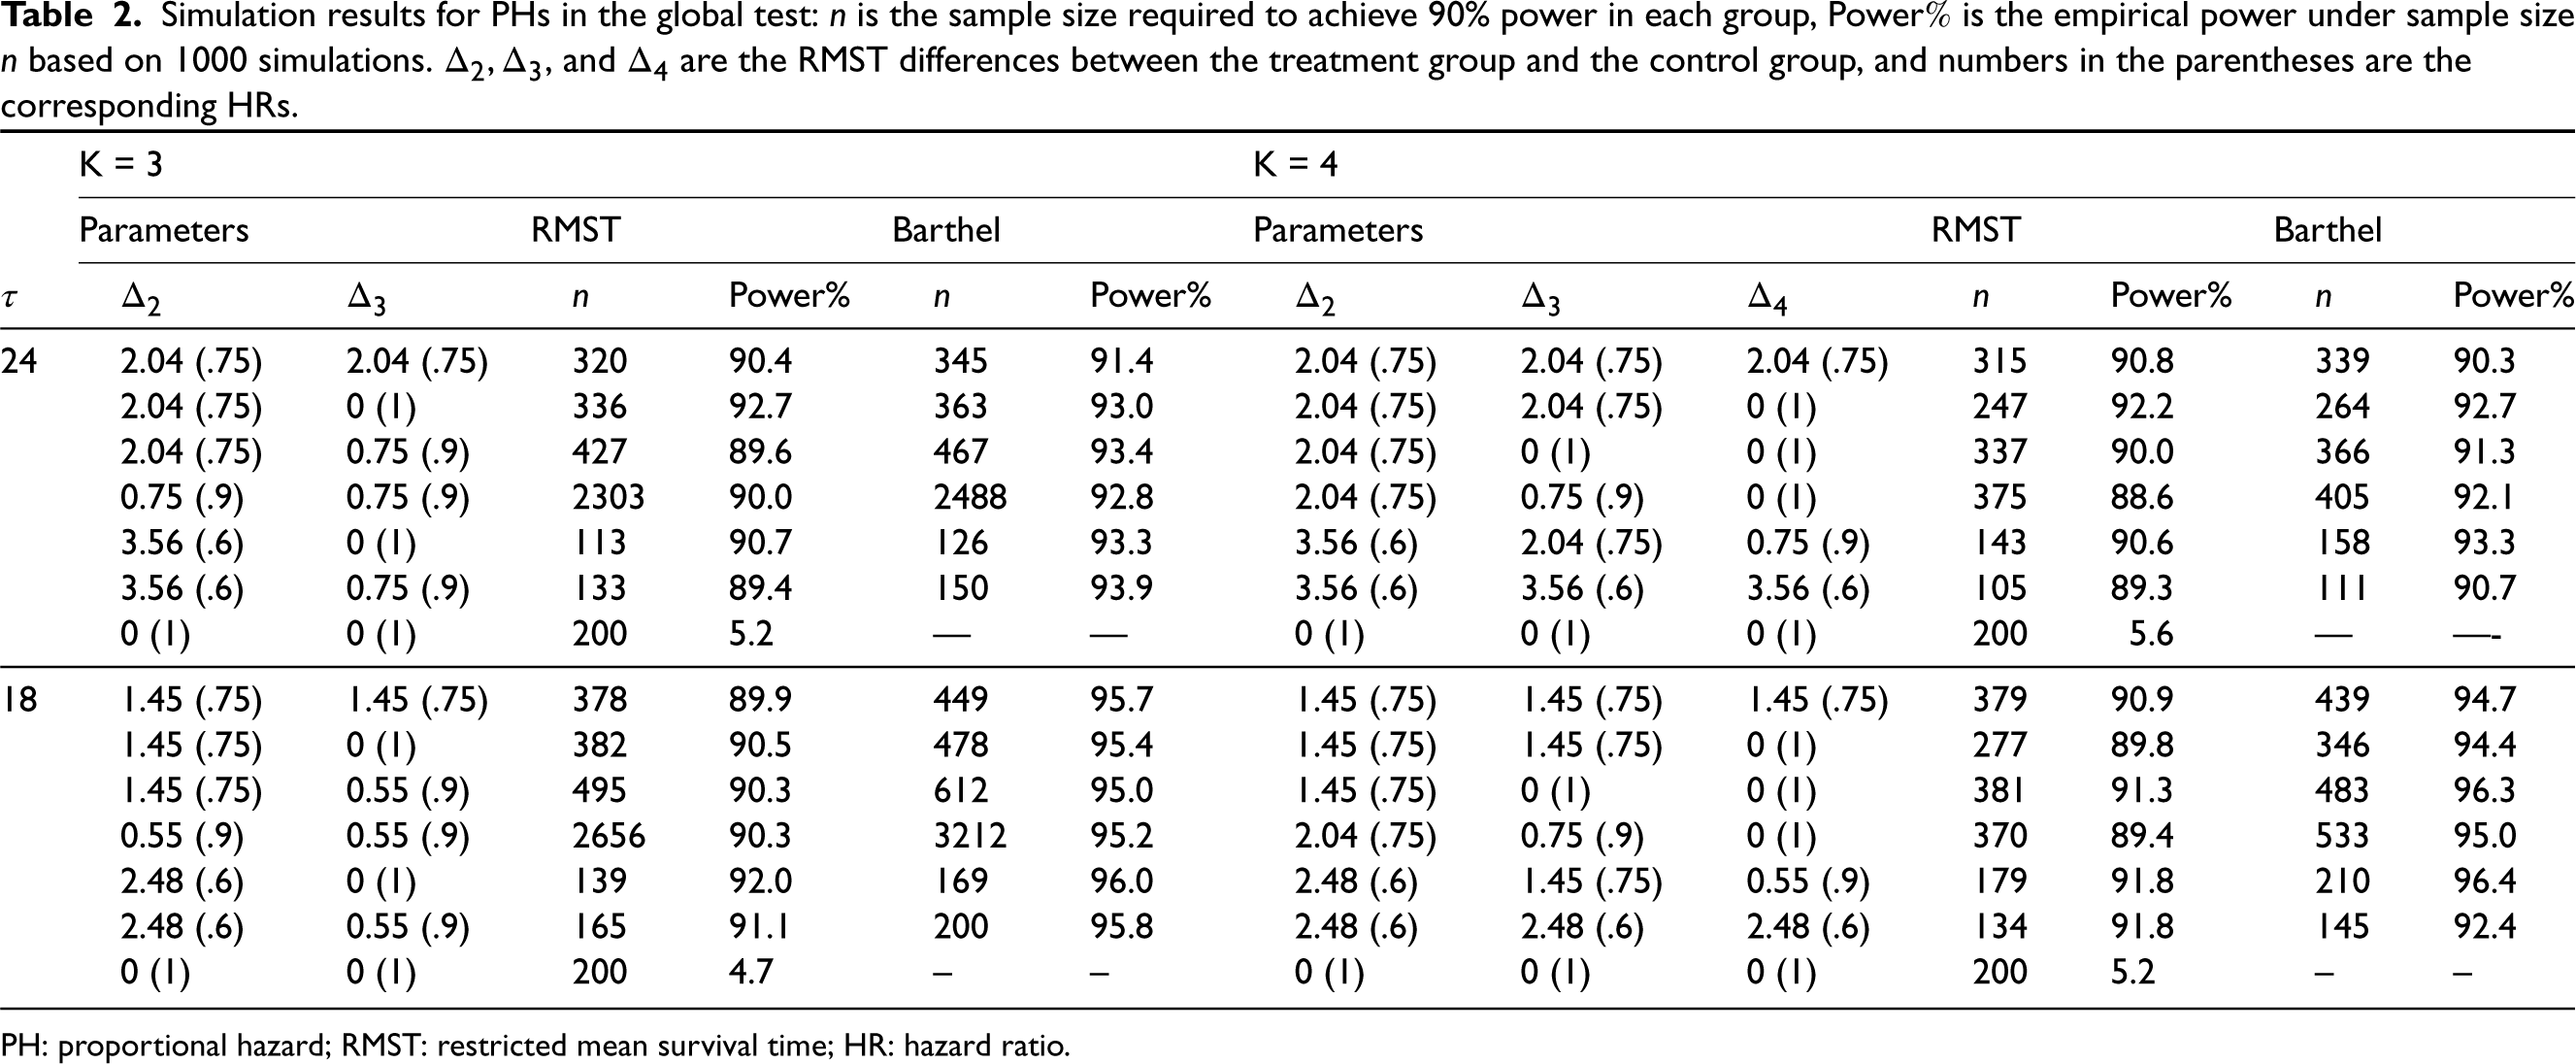
Simulation results for PHs in the global test: is the sample size required to achieve 90% power in each group, Power is the empirical power under sample size based on 1000 simulations. , and are the RMST differences between the treatment group and the control group, and numbers in the parentheses are the corresponding HRs.
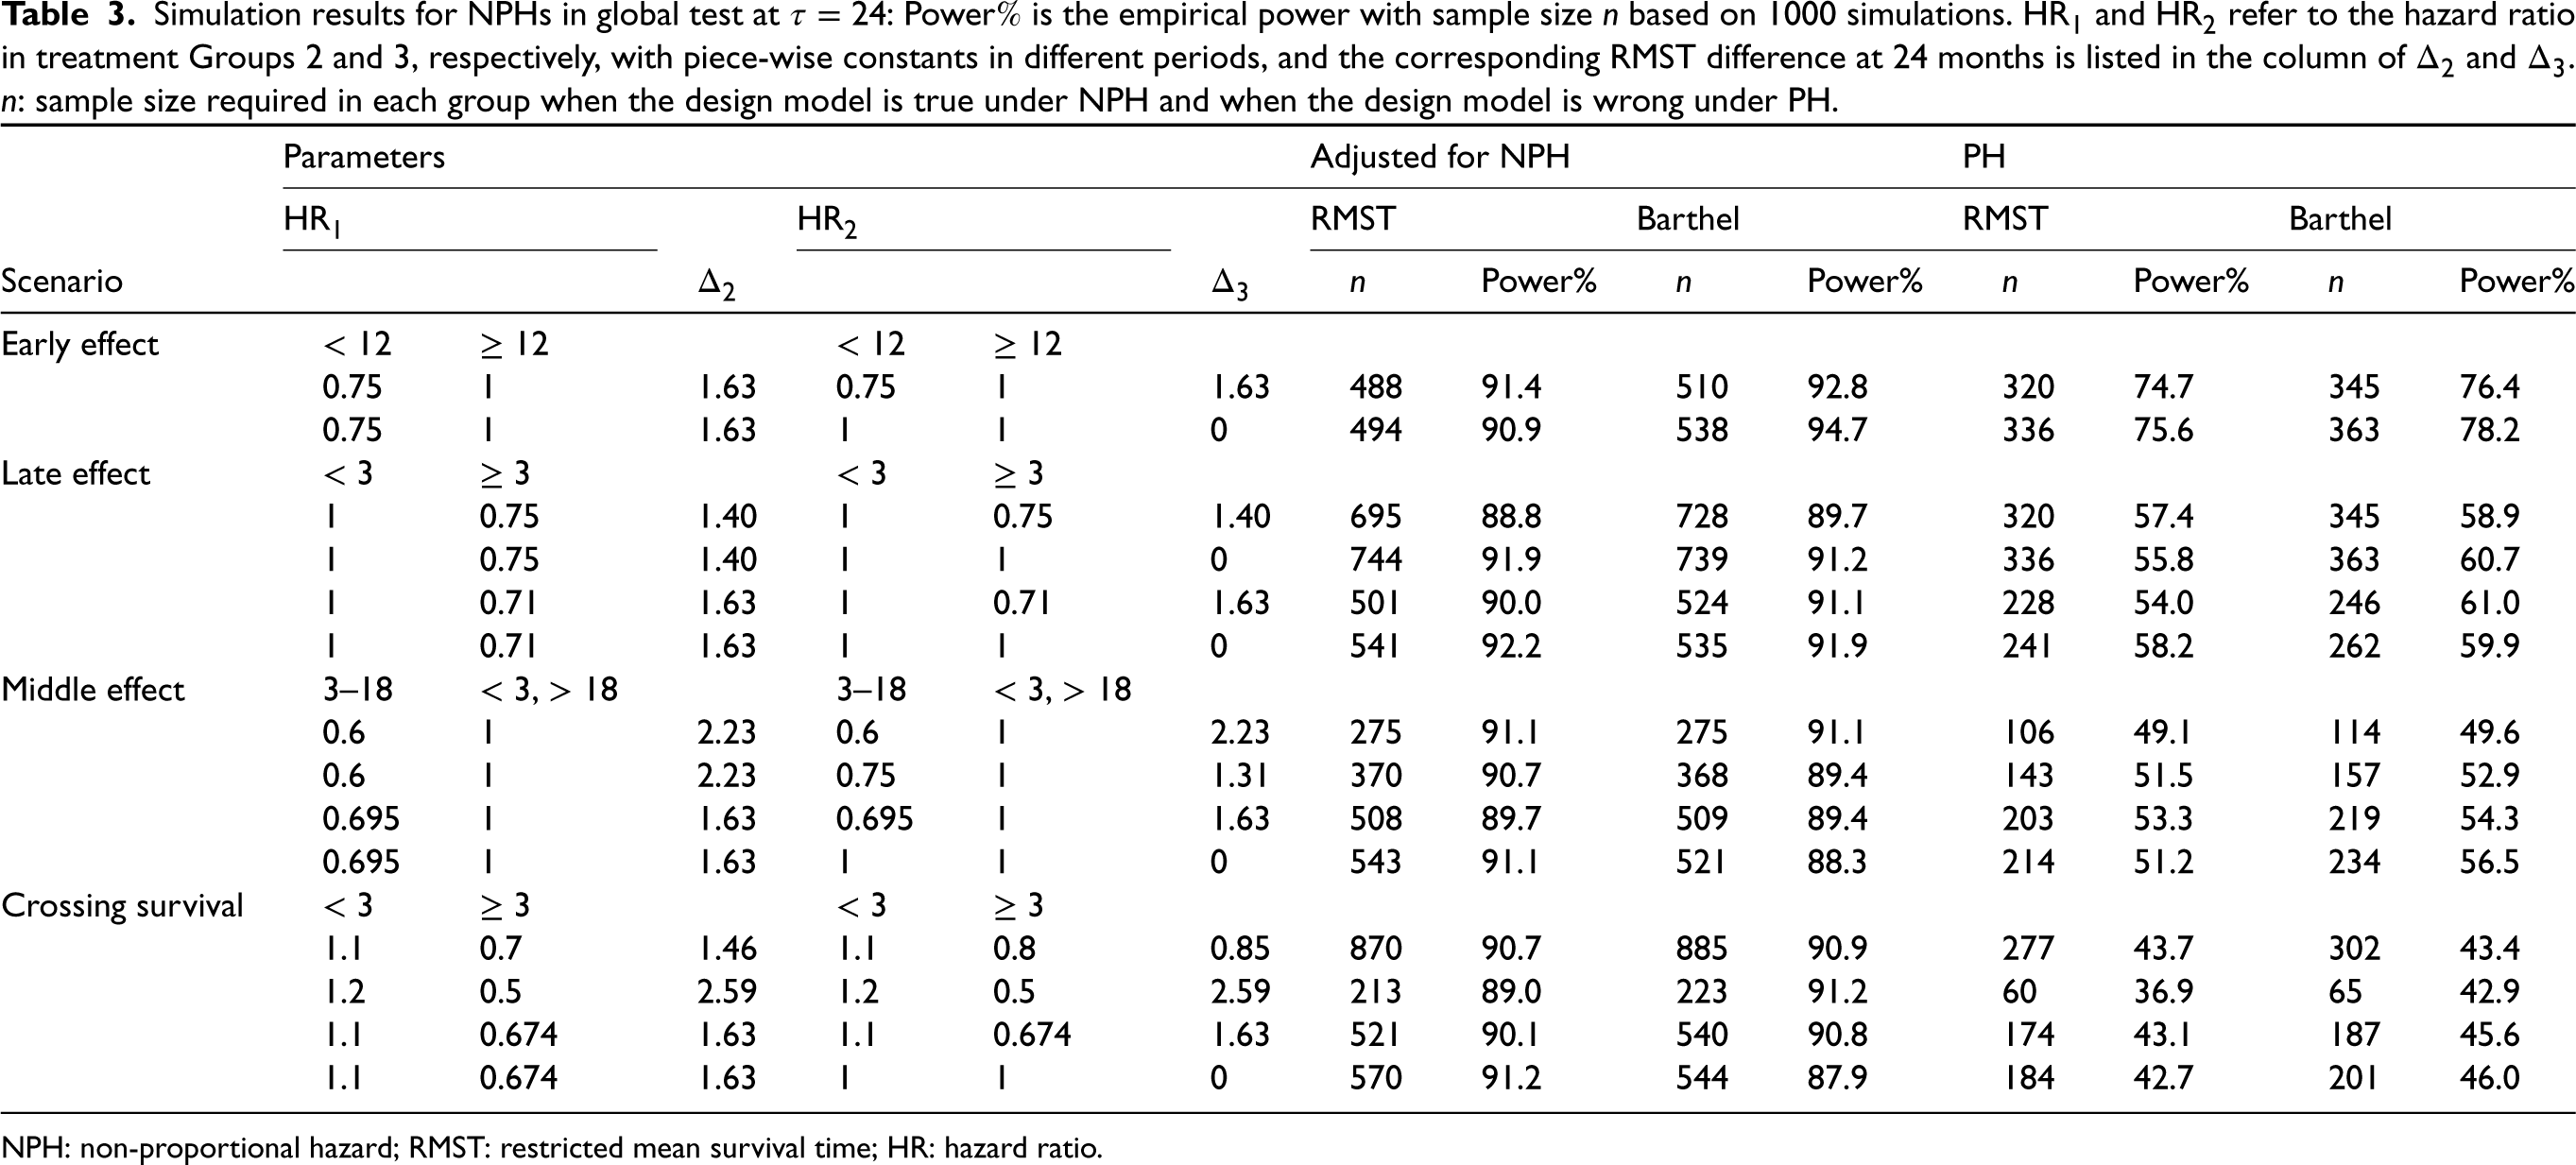
Simulation results for NPHs in global test at : Power is the empirical power with sample size based on 1000 simulations. and refer to the hazard ratio in treatment Groups 2 and 3, respectively, with piece-wise constants in different periods, and the corresponding RMST difference at 24 months is listed in the column of and . : sample size required in each group when the design model is true under NPH and when the design model is wrong under PH.
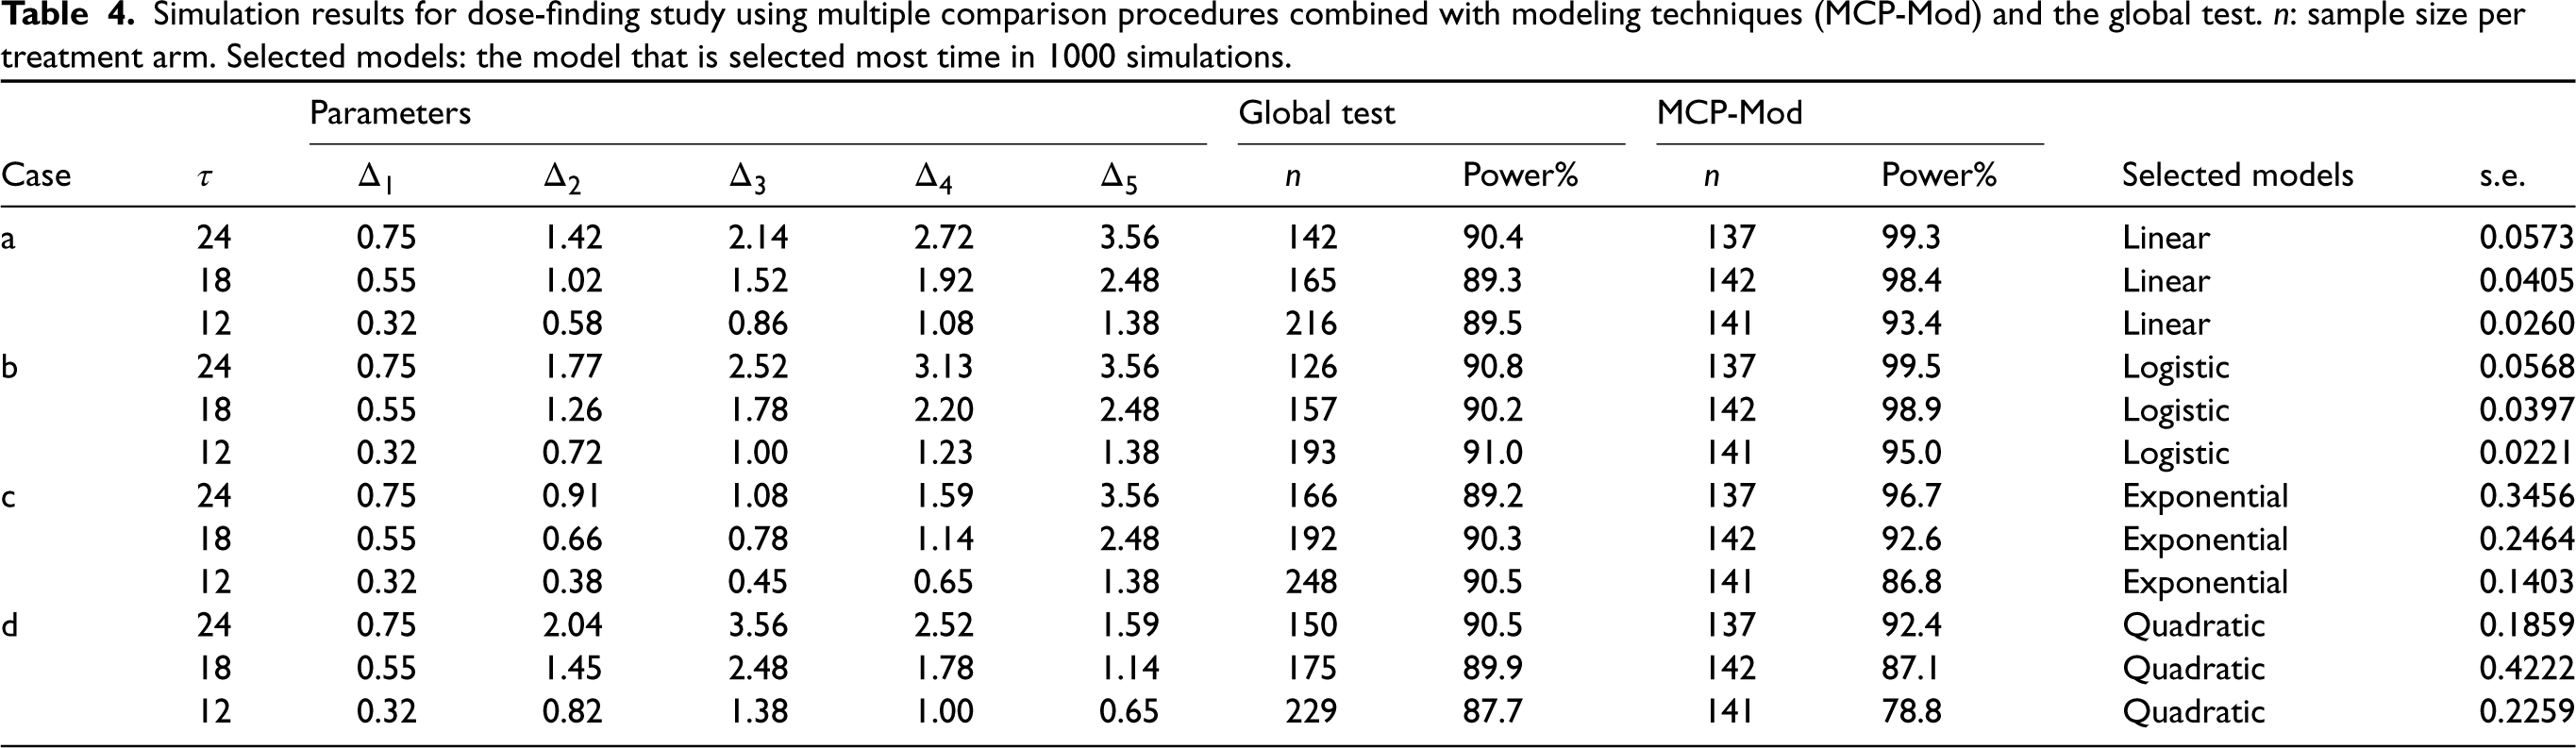
Simulation results for dose-finding study using multiple comparison procedures combined with modeling techniques (MCP-Mod) and the global test. : sample size per treatment arm. Selected models: the model that is selected most time in 1000 simulations.
Parameters
Global test
MCP-Mod
Case
Power%
Power%
Selected models
s.e.
a
24
0.75
1.42
2.14
2.72
3.56
142
90.4
137
99.3
Linear
0.0573
18
0.55
1.02
1.52
1.92
2.48
165
89.3
142
98.4
Linear
0.0405
12
0.32
0.58
0.86
1.08
1.38
216
89.5
141
93.4
Linear
0.0260
b
24
0.75
1.77
2.52
3.13
3.56
126
90.8
137
99.5
Logistic
0.0568
18
0.55
1.26
1.78
2.20
2.48
157
90.2
142
98.9
Logistic
0.0397
12
0.32
0. 72
1.00
1.23
1.38
193
91.0
141
95.0
Logistic
0.0221
c
24
0.75
0.91
1.08
1.59
3.56
166
89.2
137
96.7
Exponential
0.3456
18
0.55
0.66
0.78
1.14
2.48
192
90.3
142
92.6
Exponential
0.2464
12
0.32
0.38
0.45
0.65
1.38
248
90.5
141
86.8
Exponential
0.1403
d
24
0.75
2.04
3.56
2.52
1.59
150
90.5
137
92.4
Quadratic
0.1859
18
0.55
1.45
2.48
1.78
1.14
175
89.9
142
87.1
Quadratic
0.4222
12
0.32
0.82
1.38
1.00
0.65
229
87.7
141
78.8
Quadratic
0.2259
In particular, we also apply the sample size determined in multi-arm design by the log-rank global test proposed by Barthel et al.7 as a comparison in Tables 2 and 3. Notice that many sample size determination procedures for two treatments’ comparison have been proposed for survival outcomes. For example, a parametric way (exponential survival model-based) from Lachine and Foulkes31 and a Cox PH model-based method from Freedman.32 The former accommodates staggered patient entry and loss to follow-up but the latter does not. To illustrate the better performance of the proposed multi-arm design with these conventional methods, we apply Bonferroni correction on these two methods to derive the sample size as well as the statistical power. In the study design, the postulated HR is based on Groups 1 and 2. The sample size is validated through the test for equivalence of exponential survival rate (Lachin33) and log-rank test for the two methods, respectively.
Global test under PHs
The simulation results for the PHs setting are presented in Table 2. We considered and with varying RMST margins (effect size) between each pair of treatment and control, while the restriction time was fixed at 24 and 18 months. We set the representative treatment arm to be the second arm and assumed exponential survival for all treatment groups. By varying the RMST and the corresponding HRs (listed in brackets in Table 2) in different arms, we investigated how the violation of the equal variance assumption affected the power and sample size. We determined the sample size based on (12), which adjusts for staggered patient entry, and then conducted the global test proposed in Section 2.1 to investigate the empirical power under the determined sample size. The simulation results for conventional methods with Bonferroni correction are shown in Table S1 in the Supplemental materials.
We can observe that when the treatment difference is moderate, the power can be well maintained at around 90% under the calculated sample size, which verifies the validity of the assumption of equal RMST variance across treatment groups. Basically, the smaller the variation among treatment effects, the closer the empirical power to the target. Compared with the method proposed by Barthel et al.,7 the RMST method is more accurate and reduces the cost in most cases, while the log-rank-based method is conservative, especially when the analysis time is short. The required sample size is influenced by a combined effect of the effect size and how many groups share the same RMST. Roughly speaking, a larger effect size (difference between treatment and control) along with a larger variation of the RMST among different treatment arms leads to a smaller sample size. Further, the restriction time has a large impact on the sample size required. Under the same survival function, there is a to increase in sample size when compared with . The last row in the table of each shows the type I error, which is well maintained at around . From Table S1 in the Supplemental Material, we can tell that the Bonferroni correction under Lachin and Foulkes’ method often necessitates a larger sample size due to its stringent model assumptions, but the power is well maintained because the sample size determination accommodates staggered patient entry and loss to follow-up. On the other hand, Freedman’s sample size calculation is less conservative than Lachin and Foulkes’ method but more conservative than the proposed method. Hence the empirical power is larger than it designed because it is not able to accommodate staggered patient entry as well as the loss to follow-up. As these situations often exist in real clinical trials, the proposed sample size determination based on the global RMST test is more appropriate than the multiple correction methods.
Global test under NPHs
The simulation results for a wide range of NPH scenarios are presented in Table 3. To simulate the NPH scenarios, we used a piece-wise exponential distribution. We considered a 3-arm design, and the hazards in the treatment arms varied over different time periods, leading to different overall . We calculated the sample size at . The column named by ‘Adjusted for Non-PH” presents the method of determining sample size using parameters specified in Table 3, which takes NPHs into account. The representative treatment group is still Group 2. To facilitate comparison, the last four columns in the table show the results when the PHs assumption are adopted without considering changes in HR over time, and the underlying assumed HR is fixed at the minimum HR in each group, thus resulting in a smaller sample size required and a very low power. With the parameters designed, we simulated four situations, including early effect, late effect, middle effect, and crossing survival functions. These situations are common in targeted therapy and cancer immunotherapy. For example, late divergence of the survival curves occurs when there is a bridging therapy in each arm before the action of a therapy, while early separation of survival curves occurs when the drug is effective at the beginning, but patients experience a leveling off thereafter. The simulation results for conventional methods with Bonferroni correction are shown in Table S2 in the Supplemental Materials.
In summary, the simulation results in Table 3 demonstrate the effectiveness of the proposed RMST method in accurately estimating the required sample size and achieving the targeted power under a wide range of NPHs scenarios. The results also highlight the importance of considering the NPH assumption in the design stage, as using the PH assumption can lead to a severe underestimation of sample size, especially when crossing survivals occurs at a relatively early time before . Furthermore, we can observe that under the same RMST margin , the early effect case requires fewer samples than the middle effect, while in the late effect situation, RMST design requires a larger sample size. This is reasonable since in a delayed effect situation, the potential differences of survival curves are more likely to be partially taken into account in the followed-up units of time. In this example, Barthel’s sample size can also maintain the power well but is slightly inferior to the proposed RMST test with regard to the robustness. From Table S2 in the Supplemental material, we can tell that Freedman’s sample size is the least conservative while Lachin and Foulkes’ sample size is the most conservative, but they both face severe power dilution when NPHs exist. The simulation emphasizes the importance of using RMST-based tests and sample size determination as it accommodates NPHs.
In summary, the sample size determination method is quite robust to the equal variance assumption in treatment arms, both in the constant hazard and non-constant hazard cases, and is more accurate and cost-saving than that of Barthel et al.7 These findings highlight the importance of considering the potential violation of the proportional hazards assumption and using RMST as a tool when designing clinical trials and calculating sample size efficiently.
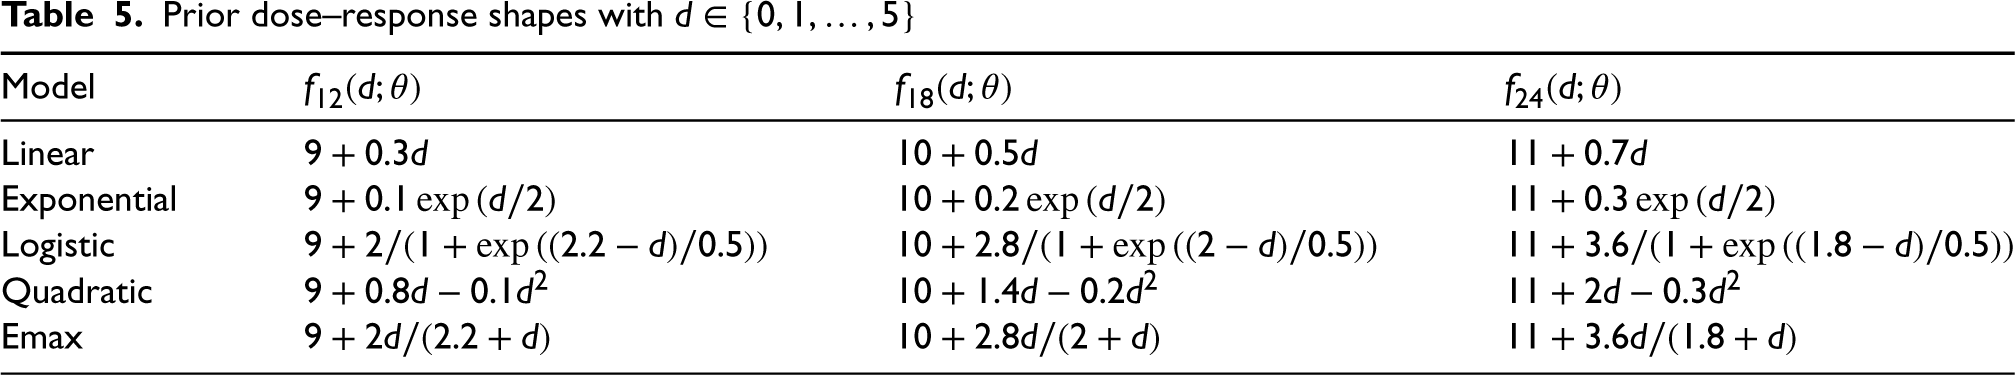
Prior dose–response shapes with
Model
Linear
Exponential
Logistic
Quadratic
Emax
MCP-Mod with endpoint measured by RMST under dose-finding studies
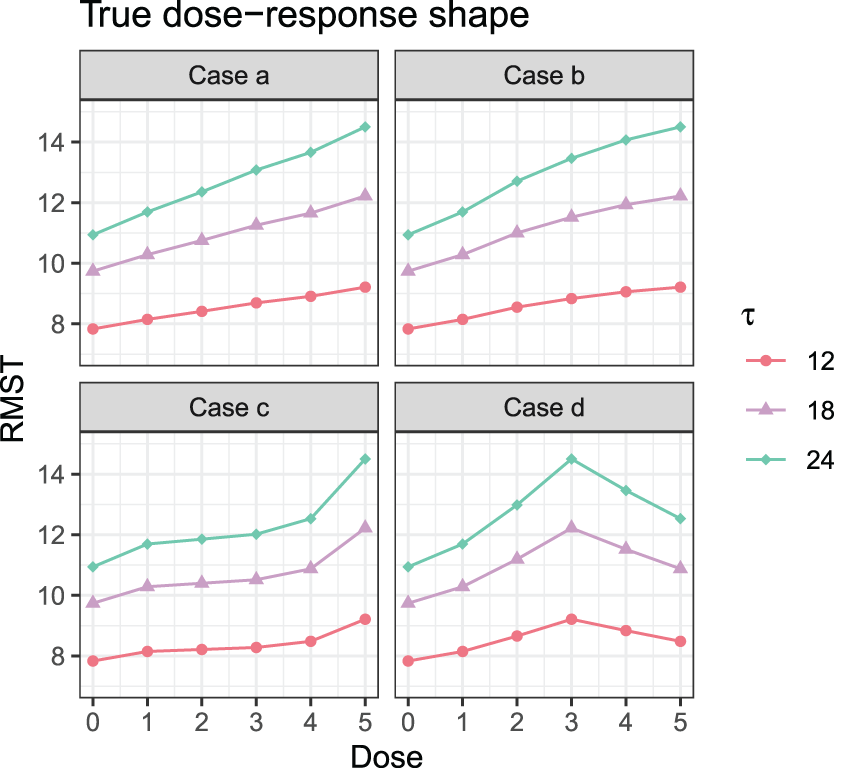
In this subsection, we study the performance of MCP-Mod for endpoint measured by RMST in a dose-finding study via simulation. We investigated six dose levels , with RMST measured at three restriction time points Five different dose–response models for RMST were assumed prior to data generation and are given in Table 5. All the shapes are within a similar range. Four different cases with different HRs in each group are investigated: (a) ; (b) ; (c) ; and (d) . Figure 1 displays the true dose–response shapes for all scenarios regarding RMSTs, where the HRs on the optimal dose are all at 0.6. Under these settings, by adopting a conservative summary power function , we calculate the required sample size using the proposed method for the purpose of establishing the PoC in Table 4. The empirical power under the required sample size and model selection results via the minimum -value approach are shown in the table as well. Then given the selected model, we fit the corresponding nonlinear parametric model and summarize the standard errors for nonlinear least squares in the table. To compare the sample size under the proposed two methods with and without modeling, we also compute the sample size determined through a global test. Basically, by assuming candidate models of the dose–response shape in the design stage, the sample size needed can be dramatically reduced by at most .
True dose–response shapes in simulation studies.
The required sample size relies on the collective effect of model parameters, summary power function, restriction times, and the margin of the effects. Generally speaking, the restriction time alone has little effect on the sample size while other factors affect the sample size a lot. When the candidate model fits the data well, power can be better maintained at the target level of 0.9. Here, “shape” means the shape of the curve as well as the absolute difference between the true curve and candidate curves. For example, in Case d, though the candidate shapes are not exactly the same as the true dose–response shape shown, the absolute difference between the assumed RMST level and true RMST are quite close when , thus resulting in a well maintained power level. On the other hand, the good thing is that the model selection performance is good no matter how the candidate models fit the true dose–response relationship.
Trial examples
Two real clinical studies with right-censored data are analyzed in this section to illustrate the proposed sample size determination procedure.
CheckMate 451 trial
CheckMate 451 trial, a double-blind, three-arm, phase III study,34 with an aim to evaluate the efficacy of nivolumab plus ipilimumab and nivolumab monotherapy as maintenance therapy for extensive-disease small-cell lung cancer following first-line chemotherapy. In total, 834 patients were randomly assigned in a ratio to the nivolumab plus ipilimumab arm, nivolumab arm, and placebo arm. However, there was a three-month delay between the patients’ last chemotherapy dose and random drug allocation, resulting in NPHs of the KM curves. The survival function of the placebo arm was modeled using four hazard pieces, with assumed overall survival (OS) rates of 90%, 47%, 15%, and 9% at 3, 9, 18, and 26 weeks, respectively. For the combination of nivolumab and ipilimumab and nivolumab alone, a delayed effect versus placebo was assumed, with a HR of 1 for the first 3 months and an HR of 0.68 thereafter. The study also considered a 5% probability of dropout by month 6, and patients were uniformly accrued over 28 weeks. A HR of 0.72 was deemed clinically relevant, and the trial was designed with 90% power and 0.05 type I error, with a total follow-up duration of weeks.
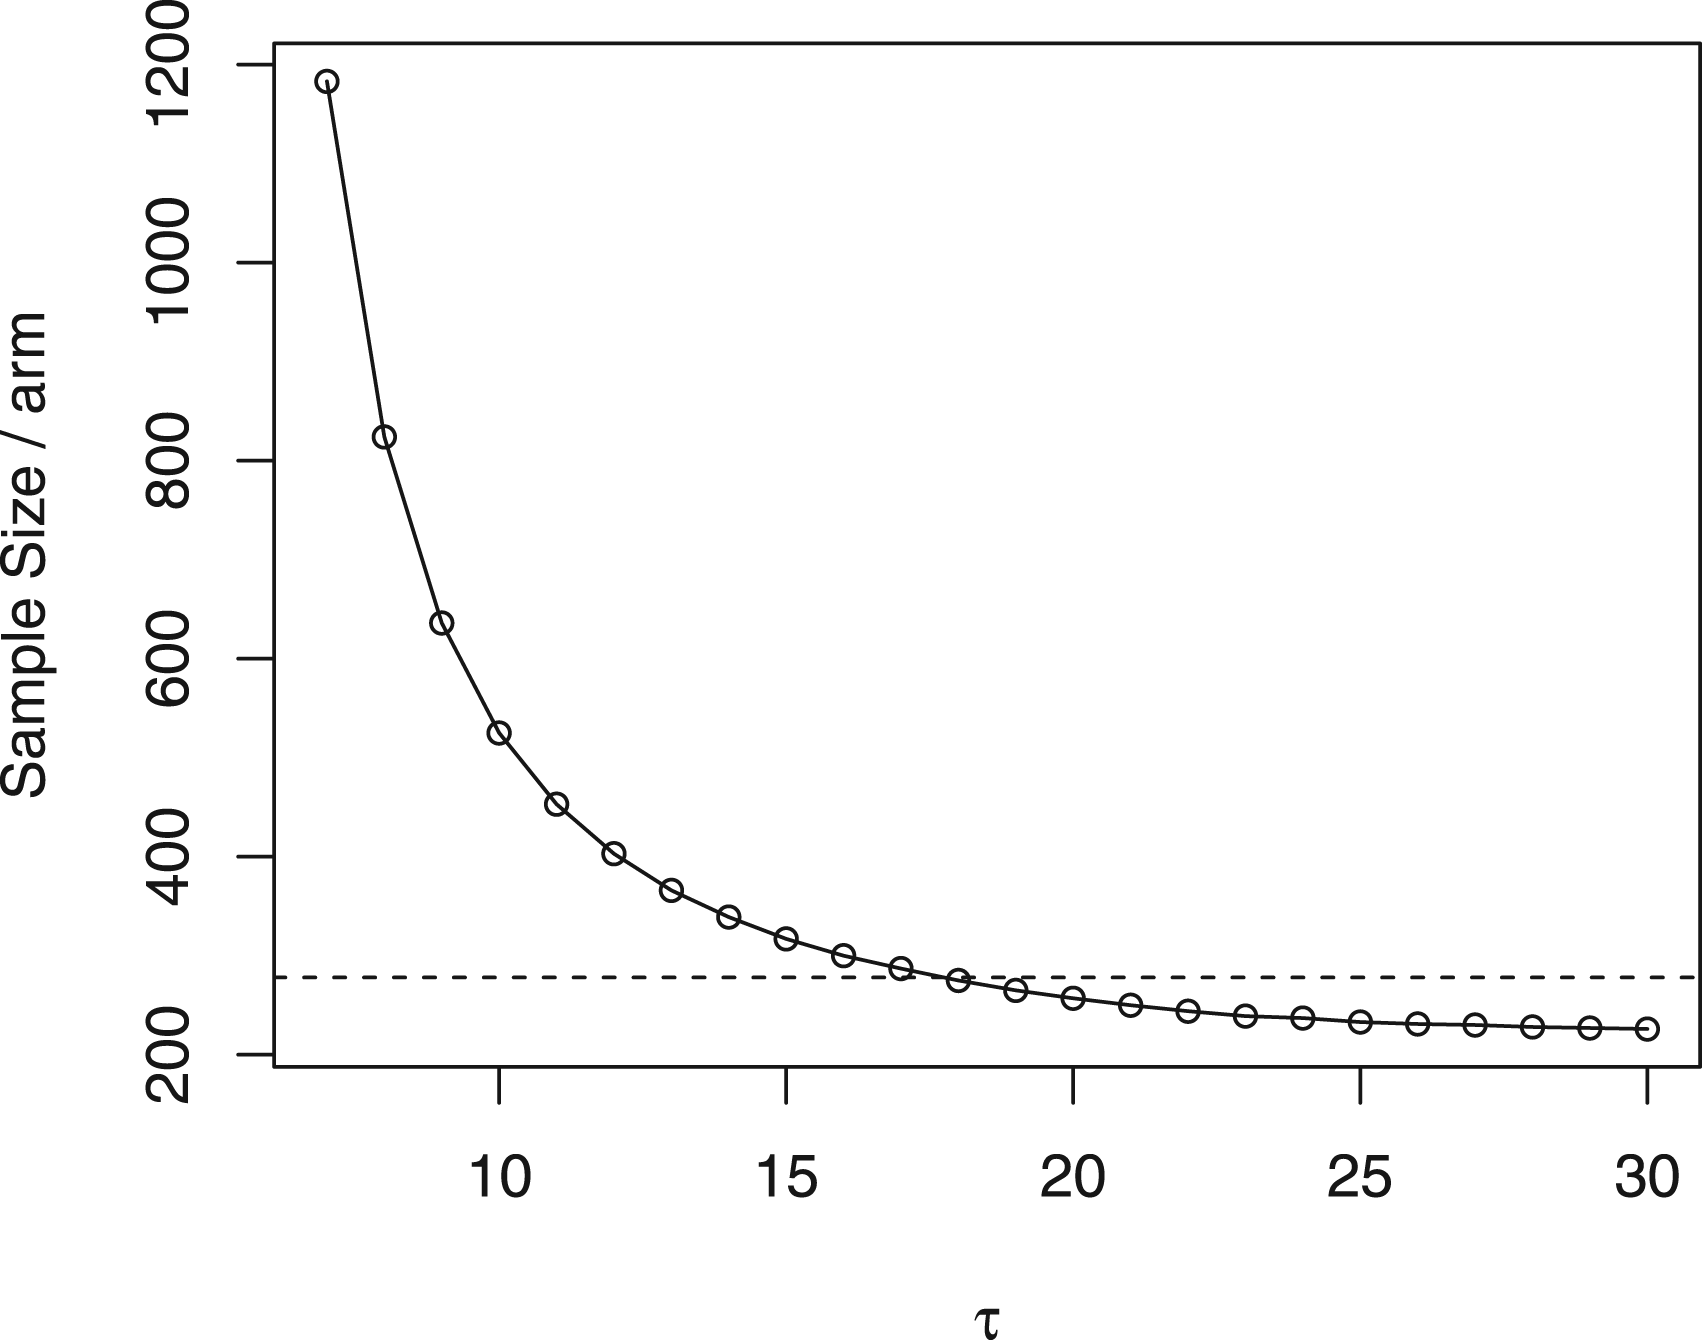
To determine the sample size, we used the same setup and assumed that the nivolumab group shares the same RMST variance with the combined therapy group. Instead of using HRs, we first transformed the assumed HRs into corresponding RMSTs. We then determined the restriction time using the “percent maturity” method proposed by Royston and Parmar,35 to select the minimum such that the percent maturity reaches 1. In this trial, we chose . We also calculated the sample size per arm with varying from 7 to 30 months in Figure 2. The figure illustrates that when the restriction time is >18 months, the required sample size can be smaller than that in the original trial design. This means that it may be possible to achieve the same statistical power with a smaller sample size, which can help to reduce the cost and time of the trial. However, it is important to note that extending the analysis time may also increase the risk of confounding factors and other biases, which should be carefully considered when making such decisions.
Sample size per arm under different in CheckMate 451 trial. Dashed line: in the original trial design.
Under these assumptions, our proposed global RMST test method predicts that a total sample size of 750 patients is sufficient to detect a clinically relevant difference vector in RMST of months, reducing the original sample size by 10%. Moreover, even though the treatment variances are not the same as assumed in the setup, the empirical power from 1000 simulations under of detecting a clinically relevant RMST at 21 months still reaches 91.1%. To validate the required sample size, we re-calculate the sample size using the same value, but with re-estimated design parameters based on their published results. These results correspond to the overall survival (OS) rates of 92%, 53%, 23%, and 15% at 3, 9, 18, and 26 weeks, respectively. Additionally, the HRs were found to be 0.92 and 0.84 for nivolumab versus placebo, and nivolumab plus ipilimumab versus placebo, respectively. The re-calculated sample size required was calculated to be 791, which does not deviate a lot from the sample size determined by the designed parameters.
It is important to note that the primary goal of the original trial is to detect the difference between the nivolumab plus ipilimumab arm and the control arm. Under the proposed sample size determination method, we found that with a size of 250 per arm, the empirical power of detecting the clinical RMST difference between the control and nivolumab plus ipilimumab arm in a pairwise manner at 21 months can also reach 93.2%. This justifies the validity of applying our proposed sample size method.
MCP-Mod with RMST in COPD example
In this example, we analyzed data from a COPD study to demonstrate the use of MCP-Mod for endpoint measured by RMST based on the time to the first COPD exacerbation. We adopted the same design as in Deng et al.,10 where four once-daily doses of the study medication were considered at 5, 25, 50, and 100 mg, along with a placebo, with an equal allocation of patients in each dose group. The desired type I error and targeted power were set to 0.05 and 85%, respectively. Since the median survival time in the placebo group was 0.5 year, we set the restriction time at .
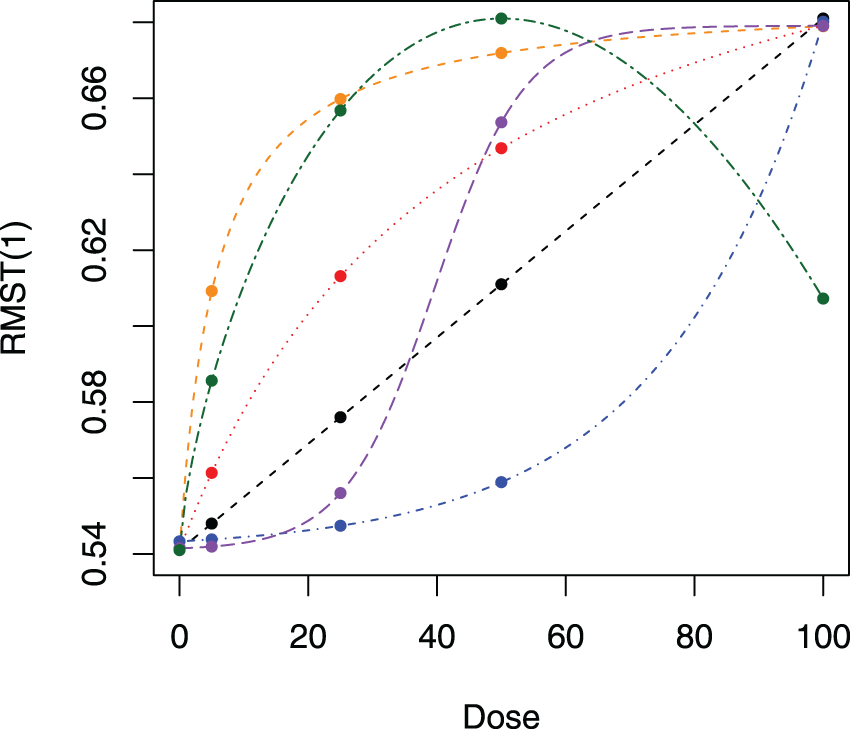
To reconstruct the same six candidate models shown in Figure 3 between dose and RMST, we back-transformed from hazard to RMST under exponential survival, instead of log hazard used in Deng et al.10 Using the proposed method, we found that a total of 405 patients were required with patients per arm to achieve 85% power at . This is slightly larger than the sample size of per arm used in Deng et al.10 However, this is a reasonable tradeoff as the proposed RMST-based design allows for more flexibility and robustness to distribution assumption than HR-based designs.
Candidate dose–response relationships for the chronic obstructive pulmonary disease (COPD) study: black line: linear model with ; red line: Emax model with ; orange line: Emax model with ; blue line: exponential model with ; purple line: logistic model with ; green line: beta model with .
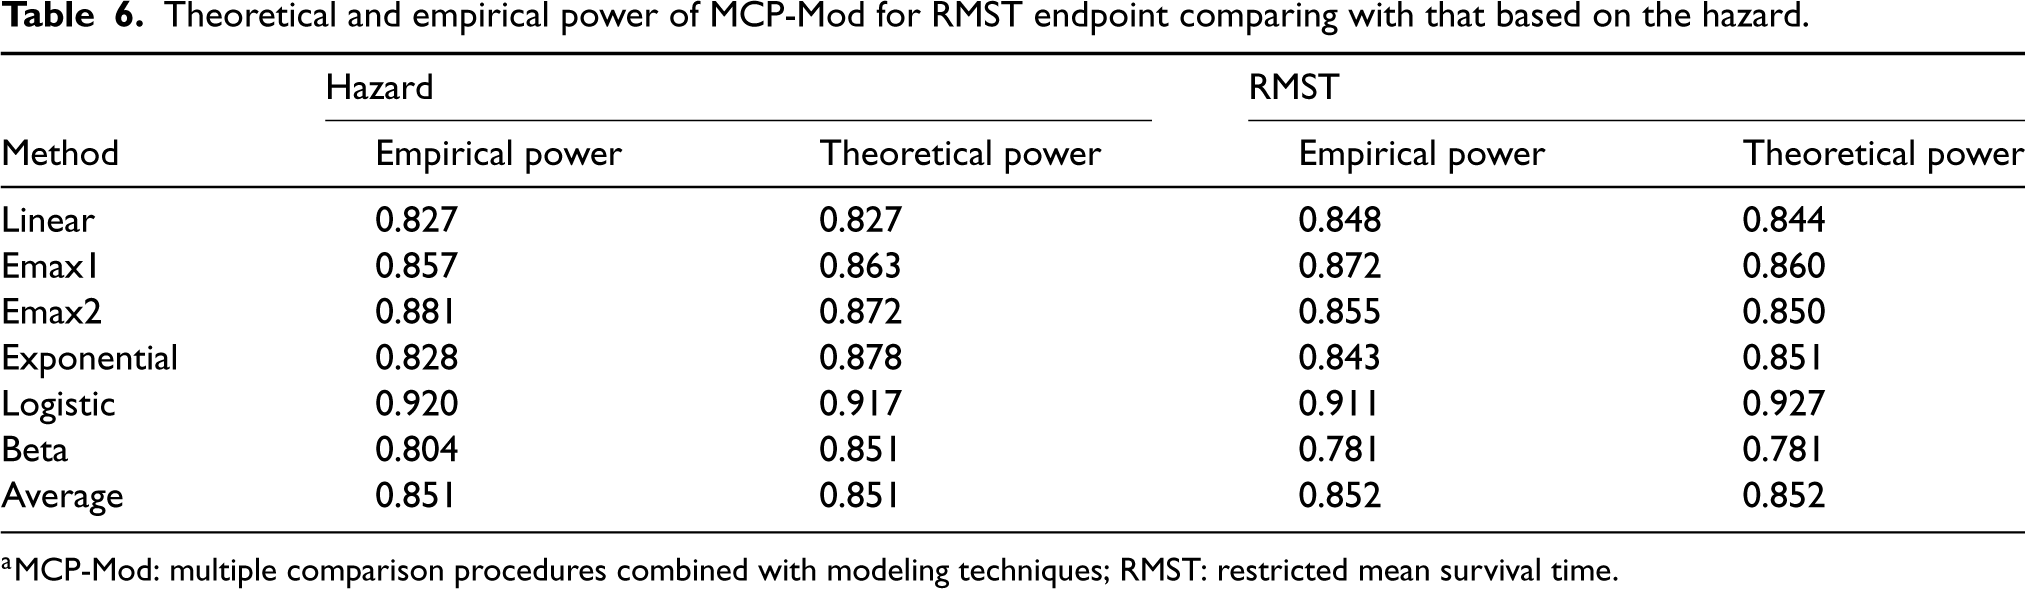
To assess the accuracy of our proposed sample size calculation procedure, we conducted 1000 simulations with 81 patients per arm and calculated the empirical and theoretical power for each candidate model, as well as the overall average power when . Table 6 displays all the results, comparing them to those from the MCP-Mod proposed by Deng et al.10
Theoretical and empirical power of MCP-Mod for RMST endpoint comparing with that based on the hazard.
Hazard
RMST
Method
Empirical power
Theoretical power
Empirical power
Theoretical power
Linear
0.827
0.827
0.848
0.844
Emax1
0.857
0.863
0.872
0.860
Emax2
0.881
0.872
0.855
0.850
Exponential
0.828
0.878
0.843
0.851
Logistic
0.920
0.917
0.911
0.927
Beta
0.804
0.851
0.781
0.781
Average
0.851
0.851
0.852
0.852
MCP-Mod: multiple comparison procedures combined with modeling techniques; RMST: restricted mean survival time.
The empirical power under all models, except for exponential and logistic, was higher than the theoretical power in the proposed MCP-Mod based on RMST, resulting in an overall empirical power of 88.7%. This indicates that our proposed method performs well in practice. The difference between theoretical power and empirical power is within 5%, which could be attributed to the instability of the RMST estimator and variance estimator.
We also computed the empirical type I error when the RMST was the same for all treatment groups as that in the placebo group. The resulting size was 0.048, which is the same as that reported by Deng et al.10 This example well illustrates the potential of using RMST instead of HR in a multi-arm dose-finding study design. With this approach, the designed sample size can still achieve the targeted power, while providing a more interpretable dose–response relationship.
Notice that one concern of using the RMST test in real-world examples is its long follow-up time. However, it is not specific to the RMST-based method but rather a characteristic of other dose-finding studies involving late-onset toxicities. To provide further empirical evidence and address the concern, we compared the proposed RMST-based method with the Cox model-based method.10 Based on the study design, the trial would have been terminated at the restriction time of 1 year using the proposed method. While in Deng et al.,10 the trial was terminated when a total of 242 events were observed (Type II censoring design). To unify the termination time, we simulated the data 1000 times and observed that the average termination time using the method from Deng et al.10 with 242 observed events was close to 0.97 year, which is in proximity to the restriction time of 1 year used in our proposed method. This finding highlights the similarity in the follow-up times required by different methodologies when dealing with right-censored survival data.
Discussion
In this article, we present the multi-arm design and sample size calculation for survival data with endpoint measured by RMST with the aims of detecting global effect and modeling dose–response relationship, respectively. The main contribution lies in its first attempt to apply RMST in multi-arm design for survival data. By utilizing RMST, the resulting sample size can achieve a more accurate power target. This is due to the stability of the RMST ratio variance, which outperforms the conventional HR approach. We propose a closed form and a simulation-based sample size calculation procedure in realistic settings, which is quite flexible allowing staggered patient entry as well as NPHs that commonly occur in modern drug development. The proposed method requires fewer a priori assumptions, as it only necessitates the survival curves of the control and representative treatment group, rather than assuming the distributions of all treatments. Complex trial settings in survival data have a combined effect on sample size, including the magnitude of the targeted RMST difference to be detected, the accrual distribution, the control group survival distribution, a representative treatment group distribution, loss to follow-up, length of the study and follow-up duration, restriction time, the allocation ratio between control and treatment, and Type I and Type II errors. A related problem is how we plan a trial with an appropriate restriction time in the study protocol. Despite the clinical and scientific perspective, several data-dependent methods can be directly applied in multi-arm design, such as the method developed in Eaton et al.14 based on the probability of RMST to be estimable, or the probability that data is mature enough for final analysis proposed by Royston and Parmar.35 The selection of restriction time indeed affects the sample size as well as the performance of the RMST test a lot. In this paper, due to the complexity of multi-arm trial design, we propose to set a priori specification of in the trial protocol for the primary analysis, guided by clinical considerations. This is in line with the recommendations by Royston and Parmar.35 In practice, many issues need to be considered to select an appropriate . First, there is a tradeoff between the choice of and the sample size. When patient enrollment is easily achievable, a smaller can be selected; otherwise, the sample size may be small, and a relatively longer should be adopted. Secondly, the nature of the disease also influences the appropriate follow-up periods as a certain cancer may require a longer follow-up period. In addition, practical constraints, such as financial resources, must also be taken into account, meaning that cannot be excessively long with a limited budget. Of course, there are other data-driven approaches to select in the absence of this clinically relevant choice as well. For example, Royston and Parmar35 also suggested selecting a value of slightly lower than the maximum expected follow-up time.
Simulation results of various situations show that the proposed sample size determination method performs well in acquiring the targeted power and outperforms the conservative HR-based sample size formula. It also validates the emphasis on taking particular care of the parameter settings in the study design stage, otherwise, large bias and power loss may occur. Trial examples we performed show that the proposed RMST-based method with an appropriate choice of the restriction time requires a similar sample size as that in the HR-based method, but can accommodate much more complicated survival curves and better maintains the power level required than the HR-based method.
We have focused on the multi-arm design analyzed at a pre-specified restriction time or at the end of the trial. In practice, for the purpose of modifying the trial design and re-estimating the sample size, an interim analysis is often conducted in the ongoing trial. Specifically, the group sequential method in randomized clinical trials based on the difference in RMST was studied theoretically by Lu and Tian,16 where the test statistic for two-arm comparison has an independent increments covariance structure. In the context of multi-arm global design, to develop sequential analysis at interim times and , the joint distribution is no longer a multivariate normal but a multivariate chi-square, and the theorem will not be directly applicable, which requires further exploration. In addition, other multi-arm designs, such as factorial design, multi-arm multi-stage design, or adaptive design have not been considered yet and our work opens opportunities for future development of these novel designs.
Supplemental Material
sj-pdf-1-smm-10.1177_09622802231219852 - Supplemental material for Sample size calculation for multi-arm parallel design with restricted mean survival time
Supplemental material, sj-pdf-1-smm-10.1177_09622802231219852 for Sample size calculation for multi-arm parallel design with restricted mean survival time by Yaxian Chen, Kwok Fai Lam and Jiajun Xu in Statistical Methods in Medical Research
Footnotes
Declaration of conflicting interests
The authors declared no potential conflicts of interest with respect to the research, authorship, and/or publication of this article.
Funding
The authors received no financial support for the research, authorship, and/or publication of this article.
ORCID iD
Kwok Fai Lam
Supplemental material
Supplemental material for this article is available online.
References
1.
OdutayoAet al. Association between trial registration and positive study findings: Cross sectional study (epidemiological study of randomized trials—ESORT). BMJ2017; 356: j917.
2.
MakuchRWSimonRM. Sample size requirements for comparing time-to-failure among k treatment groups. J Chron Dis1982; 35: 861–867.
3.
LiuPYDahlbergS. Design and analysis of multiarm clinical trials with survival endpoints. Control Clin Trials1995; 16: 119–130.
4.
AhnnSAndersonSJ. Sample size determination for comparing more than two survival distributions. Stat Med1995; 14: 2273–2282.
5.
AhnnSAndersonSJ. Sample size determination in complex clinical trials comparing more than two groups for survival endpoints. Stat Med1998; 17: 2525–2534.
6.
HalabiSSinghB. Sample size determination for comparing several survival curves with unequal allocations. Stat Med2004; 23: 1793–1815.
7.
BarthelFSBabikerARoystonP, et al. Evaluation of sample size and power for multi-arm survival trials allowing for non-uniform accrual, non-proportional hazards, loss to follow-up and cross-over. Stat Med2006; 25: 2521–2542.
8.
AndrillonAChevretSLeeSM, et al. Dose-finding design and benchmark for a right censored endpoint. J Biopharm Stat2020; 30: 948–963.
9.
BornkampBPinheiroJBretzF. MCPMod: An R package for the design and analysis of dose-finding studies. J Stat Softw2009; 29: 1–23.
10.
DengQet al. Power and sample size for dose-finding studies with survival endpoints under model uncertainty. Biometrics2019; 75: 308–314.
11.
AlexanderBMSchoenfeldJDTrippaL. Hazards of hazard ratios-deviations from model assumptions in immunotherapy. New Engl J Med2018; 378: 1158–1159.
12.
PakKet al. Interpretability of cancer clinical trial results using restricted mean survival time as an alternative to the hazard ratio. JAMA Oncol2017; 3: 1692–1696.
13.
HajimeUet al. Moving beyond the hazard ratio in quantifying the between-group difference in survival analysis. J Clin Oncol2014; 32: 2380.
14.
EatonATerryTJenniferL. Designing clinical trials with (restricted) mean survival time endpoint: practical considerations. Clin Trials2020; 17: 285–294.
15.
WeirIRTrinquartL. Design of non-inferiority randomized trials using the difference in restricted mean survival times. Clin Trials2018; 15: 499–508.
16.
LuYTianL. Statistical considerations for sequential analysis of the restricted mean survival time for randomized clinical trials. Stat Biopharm Res2021; 13: 210–218.
17.
MurraySTsiatisAA. Sequential methods for comparing years of life saved in the two sample censored data problem. Biometrics1999; 55: 1085–1092.
18.
JuszczakEAltmanDGHopewellS, et al. Reporting of multi-arm parallel-group randomized trials: extension of the CONSORT 2010 statement. JAMA2019; 321: 1610–1620.
19.
BretzFPinheiroJCBransonM. Combining multiple comparisons and modeling techniques in dose-response studies. Biometrics2005; 1: 738–748.
20.
TrinquartLJacotJConnerSCet al. Comparison of treatment effects measured by the hazard ratio and by the ratio of restricted mean survival times in oncology randomized controlled trials. J Clin Oncol2016; 34: 1813–1819.
21.
CoxDR. Regression models and life tables (with discussion). J R Stat Soc Series B Stat Methodol1972; 34: 187–200.
22.
MeierP. Estimation of a distribution function from incomplete observations. J Appl Probab1975; 12: 67–87.
23.
KleinJPMoeschbergerML. Survival analysis: techniques for censored and truncated data. Berlin: Springer Science Business Media, 2006.
24.
TianLJinHUnoH, et al. On the empirical choice of the time window for restricted mean survival time. Biometrics2020; 76: 1157–1166.
25.
PepeMSFlemingTR. Weighted Kaplan Meier statistics: A class of distance tests for censored survival data. Biometrics1989; 45: 497–507.
26.
TianLZhaoLWeiLJ. Predicting the restricted mean event time with the subject’s baseline covariates in survival analysis. Biostat2014; 15: 222–233.
27.
BatesDWattsD. Nonlinear regression analysis and its applications. New York: Wiley, 1988.
28.
RubergSJ. Dose response studies. I. Some design considerations. J Biopharm Stat1995; 5: 1–14.
29.
PinheiroJBatesD. Unconstrained parameterizations for variance-covariance matrices. Stat Comput1996; 6: 289–296.
30.
TianLFuHRubergSJet al. Efficiency of two sample tests via the restricted mean survival time for analyzing event time observations. Biometrics2018; 74: 694–702.
31.
LachinJMFoulkesMA. Evaluation of sample size and power for analyses of survival with allowance for nonuniform patient entry, losses to follow-up, noncompliance, and stratification. Biometrics1986; 42: 507–519.
32.
FreedmanLS. Tables of the number of patients required in clinical trials using the logrank test. Stat Med1982; 1: 121–129.
33.
LachinJM. Introduction to sample size determination and power analysis for clinical trials. Control Clin Trials1982; 2: 93–113.
34.
OwonikokoTKParkKGovindanRet al. Nivolumab and ipilimumab as maintenance therapy in extensive-disease small-cell lung cancer: CheckMate 451. J Clin Oncol2021; 39: 1349.
35.
RoystonPParmarMK. Restricted mean survival time: an alternative to the hazard ratio for the design and analysis of randomized trials with a time-to-event outcome. BMC Med Res Methodol2013; 13: 1–15.
Supplementary Material
Please find the following supplemental material available below.
For Open Access articles published under a Creative Commons License, all supplemental material carries the same license as the article it is associated with.
For non-Open Access articles published, all supplemental material carries a non-exclusive license, and permission requests for re-use of supplemental material or any part of supplemental material shall be sent directly to the copyright owner as specified in the copyright notice associated with the article.