
Abstract
The mixture cure rate model is the most commonly used cure rate model in the literature. In the context of mixture cure rate model, the standard approach to model the effect of covariates on the cured or uncured probability is to use a logistic function. This readily implies that the boundary classifying the cured and uncured subjects is linear. In this article, we propose a new mixture cure rate model based on interval censored data that uses the support vector machine to model the effect of covariates on the uncured or the cured probability (i.e. on the incidence part of the model). Our proposed model inherits the features of the support vector machine and provides flexibility to capture classification boundaries that are nonlinear and more complex. The latency part is modeled by a proportional hazards structure with an unspecified baseline hazard function. We develop an estimation procedure based on the expectation maximization algorithm to estimate the cured/uncured probability and the latency model parameters. Our simulation study results show that the proposed model performs better in capturing complex classification boundaries when compared to both logistic regression-based and spline regression-based mixture cure rate models. We also show that our model’s ability to capture complex classification boundaries improve the estimation results corresponding to the latency part of the model. For illustrative purpose, we present our analysis by applying the proposed methodology to the NASA’s Hypobaric Decompression Sickness Database.
Keywords
Introduction
Ordinary survival analysis techniques such as the proportional hazards (PH) model, the proportional odds (PO) model or the accelerated failure time (AFT) model are concerned with modeling censored time-to-event data by assuming that every subject in the study will encounter the primary event of interest (death, relapse, or recurrence of a disease, etc.). However, it is not appropriate to apply these techniques to situations where a portion of the study cohort does not experience the event, for example, clinical studies involving low fatality rate with death as the event. It can be argued that if these subjects are followed up sufficiently beyond the study period, they may face the event due to some other risk factors. Therefore, these subjects can be considered as cured with respect to the event of interest. The survival model that incorporates the effects of such cured subjects is called the cure rate model. Remarkable progress in medical sciences also necessitate further exploration in the cure rate model where estimating the cure fraction precisely can be of great importance.
Introduced by Boag
1
and exclusively studied by Berkson and Gage,
2
the mixture cure rate model is perhaps the most popular cure rate model.
3
If


The properties of the mixture cure rate model with various assumptions and extensions are explored in details by several authors. Modeling lifetime of the susceptible individuals have been studied extensively. For example, a complete parametric mixture cure rate model is studied by assuming homogeneous Weibull lifetimes and logit-link to the cure rate.4,5 Semiparametric cure models with PH structure of the latency has also been studied extensively.6–8 Generalizations to semiparametric PO,9,10 AFT,11–13 transformation class, 14 and additive hazards 15 under mixture cure rate model were also investigated with various estimation techniques and model considerations.
On the other hand, the incidence part

To this end, the support vector machine (SVM) could be a reasonable choice.
28
Introduced by Cortes and Vapnik,
29
the SVM is a machine learning algorithm that finds a hyperplane in multidimensional feature space that maximizes the separating space (margin) between two classes. The main advantage of the SVM is that it can separate nonlinear inseparable data by transforming it to a higher dimensional space using kernel trick. Consequently, this classifier is more robust and flexible than logit or probit link functions. Given the availability of different machine learning algorithms,
30
we propose to use SVM-based techniques in this article mainly because SVM is based on the kernel trick and hence it is possible to design or fuse kernels to improve performance. Furthermore, SVM uses a subset of training points in the decision function, which makes it memory efficient. Additionally, the execution time for SVM is expected to be less when compared to other classifiers such as artificial neural networks (NNs). Recently, Li et al.
31
studied the effect of the covariates on the incidence
Unlike right-censored data,32,33 interval-censored data occur for a study where subjects are inspected at regular intervals, and not continuously.34–36 If a subject experiences the event of interest, the exact survival time is not observed and is only known that the event has occurred between two consecutive inspections. Interval-censored data marked by cure prospect are often observed in follow-up clinical studies (cancer biochemical recurrence or AIDS drug resistance) dealing with events having low fatality and patients monitored at regular intervals.37,38 As in the case of right-censored data, some subjects may never encounter the event of interest, and are considered as cured. Mixture cure models for interval censored data have been studied and several estimation methods were proposed for both semiparametric and non-parametric set-ups.39–43 Motivated by the work of Li et al.,
31
we propose to employ the SVM-based modeling to study the effects of covariates on the incidence part of the mixture cure rate model for survival data subject to interval-censoring. In addition, we compare our model not only with the logistic regression-based mixture cure model but also with the spline regression-based mixture cure model, which is also capable of capturing complex effects of


The rest of the article is organized as follows. In Section 2, we discuss about the mixture cure rate model framework for interval-censored data and develop an estimation procedure based on the expectation–maximization (EM) algorithm that employs the SVM to model the incidence part. In Section 3, a detailed simulation study is carried out to demonstrate the performance of our proposed model in terms of flexibility, accuracy, and robustness. Comparison of our model with the logistic regression-based and spline regression-based mixture cure rate models in the presence of interval censored data is made in this section. The model performance is further examined and illustrated in Section 4 through the NASA’s Hypobaric Decompression Sickness Database (HDSD). Finally, we end our discussion by some concluding remarks and possible future research directions in Section 5.
Censoring scheme and modeling lifetimes
The data we observe in situations with interval censoring are of the form Using all the For each Make an initial guess of the survival probability at Calculate Estimate the number of events that occurred at time Calculate the estimated number of subjects at risk at time Calculate the updated product-limit estimator of survival function at If


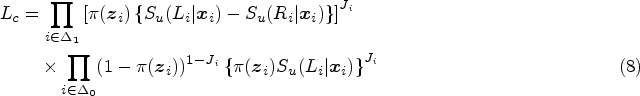
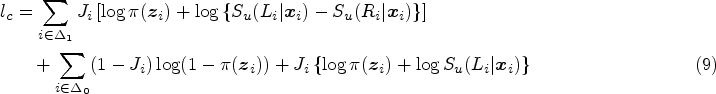
As missing observations are inherent to the problem set-up and model framework, we propose to employ the EM algorithm to estimate the unknown parameters.7,8,48,49 For implementing the EM algorithm, we need the form of the complete data likelihood function. Let us define


Let us assume that

The mapping

In the given context, note that it is not enough to just classify subjects as being cured or susceptible. It is also of our interest to obtain the estimates of uncured probabilities


We started our discussion on the SVM-based modeling of the incidence part above with the assumption that For a pre-defined integer For the imputed data Calculate
To address the issue with over/under fitting, we split the data into two sets, namely, the training set and the testing set. The training set is used to obtain the optimal hyper-parameters of the SVM model and then those optimal hyper-parameters are used to train the optimal SVM model. On the other hand, the testing set is used to test or validate the final SVM model. We examine two most critical hyper-parameters of the SVM, namely,
Development of the EM algorithm
The E-step in the EM algorithm involves finding the conditional expectation of the complete data log-likelihood function in (9) given the current estimates (say, at the


Carry out the multiple imputation technique, as described in Section 2.3, by considering Obtain Check for the convergence as follows:
Update Repeat steps 1 to 4 until convergence is achieved.
Note that maximization of


The standard errors are estimated by non-parametric bootstrapping. For
Initial values of model parameters
To start the iterative EM algorithm, we need to come up with initial values of
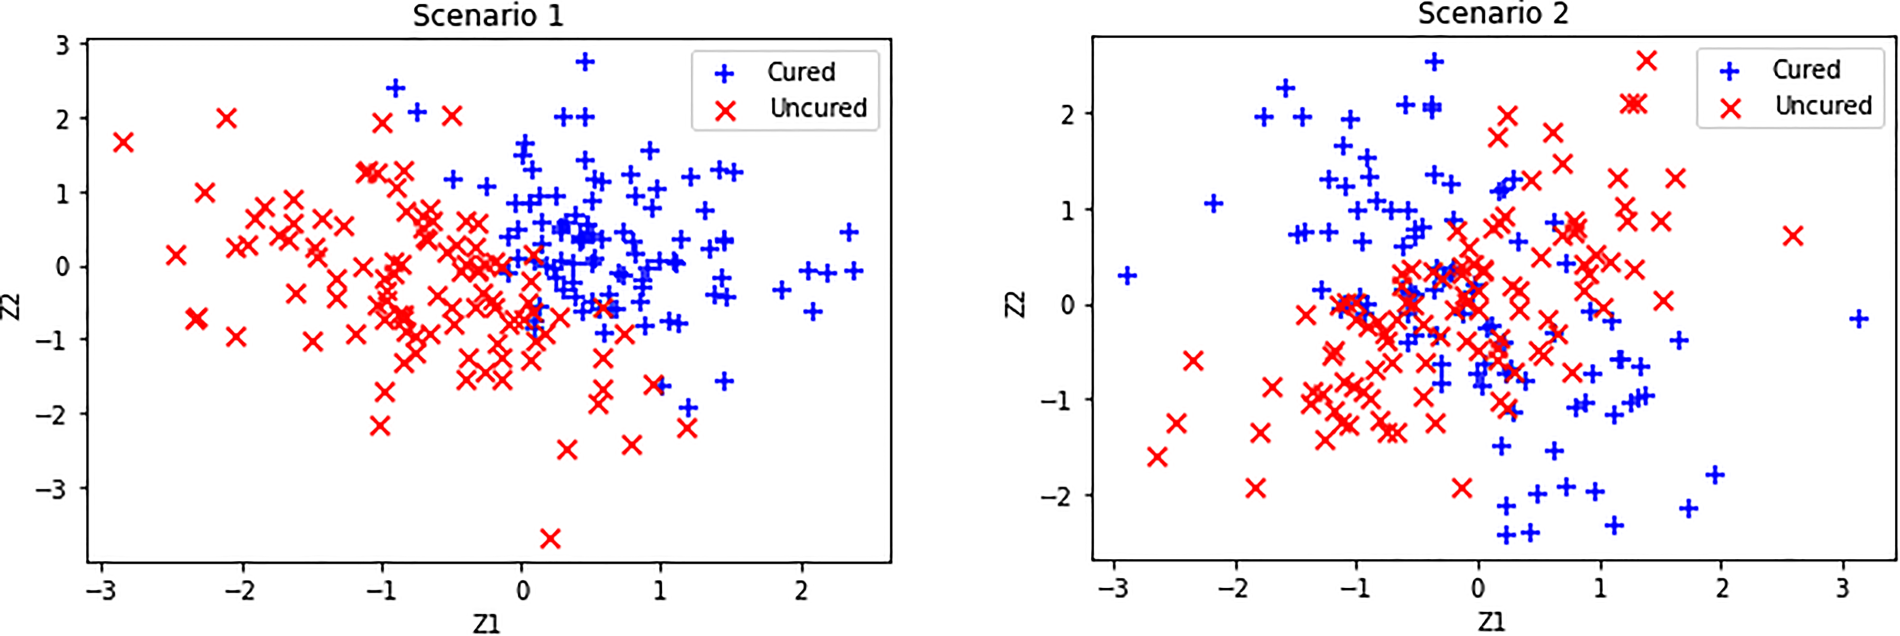
Simulated cured and uncured observations for Scenarios 1 and 2 considered.
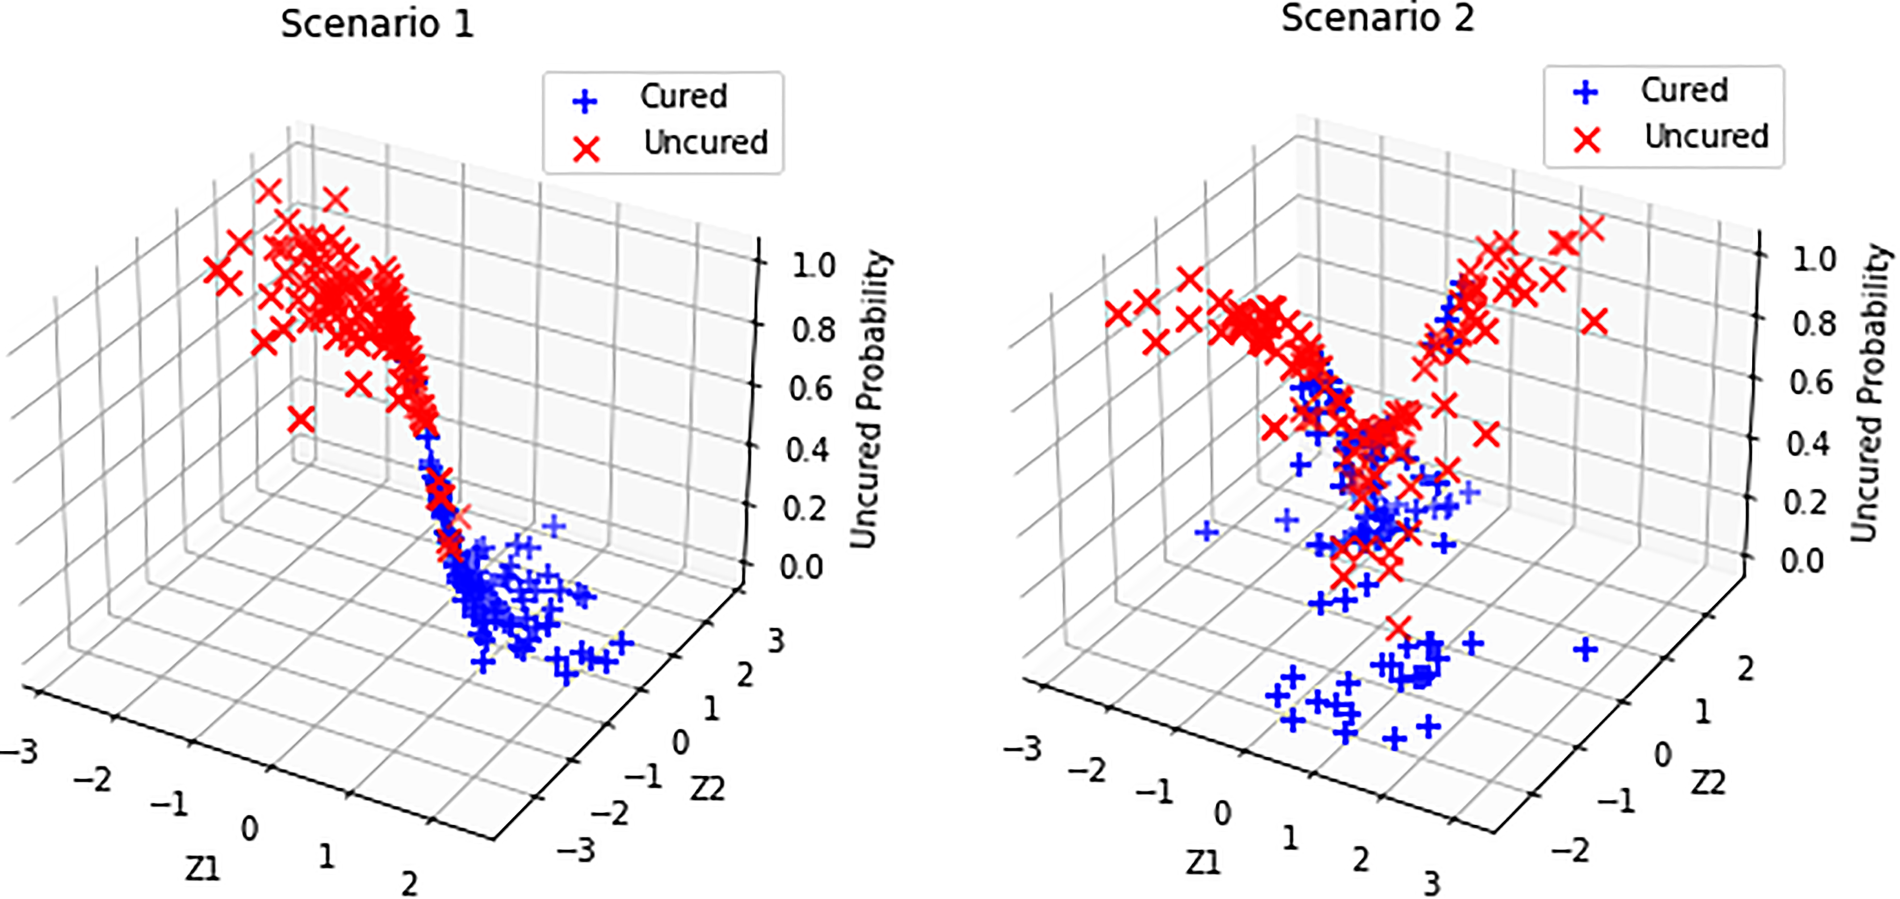
Simulated uncured probabilities and their behavior with respect to the covariates for Scenarios 1 and 2.
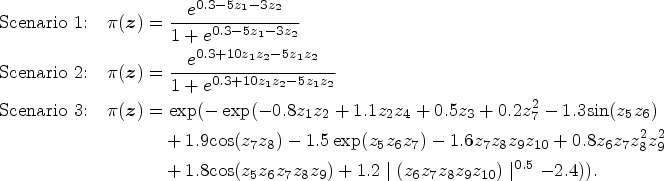
In this section, we assess the performance of the proposed SVM-based EM algorithm to estimate the model parameters of the mixture cure rate model for interval censored data. We also compare the performance of the SVM-based EM algorithm with the logistic regression-based and spline regression-based EM algorithms. To fit the thin plate spline for the incidence part, we use the “gam” function in the package “mgcv.” We consider the following scenarios using which we generate the true uncured probabilities Generate a Uniform (0,1) random variable If If
If If
Comparison of bias of the uncured probability and susceptible survival probability for different models.
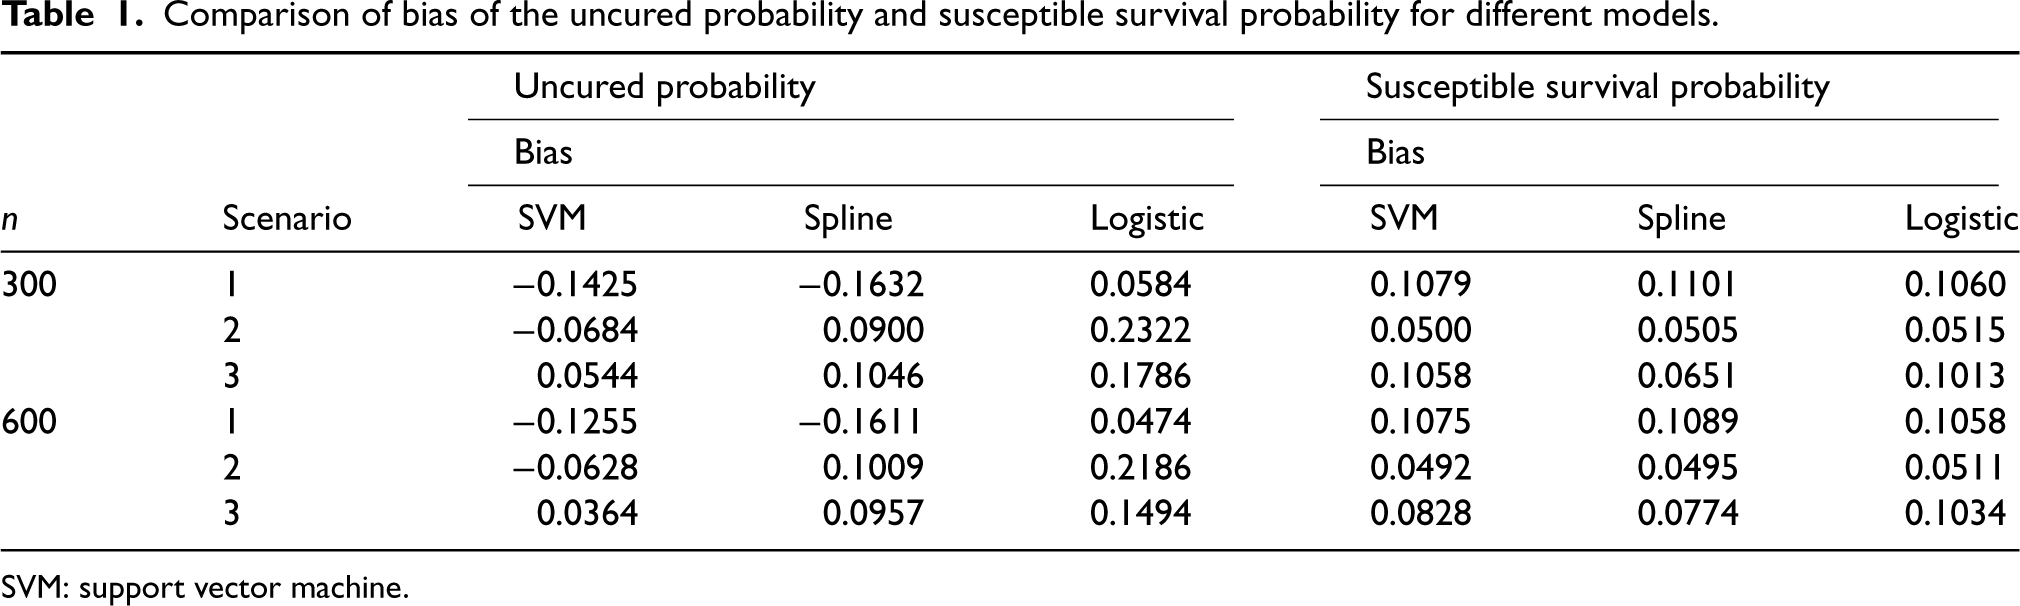
SVM: support vector machine.
All simulations are done using the R statistical software (Version 4.0.4) and results are based on 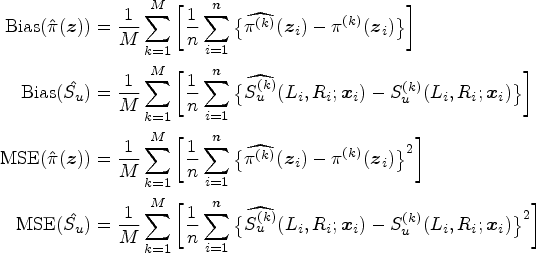
Comparison of MSE of the uncured probability and susceptible survival probability for different models.
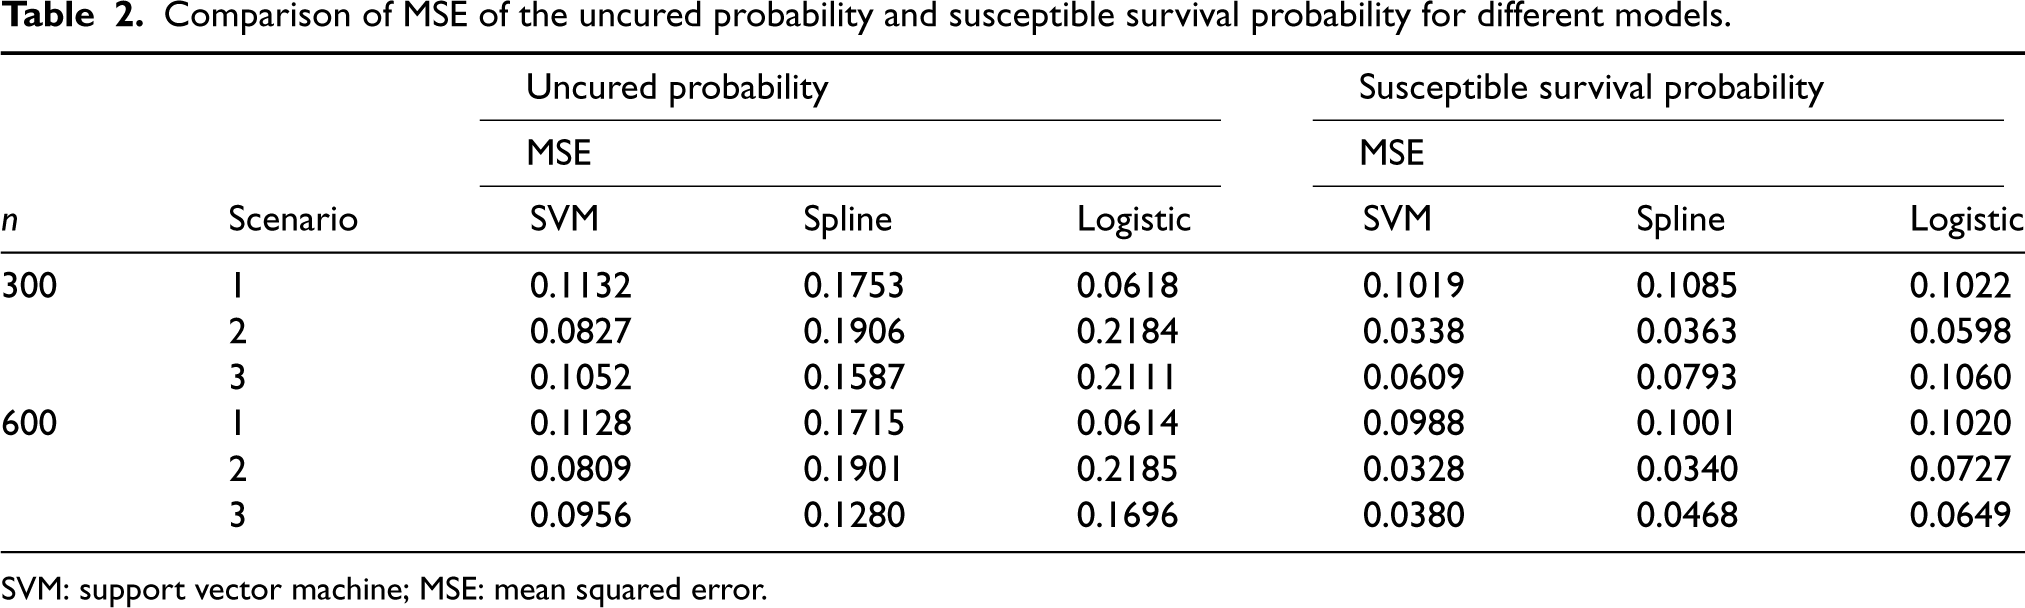
SVM: support vector machine; MSE: mean squared error.
From Table 1, it is clear that the biases of the estimated uncured probability and the susceptible survival probability obtained from the logistic regression-based EM algorithm is smaller than those obtained from the proposed SVM-based EM algorithm as well as the spline-based EM algorithm when logistic regression is the correct model (Scenario 1). However, when the true model for the uncured probability is not the logistic regression in Scenarios 2 and 3, the proposed SVM-based EM algorithm produces smaller bias in the estimated uncured probability when compared to both logistic regression-based and spline-based EM algorithms. In this case, as far as the estimated susceptible survival probabilities are concerned, the SVM-based EM algorithm produces smaller bias only under Scenario 2. From Table 2, we note that when the logistic regression is the true model for the uncured probability (i.e. under Scenario 1), the MSE of the estimated uncured probability obtained from the logistic regression-based EM algorithm is smaller than those obtained from the SVM-based and spline-based EM algorithms. However, under Scenarios 2 and 3, that is, under non-logistic true models for the uncured probability, the proposed SVM-based EM algorithm produces smaller MSE of the estimated uncured probability when compared to both logistic regression-based and spline-based EM algorithms. When it comes to the estimation of the susceptible survival probability, our proposed SVM-based EM algorithm produces smaller MSEs in all considered scenarios. Overall, we can conclude that the proposed SVM-based EM algorithm performs better than the standard logistic regression-based and spline-based EM algorithms when the true classification boundary is nonlinear and complex. This clearly demonstrates the ability of the proposed SVM-based mixture cure model to handle complex nonlinear classification boundaries.
Although, in practice, the cured status is unobserved for a real data, we do know which observations can be considered as cured when we simulate data. Using such information on the cured status for simulated data, we can easily compare the proposed SVM-based mixture cure model with the logistic regression-based and spline regression-based mixture cure models using the ROC curves and the AUC values for different scenarios we have considered. Note that the true label for calculating the AUC is the true cure index for each subject when the data is generated. Figure 3 presents the ROC curves under different scenarios. The corresponding AUC values are presented in Table 3. These results are based on 500 Monte Carlo runs. It is once again clear that under Scenarios 2 and 3 (i.e. when the true classification boundaries are nonlinear), the performance (or the accuracy) of the SVM-based mixture cure model is much better than the logistic regression-based and the spline-based mixture cure models. However, under Scenario 1 (i.e. when the true classification boundary is linear), the logistic regression-based model performs slightly better than the SVM-based model. The similarity in the AUC values obtained from the training data and testing data implies that there is no issue with over/under fitting.
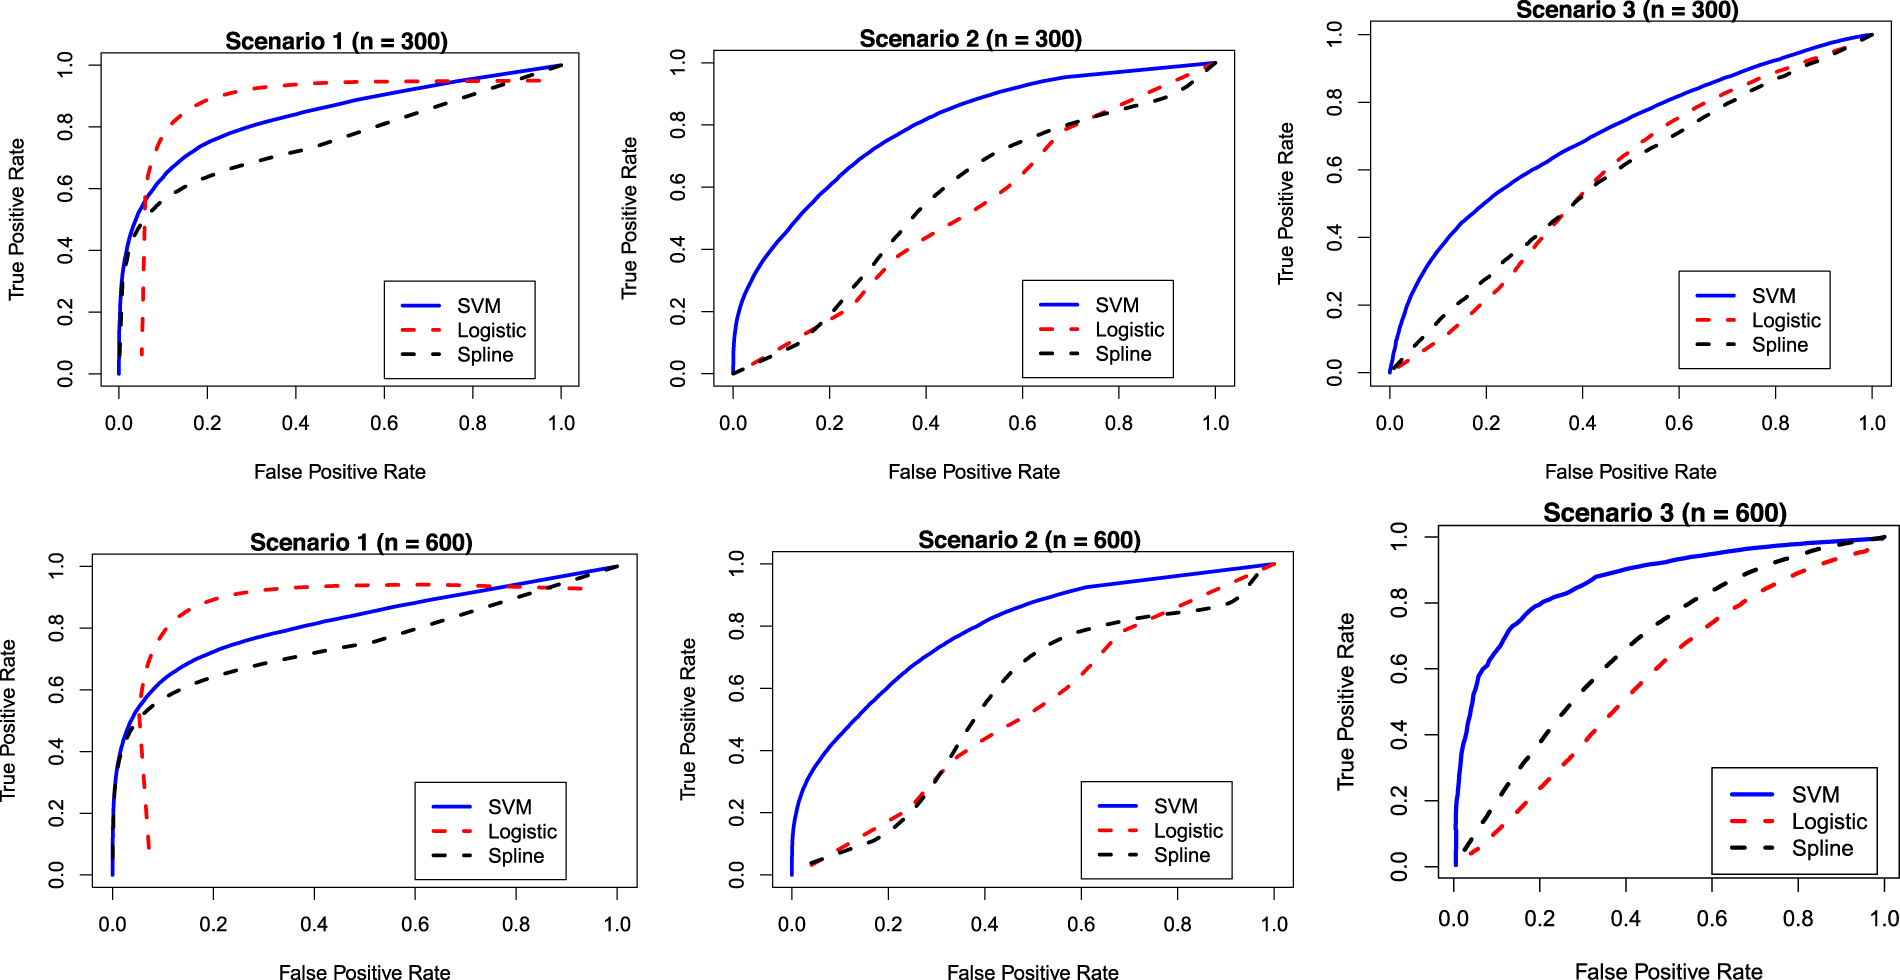
Receiver operating characteristic (ROC) curves for different models and under different scenarios.
Comparison of AUC values for different models and scenarios.
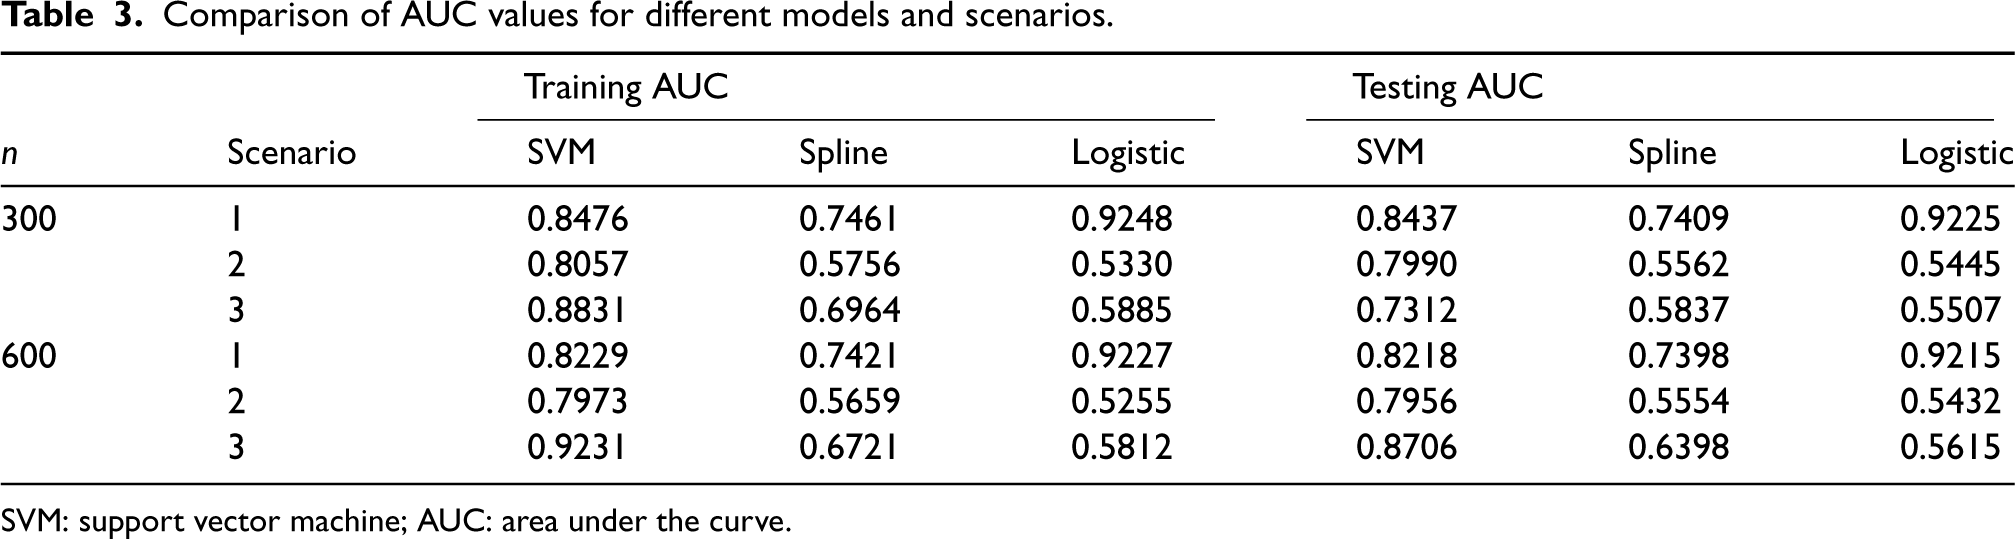
SVM: support vector machine; AUC: area under the curve.
To further assess the robustness and generalizability of the proposed SVM model across different data settings, we study a scenario where we generate 10 correlated covariates from a multivariate normal distribution,
Comparison of different models through the biases and MSEs of different quantities of interest for
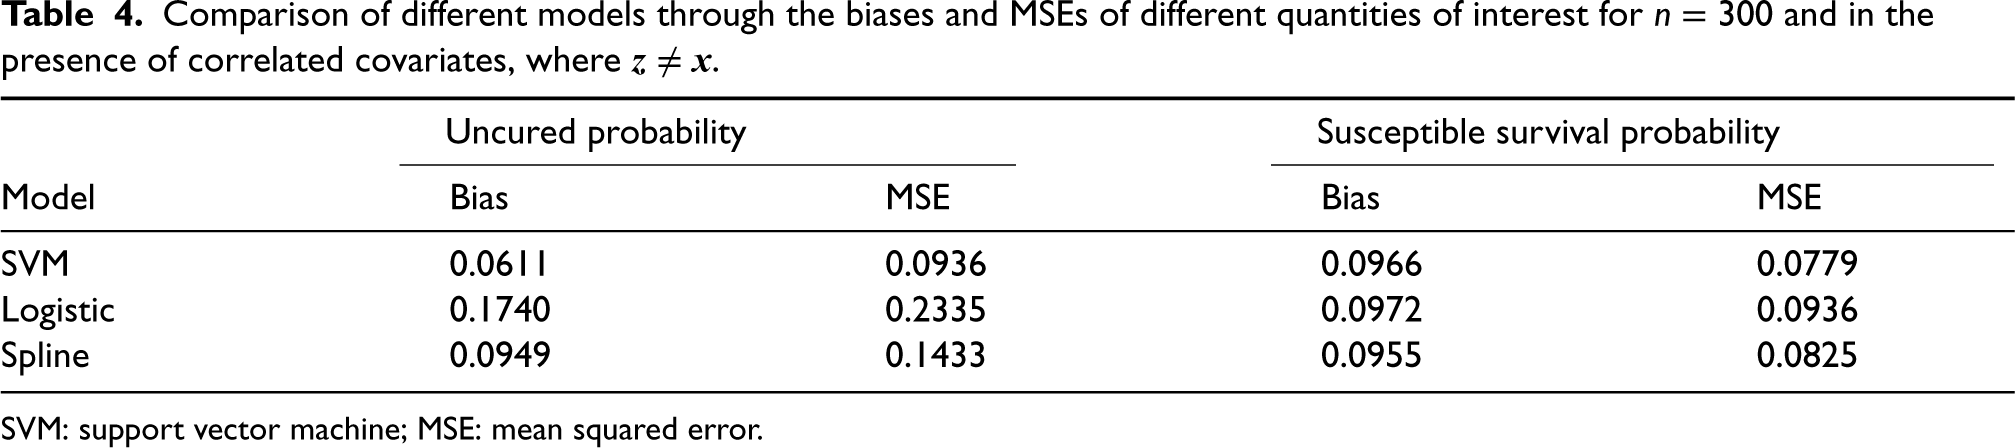
SVM: support vector machine; MSE: mean squared error.
Comparison of different models through the AUC values for
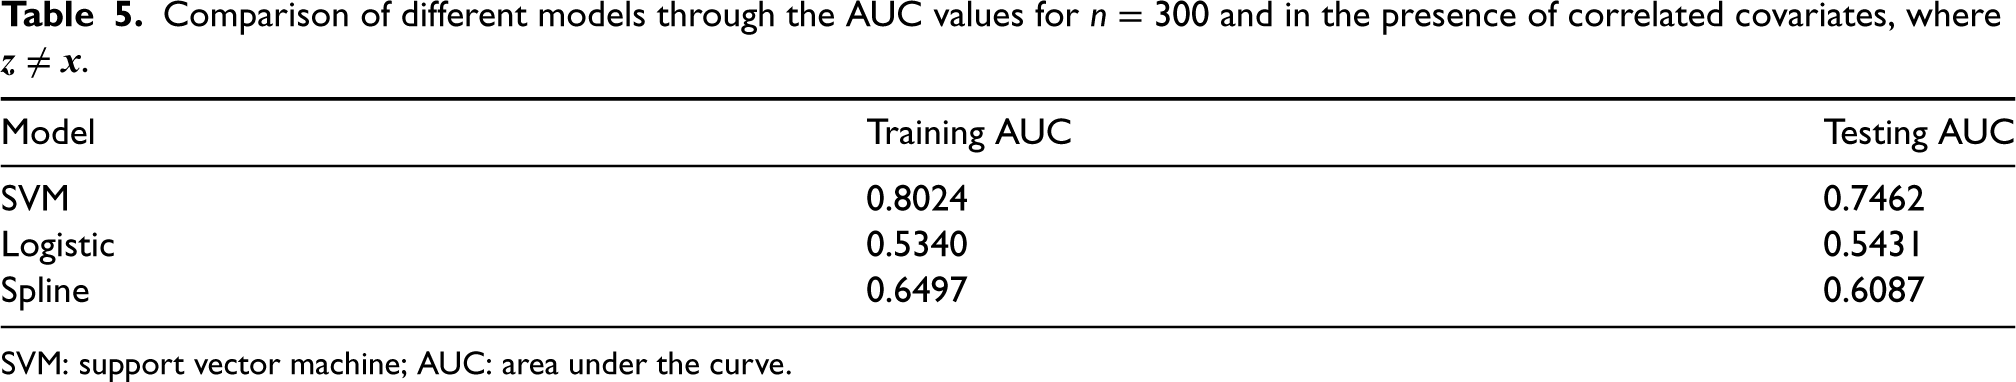
SVM: support vector machine; AUC: area under the curve.
Comparison of SVM and NN models through the biases and MSEs of different quantities of interest for
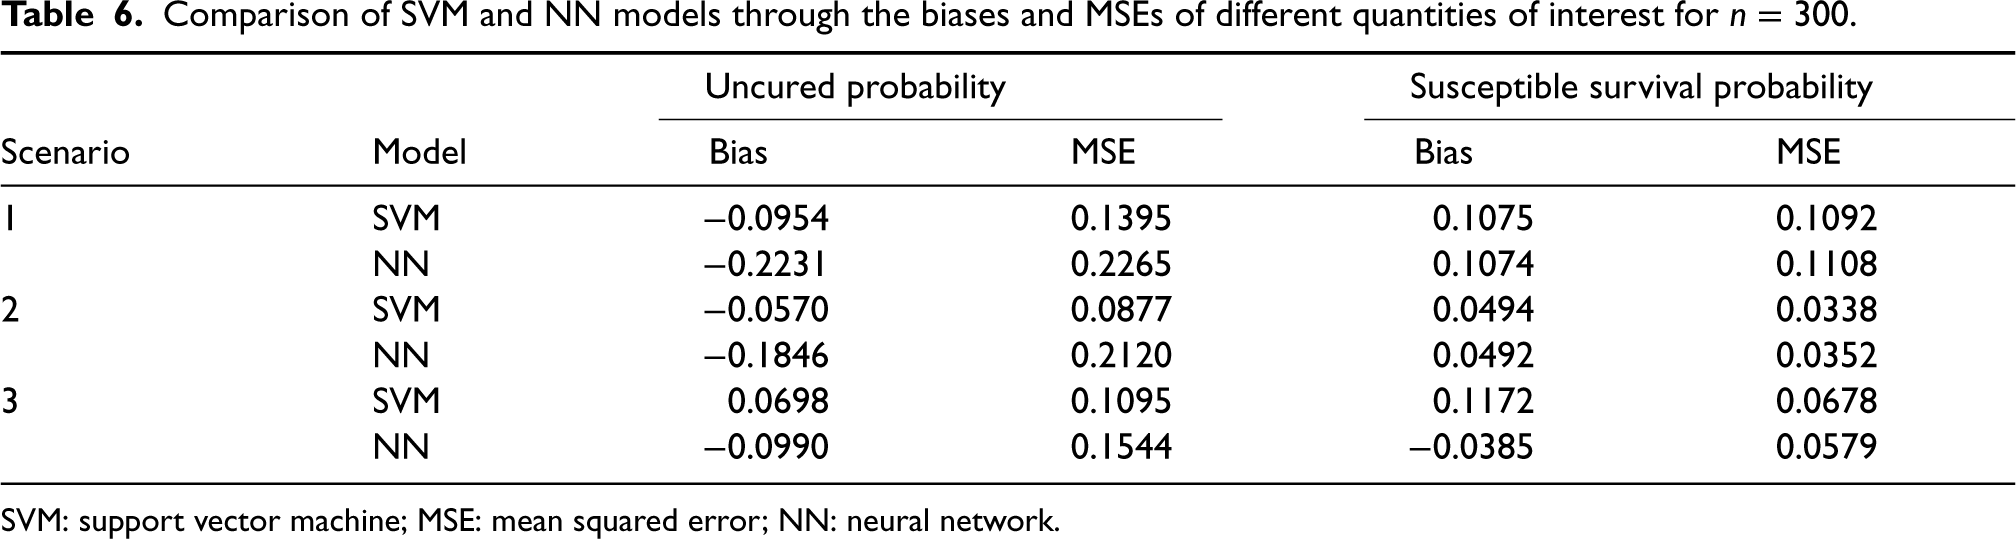
SVM: support vector machine; MSE: mean squared error; NN: neural network.
As per the suggestion of a reviewer, we also used the NN to model the incidence part, that is,
Comparison of SVM and NN models through the AUC values and computation times for
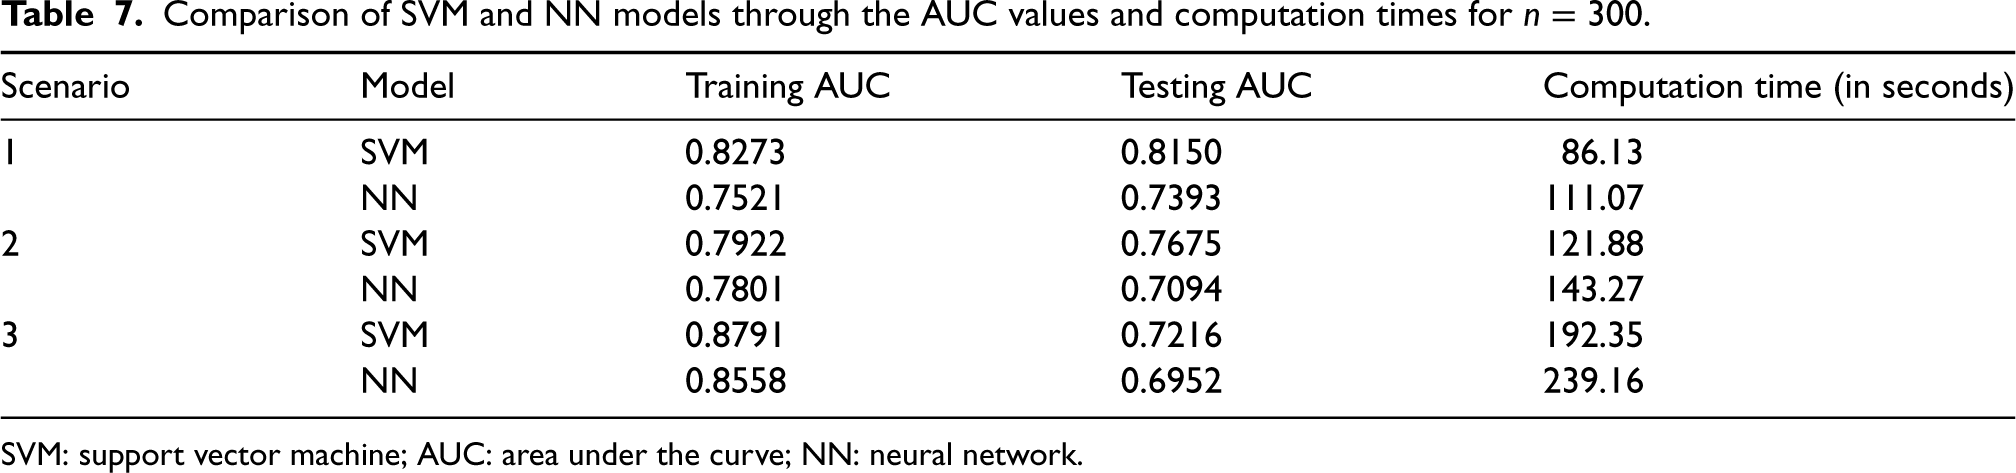
SVM: support vector machine; AUC: area under the curve; NN: neural network.
We further demonstrate our proposed methodology using a data set that is extracted from the NASA’s Hypobaric Decompression Sickness Data Bank, hereafter referred as HDSD data. 59 The data set has information on subjects who underwent denitrogenation test procedures before being exposed to a hypobaric environment. The event of interest is the onset of grade IV venous gas emboli (VGE). The time to onset of grade IV VGE, if it occurred, was not exactly observed but was contained within a time interval. The covariates of interest are age (in years), sex (1: male; 0: female), TR360 which is a measure of decompression stress that ranges from 1.04 to 1.89, and noadyn which is an indicator of whether the subject was ambulatory (noadyn = 1) or lower body adynamic (noadyn = 0) during the test session. Information on 236 subjects is available for downstream analysis whose event times are either interval censored or right censored. 41 In Figure 4, we present a plot of the non-parametric maximum likelihood estimate (NPMLE) of the survival function. Clearly, we can see that the plot levels off to a significant non-zero proportion. This indicates that there could be a greater likelihood of the presence of cured fraction in the data.
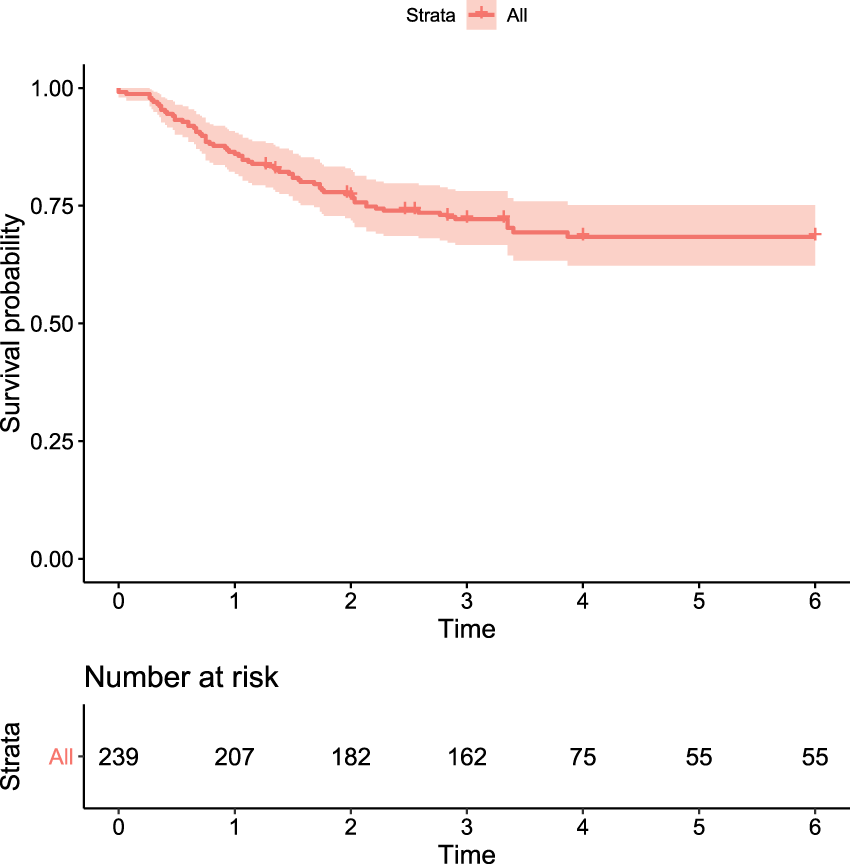
Plot of the NPMLE of the survival function for the HDSD data.
We fit the proposed SVM-based mixture cure model and, for comparison, we also fit the logistic regression-based and spline regression-based mixture cure models. Noting that the sample size for the HDSD data is small, and to avoid over-fitting or under-fitting, we adopt a 10-fold cross-validation technique that allows us to simultaneously fit and evaluate each model on the full data. This is consistent with Hastie et al. 54 First, we draw inference on the incidence part of the model. In Figure 5, we plot the estimates of the uncured probabilities against age and TR360 when stratified by sex and noadyn for all models. Clearly, under the proposed SVM-based model, the change in the estimates of the uncured probabilities is non-monotonic with respect to age and TR360. This non-monotonic relationship is not captured by the logistic regression-based and spline regression-based models. Note that for the spline regression-based model, the pattern is similar to the logistic regression-based model.
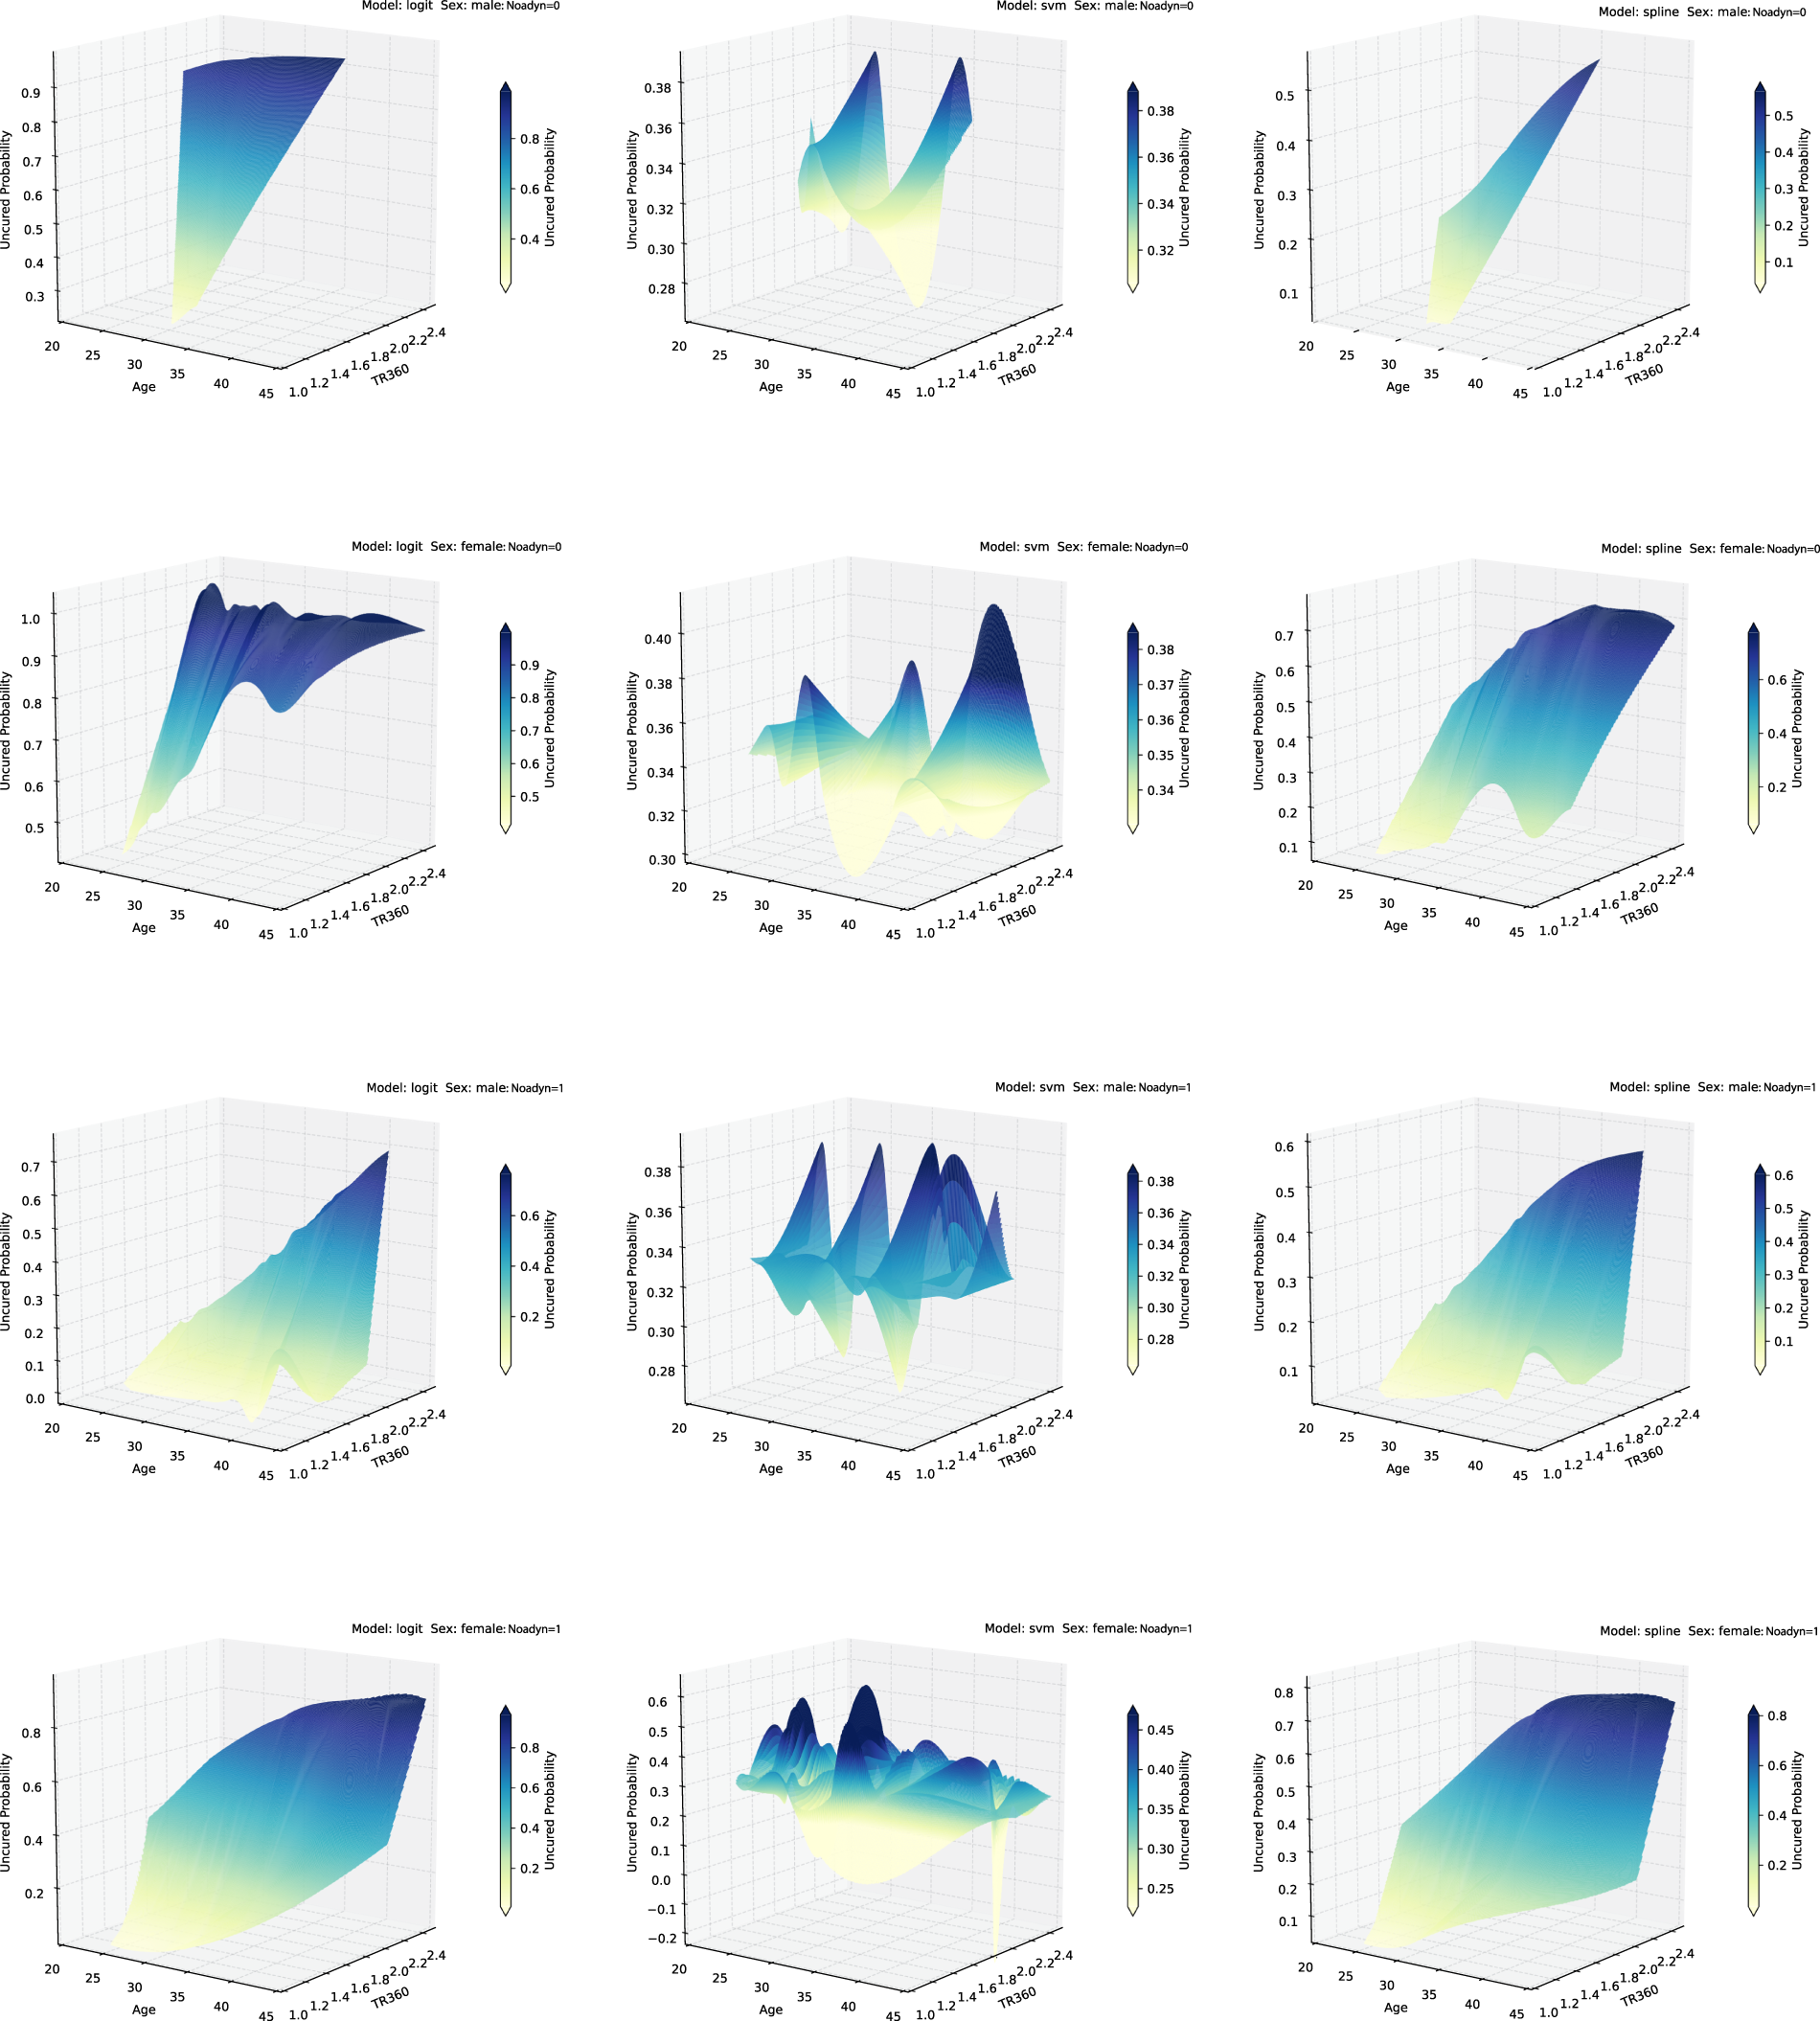
Estimates of uncured probabilities as a function of age and TR360 when stratified by noadyn and sex for the Hypobaric decompression sickness database (HDSD) data.
Next, we verify whether our proposed model’s ability to capture nonlinear pattern in the data can result in improved predictive accuracy when predicting the cured/uncured statuses are of interest. This can be verified using the ROC curves and by comparing the AUC values for different models that we have considered. Noting that the cured statuses are unknown for the set of right censored observations in a real data, we first impute the missing cured/uncured statuses. For each right censored observation, the missing uncured status can be imputed by generating a random number from a Bernoulli distribution whose success probability is the conditional probability of uncured, as given in (18). With the complete knowledge of cured/uncured statuses for all subjects, the ROC curves can be drawn and the AUC values can be computed. However, since this method involves simulation (i.e. randomness), we make the ROC curves and the AUC values more consistent by repeating the procedure 500 times and reporting the averaged ROC curves and the averaged AUC values. Figure 6 presents the averaged ROC curves for different models and the corresponding AUC values turn out to be 0.8795, 0.8627, and 0.7766 for the SVM-based, logistic regression-based, and spline regression-based models, respectively. Thus, the proposed SVM-based model indeed provides the highest predictive accuracy for the considered HDSD data.
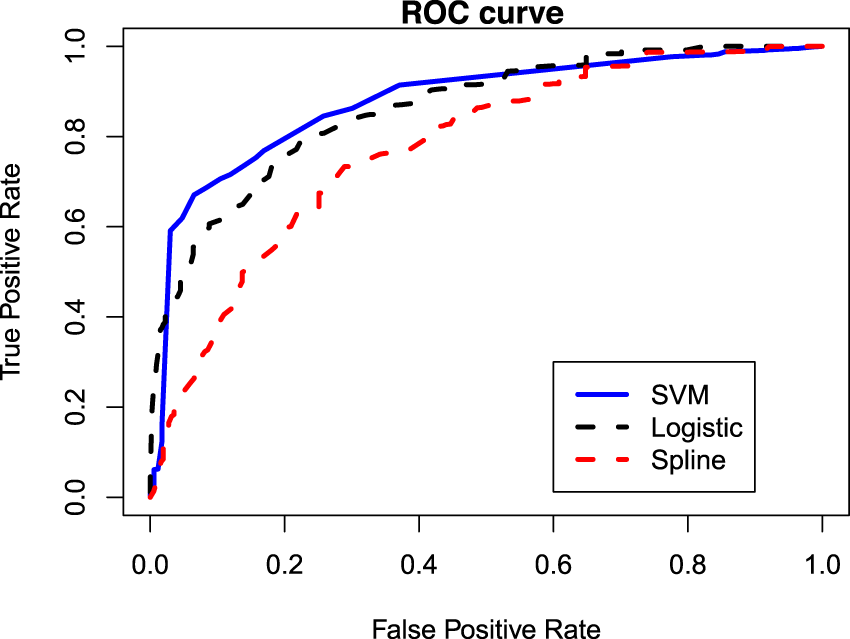
ROC curves under different models for the HDSD data.
Finally, we look at the results related to the latency parts of the fitted models. Table 8 presents the estimates of the latency parameters, their standard deviations (SD), and the
Estimation results corresponding to the latency parameters for the HDSD data.
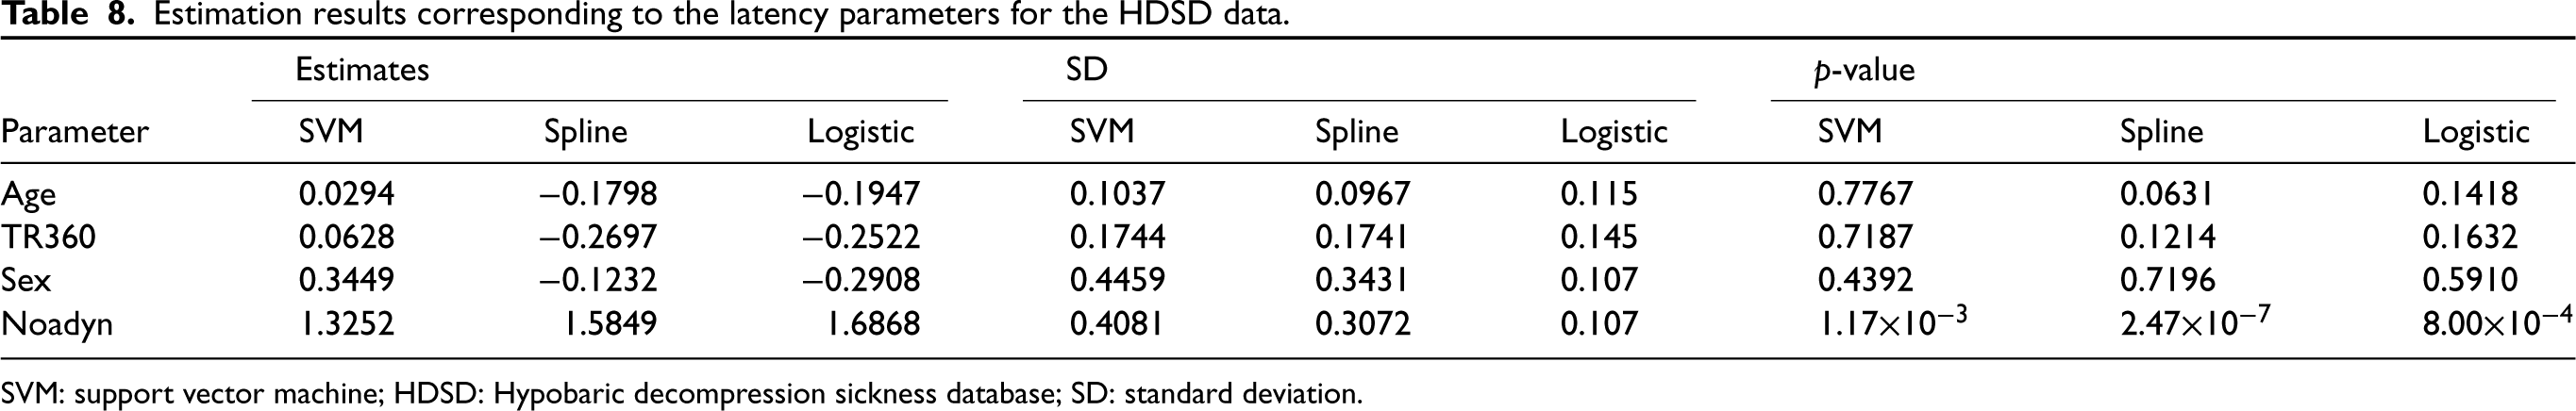
SVM: support vector machine; HDSD: Hypobaric decompression sickness database; SD: standard deviation.
The SVM has received a great amount of interest in the past two decades. It has been shown that the SVM performs well in a wide array of problems including face detection, text categorization and pedestrian detection. However, the use of the SVM in the context of cure rate models is new and not well explored. In this article, we have proposed a new cure rate model that uses the SVM to model the incidence part and a PH structure to model the latency part for survival data subject to interval censoring. The new cure rate model inherits the properties of the SVM and can capture more complex classification boundaries. For the estimation purpose, we have proposed an EM algorithm where sequential minimal optimization together with Platt scaling method are employed to estimate the uncured probabilities. In this regard, due to the unavailability of some cured statuses, we make use of a multiple imputation-based approach to generate missing cured statuses. Due to the complexity of the proposed model and the estimation method, we approximate the standard errors of the estimated parameters using non-parametric bootstrapping. Through a simulation study, we have shown that when the true classification boundary is nonlinear the proposed SVM-based mixture cure model overall performs better than the standard logistic regression-based and spline-based mixture cure models. As future research, it is of great interest to study the performance of the proposed model in the presence of high-dimensional covariates and to develop computationally efficient methods for covariate selection. It is also of great interest to extend the proposed model to accommodate a competing risks scenario.18,60 Furthermore, it is also possible to explore other machine learning algorithms (e.g. NN or tree-based approaches) to study more complicated cure rate models such as those that look at the elimination of risk factors.61–66 We are currently looking at some of these problems and we hope to report the findings in our upcoming manuscripts.
Supplemental Material
sj-pdf-1-smm-10.1177_09622802231210917 - Supplemental material for A support vector machine-based cure rate model for interval censored data
Supplemental material, sj-pdf-1-smm-10.1177_09622802231210917 for A support vector machine-based cure rate model for interval censored data by Suvra Pal, Yingwei Peng, Wisdom Aselisewine and Sandip Barui in Statistical Methods in Medical Research
Footnotes
Acknowledgements
The authors thank two anonymous reviewers for their careful review and comments which led to this improved version of the manuscript.
Declaration of conflicting interests
The author(s) declared no potential conflicts of interest with respect to the research, authorship and/or publication of this article.
Funding
The author(s) disclosed receipt of the following financial support for the research, authorship, and/or publication of this article: Suvra Pal’s work was supported by the National Institute Of General Medical Sciences of the National Institutes of Health under Award Number R15GM150091. The content is solely the responsibility of the author and does not necessarily represent the official views of the National Institutes of Health. Yingwei Peng’s work was partially supported by a Discovery grant from the Natural Sciences and Engineering Research Council of Canada.
Supplemental material
Supplemental material for this article is available online.
References
Supplementary Material
Please find the following supplemental material available below.
For Open Access articles published under a Creative Commons License, all supplemental material carries the same license as the article it is associated with.
For non-Open Access articles published, all supplemental material carries a non-exclusive license, and permission requests for re-use of supplemental material or any part of supplemental material shall be sent directly to the copyright owner as specified in the copyright notice associated with the article.