
Abstract
The success of preclinical research hinges on exploratory and confirmatory animal studies. Traditional null hypothesis significance testing is a common approach to eliminate the chaff from a collection of drugs, so that only the most promising treatments are funneled through to clinical research phases. Balancing the number of false discoveries and false omissions is an important aspect to consider during this process. In this paper, we compare several preclinical research pipelines, either based on null hypothesis significance testing or based on Bayesian statistical decision criteria. We build on a recently published large-scale meta-analysis of reported effect sizes in preclinical animal research and elicit a non-informative prior distribution under which both approaches are compared. After correcting for publication bias and shrinkage of effect sizes in replication studies, simulations show that (i) a shift towards statistical approaches which explicitly incorporate the minimum clinically important difference reduces the false discovery rate of frequentist approaches and (ii) a shift towards Bayesian statistical decision criteria can improve the reliability of preclinical animal research by reducing the number of false-positive findings. It is shown that these benefits hold while keeping the number of experimental units low which are required for a confirmatory follow-up study. Results show that Bayesian statistical decision criteria can help in improving the reliability of preclinical animal research and should be considered more frequently in practice.
Keywords
Introduction
Preclinical research is necessary to identify drugs and treatments for further investigation in clinical trials. According to Kimmelman et al. 1 , there are two separate approaches which exist to identify promising treatments. Exploratory research is usually the core operating model in early preclinical research where the goal is to filter effective drugs and treatments from a large pool of (possibly ineffective) candidates. The primary target of exploratory research is to generate hypotheses which are then examined in a replication study in the second scientific operating model, which is confirmatory research. 2
Testing the hypotheses generated in exploratory research in subsequent confirmatory research implies that the evidence about a new drug or treatment is more robust compared to when no confirmatory or replication attempt is undertaken. 3 However, there are pitfalls to care about. First, there is always the risk to miss an effective treatment in exploratory research because it fails to meet a required statistical decision threshold. Second, there is the risk of running a confirmatory replication study although the exploratory research finding is a false-positive result.
A common approach to filter promising drugs and treatments in exploratory medical research for further investigation is the p-value which is the key statistic in null hypothesis significance testing (NHST). 4 The merits and limitations of p-values have been debated widely for years, 5 and some have argued to focus on effect size estimation instead of relying on the concept of statistical significance.6,7 According to these approaches, the minimum clinically important difference (MCID) and the scientific or clinical relevance of research results should be placed in the center of a statistical analysis and trial design. 8 Recently, Danziger et al. 9 have shown that focussing on the smallest effect size of interest (SESOI)—which is equivalent to the MCID—instead of focusing on statistically significant results can improve the discovery rates of truly effective treatments in preclinical research.
The situation is complicated by the fact that the interplay between exploratory and confirmatory research influences the resulting characteristics of a preclinical animal research pipeline. Regarding the latter, we do not denote the entire process of in vitro and in vivo studies as a preclinical research pipeline. Instead, we denote by it solely an exploratory preclinical animal study and a subsequent confirmatory study. The latter could for example investigate the toxicity, pharmakokinetics or study dose–response relationships.
While sensitive decision criteria in exploratory research should detect a large number of possibly effective candidates, confirmatory studies must aim at reducing the number of false-positive results to ensure that only truly effective treatments transition to clinical studies. The statistical decision criteria employed in this process therefore strongly influence the resulting performance of a preclinical research pipeline in terms of statistical quantities such as the associated positive and negative predictive value, false discovery rate and false omission rate.
While Danziger et al. 9 follow a p-value-based approach to improve the reliability of preclinical research there are various authors who have advocated Bayesian decision criteria (BDCs) to address the reliability of biomedical research.10,11 Examples include reverse-Bayes methods 12 and Bayesian alternatives to p-values.13–15 Whether a Bayesian approach is taken or not, transparent reporting of statistical analyses as well as the refinement of experimental design is a key requirement to optimize the reliability of preclinical research, 16 and in this article, we focus on two approaches to filter effective drugs and treatments in exploratory preclinical research for transitioning to a confirmatory replication study. The performance of two preclinical research pipelines is assessed and compared, showing that a methodological shift to methods which incorporate the smallest effect size of interest can improve the reliability of positive preclinical research findings.
Typically, preclinical studies are not very large. Still, these studies have to provide information on drug dosing and the associated toxicity levels. Once this information is obtained, researchers review their findings and decide whether the drug should be tested in humans.
17
Here, we make the following assumptions:
We make no restrictions on whether a dose-finding preclinical study is conducted, a study which gathers information about the pharmacokinetics of the drug, or a study which studies the toxicity of the new agent. We label these preclinical animal studies exploratory studies henceforth and assume that to decide whether or not to transition to a phase I clinical trial, a replication study is carried out first.
18
We do, however, make the assumption that the exploratory study is already a phase I in vivo study involving animals. This aligns our setup with the ones considered by Danziger et al.,
9
Bonapersona et al.,
11
and Anderson et al.
4
We assume that the primary endpoint of the study is continuous.
Although the last point is a somewhat simplified assumption it allows to isolate the findings of this article without distractions due to a more complicated design with possibly multiple (and non-continuous) endpoints. Also, based on the meta-analysis of Carneiro et al.
19
and Bonapersona et al.,
11
it focuses on one of the most common scenarios in preclinical animal studies.
An important further assumption is that we do not focus on adaptive designs such as group-sequential designs which allow for early stopping due to futility or efficacy based on interim analyses. While there are important advantages of adaptive designs such as yielding smaller sample sizes and solving ethical issues (e.g. it might not be feasible to conduct an independent replication study involving animal use after an exploratory study has already made use of animals), Madjid et al. 20 notes that “Approval to use animal subjects often requires the number of animals and methods to be specified beforehand. (…) Changes to animal use regulations may therefore be necessary in order to incorporate adaptive designs.” Furthermore, a more problematic aspect is given by the dearth of accessible software packages which implement adaptive designs, in particular, for Bayesian methods. Majid et al. 20 note that “Although a few packages exist that can handle the necessary calculations, most statistical software currently in use is inadequate for the task.” Nevertheless, adaptive designs, in particular, group-sequential designs can substantially increase the efficiency of a design—see, for example, Neumann et al. 21 —and should be used more often also in preclinical animal research. Here, however, we refrain from investigating adaptive designs due to the two reasons outlined above and stick to fixed sample size designs. This is also crucial as sample size calculations for the Bayesian replication studies build on the fixed sample size designs.
The plan of the article is as follows: The next section details the different approaches which are compared in this article. Section 3 then details the BDCs which are analyzed as possible alternatives to a p-value-based preclinical research pipeline. Section 4 provides information about the simulation study which was conducted to assess the statistical performance of the competing approaches, and Section 5 presents the results. The last section provides a discussion and conclusion.
Two competing preclinical research pipelines
Statistical significance pipeline
The first preclinical research pipeline is based on the p-value and statistical significance. Therefore, it is assumed that an exploratory study is performed at a research laboratory and is analyzed via NHST. According to the literature reviews of Carneiro et al.
19
and Bonapersona et al.
11
, the comparison of two groups by means of Welch’s two-sample t-test under the assumption that data in each group is normal is a widely established statistical method in preclinical animal research. Therefore, we assume that the primary study endpoint is measured in the treatment and control groups as

The decision criterion of the first preclinical research pipeline is the p-value, and the test level

If
The p-value in Welch’s two-sample t-test does not aim at investigating the smallest effect size of interest, however. Therefore, the two one-sided test (TOST) procedure is conducted as an alternative. Details about the TOST procedure are given by Lakens et al., 25 Schieh, 26 and Kelter. 15 Importantly, as the goal here is not to establish equivalence but guarantee a minimum effect of interest, the terminology minimum effects test (MET) or superiority test is more appropriate.
Welch’s t-test and the MET used here differ in the hypothesis they test. Welch’s t-test can only reject the null hypothesis
In both frequentist approaches, we take a Neyman-Pearsonian stance which decides in favor of
Choice of methods
We note that an alternative frequentist method is the dual-criterion design proposed by Rosenkranz 27 which combines significance and scientific relevance. However, we refrain from implementing this design because the setup of the simulation study is in conflict with the assumptions of the design. 1 Other frequentist approaches are given by Errington et al. 23 and range from the same-direction of effect sizes criterion to comparing original effect size with the 95% confidence interval of the replication effect size. While these methods have their respective merit, we focus on the two-trials rule here which relies on two significant p-values, and the MET as a possible alternative. This is also the setup considered by Danziger et al. 9 and possibly resembles current research practice most reasonably.
BDCs pipeline
The second preclinical research pipeline relies on BDCs which focus on the minimum clinically important effect size
The performance of both research trajectories is analyzed based on a recently published distribution of effect sizes in preclinical animal research in neuroscience. 11 The primary performance measures of interest are the resulting positive predictive values (PPV), negative predictive values (NPV), false discovery proportion (FDP), and false omission rates (FOM) of each trajectory. As two of these values suffice to determine the remaining two, the focus will be on the false discovery proportion and the false omission rate.
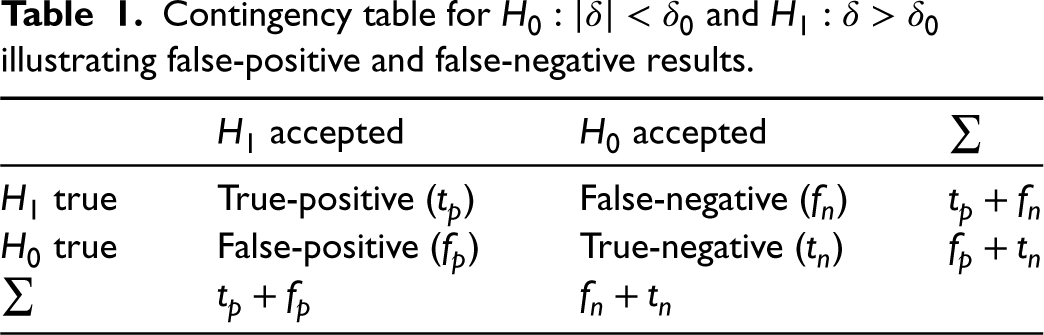
The PPV is the percentage of true-positive results among all positive results. The NPV is the percentage of true-negative results among all negative results. The FDP is the percentage of false-positive results among all positive results, and the FOR is the percentage of false-negative results among all negative results. These quantities are formally defined in the “Methods” section. Importantly, the null hypothesis in the simulation study is a composite hypothesis and is given as
Bayesian decision criteria
In this section, the four BDCs are detailed which are used in the second preclinical research pipeline. In contrast to the p-value-based trajectory, Bayesian analysis offers a variety of alternatives to the p-value for testing a hypothesis. For an overview, see Kelter 28 and Quatto et al. 13 All approaches are united by the fact that the prior distribution for the parameter(s) of interest must be elicited.
In practice, researchers often have an expectation about the direction of an effect so that the test of
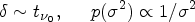
Henceforth, it is assumed that in the exploratory study the direction of the effect is specified and one tests

As primary interest lies in the effect size
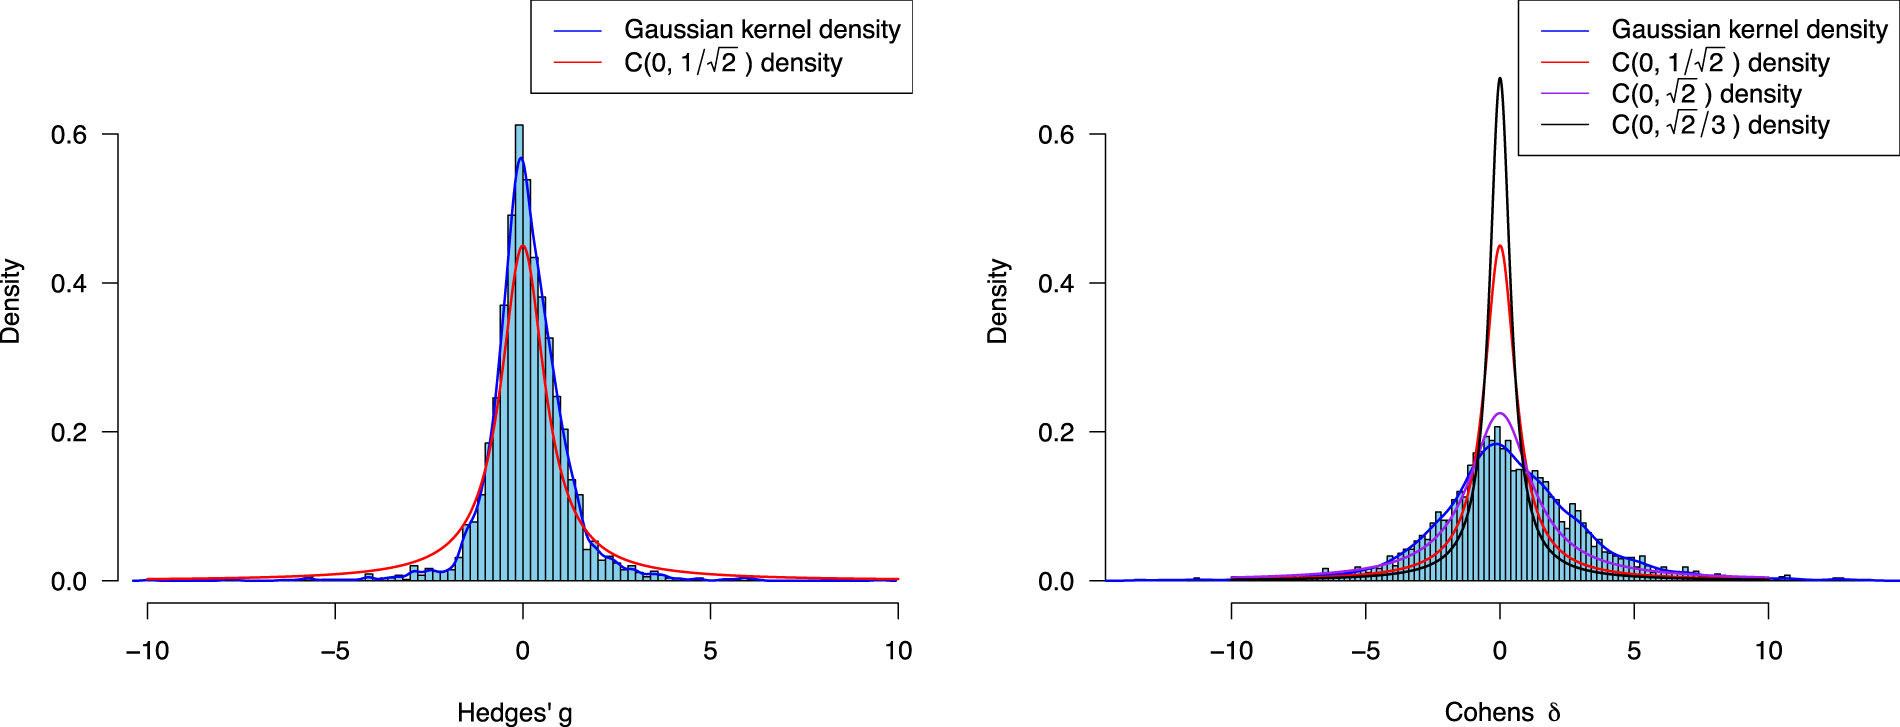
Empirical effect size distribution of Hedges’
The red solid line shows a Cauchy

There is a variety of Bayesian methods to test a hypothesis.14,35,36 In the context of an original and replication study, there are also frameworks which aim at quantification of replication success of a study, such as reverse-Bayes methods as proposed by Held37,12 which include meta-analytic approaches, the sceptical p-value, sceptical Bayes factor (BF), and even frequentist methods such as the two-trials rule (which essentially reduces to the p-value-based research pipeline outlined above, where replication success is defined as two significant hypothesis tests). All of these methods have their merit, and most Bayesian methods which explicitly aim at quantifying replication success are currently located inside the hierarchical normal-normal model which is outlined in the Online Appendix. Another approach which is not located inside the hierarchical normal-normal model is the replication BF. 38
Here, we focus on Bayesian methods which aim at testing an interval hypothesis, see Linde 39 and Kelter. 15 These methods naturally anchor to the task of incorporating a SESOI into a hypothesis test, and relevant methods include (1) posterior probabilities,15,36 (2) interval BFs,40,41 (3) the region of practical equivalence (ROPE),42,7,39 and (4) the full Bayesian evidence test (FBET).43,44 While these methods are regularly used in the literature to test an interval hypothesis, there is no current framework to use them for judging the success of a replication study. To meet this limitation, we anchor these methods to the hierarchical normal-normal model detailed in Pawel et al. 24 and develop sample size calculation formulas for the replication study which assert a predefined probability of replication success. These derivations are relegated to the Online Appendix, and details about the BDCs (1) to (4) follow next.
Posterior probabilities
The first Bayesian decision criterion is to decide based on posterior probabilities of hypotheses. In the p-value-based research trajectory, we test
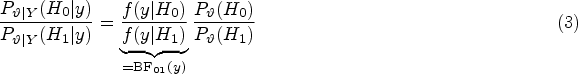

Furthermore, to align prior odds of the null and alternative hypotheses with the beliefs expressed by the
Concerning the two-sample t-test, Morey et al.
40
built on the standard Bayesian two-sample t-test model of Rouder et al.,
31
where

Morey et al.
40
extended the approach of Rouder et al.
31
and introduced the non-overlapping hypotheses (NOH) model where


The third Bayesian decision criterion focusses on measuring the location of a Bayesian interval estimate like equal-tailed credible or highest-posterior-density (HPD) interval inside the region of practical equivalence, the ROPE. The concept of a ROPE was independently proposed in a wide range of scientific domains, compare Kruschke,
7
Lakens et al.,
25
and Kelter.
48
Starting from the posterior distribution
The Bayesian evidence test and e-values
Interestingly, the decision rule of the ROPE is only a special case of a decision based on the Bayesian evidence values, which were recently proposed as a unification of Bayesian hypothesis testing and parameter estimation.
43
Kelter
43
proposed the full Bayesian evidence test (FBET), which is a generalization of the full Bayesian significance test (FBST). Details on the FBST can be found by Pereira and Stern
44
and Kelter,49,28 while the FBET was proposed by Kelter.
43
The FBET can be used with any standard parametric statistical model, where
The Bayesian evidence interval
The FBET uses the Bayesian evidence interval for quantifying the evidence in favor or against a hypothesis. Denote by

The Bayesian evidence interval


In the context of the exploratory study the same hypothesis
Figure 2 shows the two competing preclinical research pipelines. The top part shows the frequentist research pipelines, and the lower part details the Bayesian research pipelines. Details regarding the methodology follow below.
SESOIs for exploratory and confirmatory research
To implement the preclinical research pipeline with BDCs which focus on the smallest effect size of interest, the latter must be specified. Danziger et al.
9
used a similar approach based on the frequentist estimation of the SESOI and used Hedges’ First, a double-testing strategy which employs a statistical test—NHST when using p-values (top part in Figure 2) and one of the four options outlined in the previous section when using BDCs (bottom part in Figure 2)—both in the exploratory and confirmatory studies. Second, an approach similar to the one of Danziger et al.
9
where a check is performed based on the exploratory study data
Thus, the two research pipelines in Figure 2 are split into two subcases each of which are also shown in Figure 2. In all trajectories,


As outlined previously, the data-generating model follows the assumptions of Welch’s two-sample t-test, and a typical size of experimental units in exploratory preclinical animal research is
First, the test concerns Second, selecting 50% power for Third, for small to moderate effect sizes power analyses based on more than 50% power can result in unrealistically large sample sizes for confirmatory replication studies. Unrealistically means that researchers would probably not pursue such a replication attempt when faced with such a sample size requirement due to economic constraints. Figure 3 shows some of the simulation results and demonstrates that even for 50% power some trajectories require a substantial number of animals (e.g. Fourth, when using
However, there are constraints which should be considered to avoid unrealistic sample sizes. First, a lower bound for the sample size
As BDCs require simulations to investigate frequentist operating characteristics such as the power, a Monte Carlo simulation can be carried out to obtain power estimates under various true values of
A crucial aspect was raised by one reviewer, which is that BDCs should ideally be based on the Bayesian approaches to the sample size calculation for replication studies. We agree with this recommendation and, therefore, followed the hierarchical normal-normal model outlined by Pawel et al. 24 to calculate the required sample sizes for the replication study. The Online Appendix outlines the necessary theory of this approach, and we developed novel sample size calculation formulas for all four BDCs except interval BFs. The latter require extensive computational effort which renders the Bayesian sample size calculation inaccessible for this decision criterion. Therefore, we opted for the Bayesian sample size calculation for posterior probabilities when using interval BFs. This is motivated mainly by the fact that under prior odds of one, posterior odds and BFs are decision-theoretically equivalent, compare Robert. 55 We further note that the sample size calculations shown in Figure 3 are a special case of the more general formulas derived in the Online Appendix, but are rendered unrealistic from a Bayesian point of view because uncertainty about the true parameter value is essentially ignored. Thus, power calculations in Figure 3 are used only for p-values and MET-based research pipelines, while all Bayesian sample size calculations follow the approach detailed in the Online Appendix.
As a sidenote, Figure 3 shows that the power of various methods (e.g. the ROPE, posterior probabilities, the MET, or the FBET) does remain close to zero when the true effect size is equal to
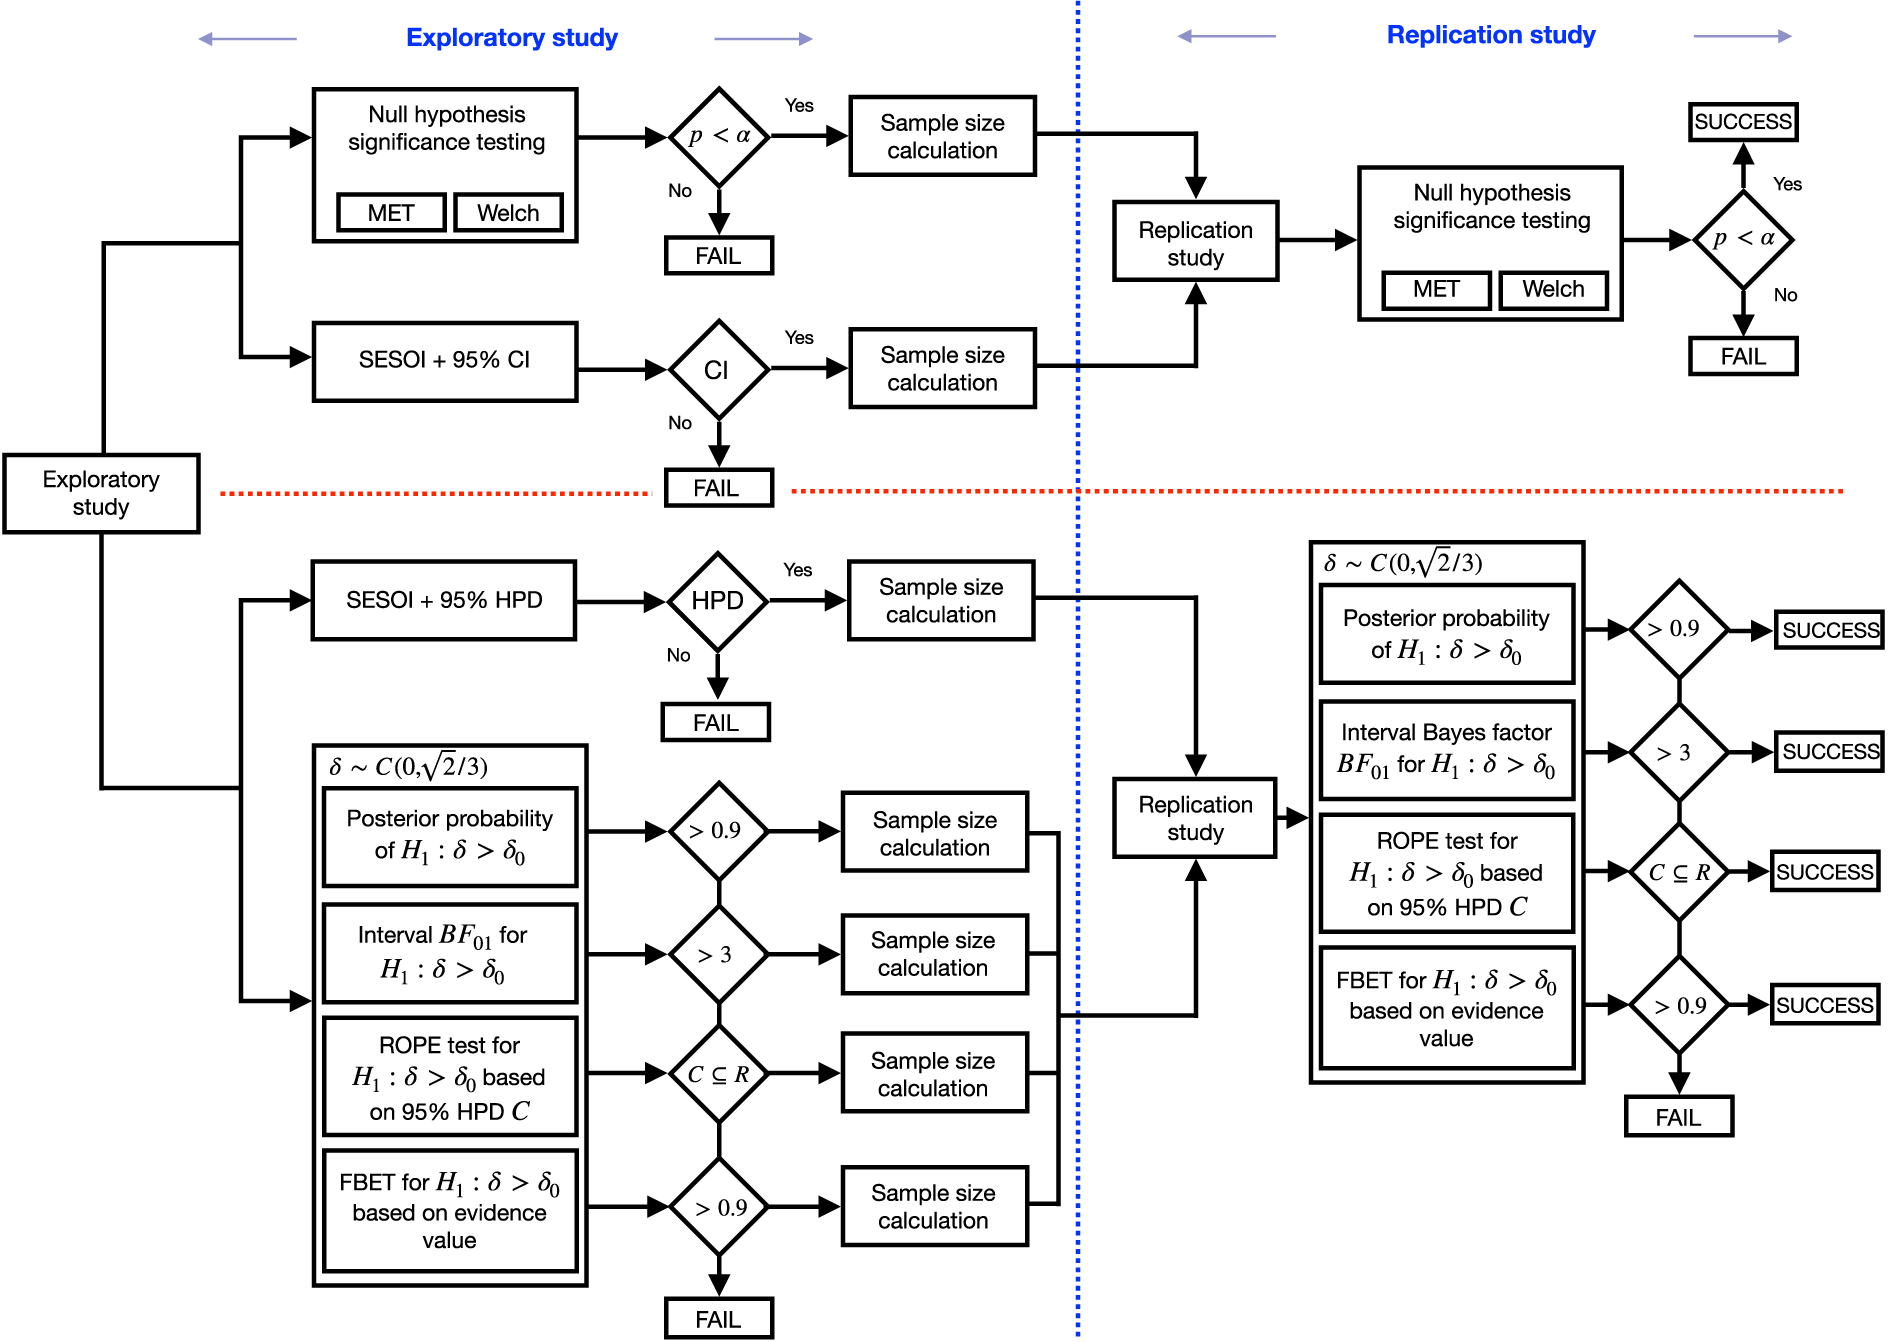
Two preclinical research pipelines each comprising an exploratory and possibly a confirmatory study, depending on the results of the exploratory study; the traditional trajectory is based on frequentist methods (above the horizontal red line) and uses the NHST and statistical significance of the exploratory study results; in the confirmatory study, the p-value is used; the Bayesian trajectory (below the horizontal red line, a color version can be found in the electronic version of the article) instead employs BDCs in the exploratory study and confirmatory study. NHST: null hypothesis significance testing; BDCs: Bayesian decision criteria.
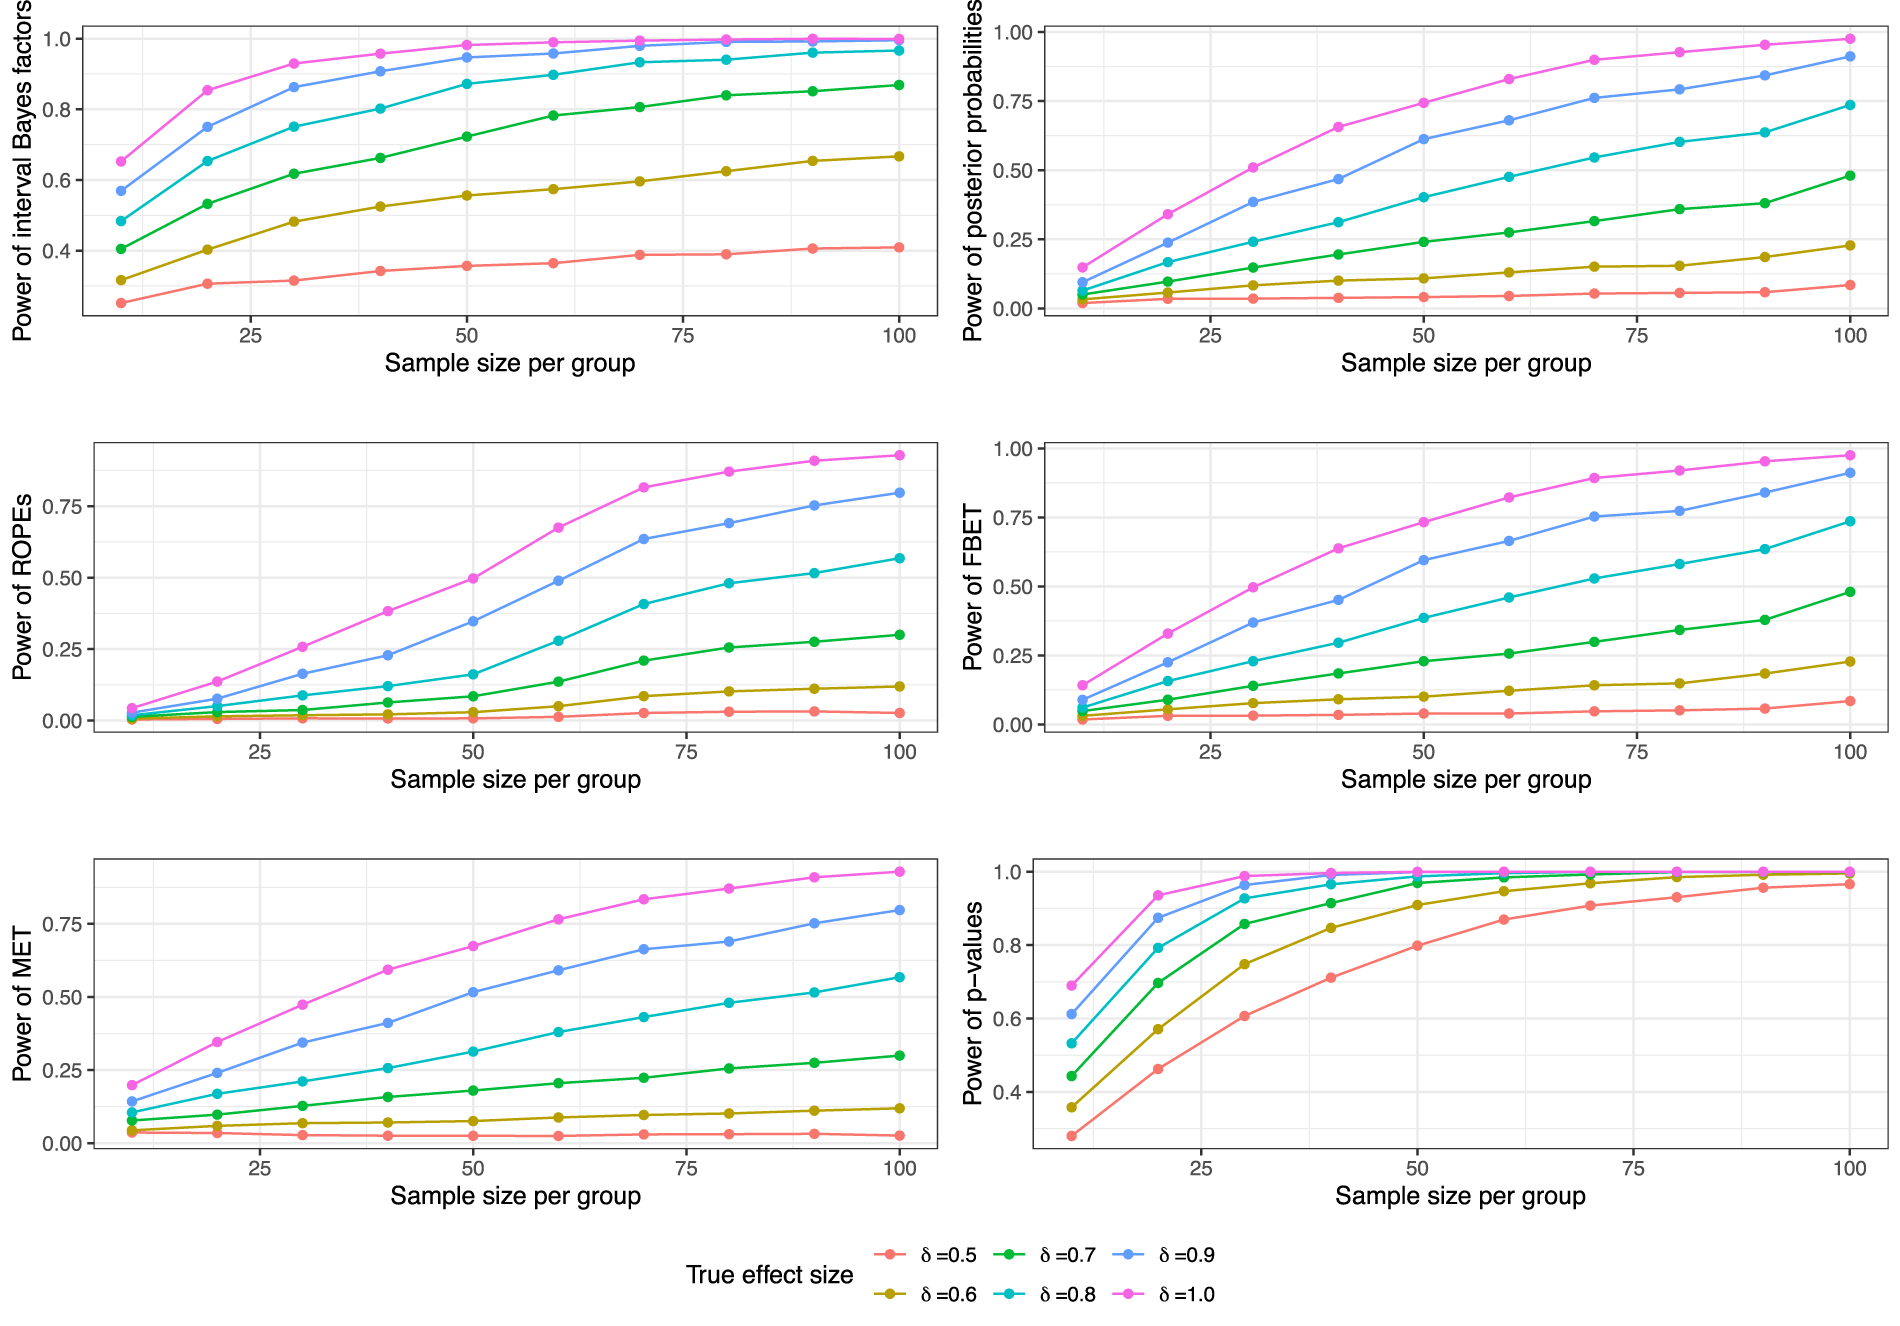
Bayesian power analysis simulations for the different BDCs, the MET, and p-values in Welch’s two-sample t-test. These power analyses are a special case of the more general Bayesian sample size calculations in the hierarchical normal-normal model outlined in the Online Appendix and detailed in Pawel et al..
24
From a hybrid Bayesian-frequentist perspective, they are justified. From a fully Bayesian point of view, they ignore the uncertainty about the true effect size
The design of the simulation study is summarized in Figure 2. For the exploratory study, the true effect size

The Bayesian trajectories either perform a hypothesis test based on one of the four BDCs outlined above, or check whether the 95% HPD includes values larger than the SESOI
The analysis of the replication study data
Importantly, in the confirmatory study data in both groups is not simulated according to the same value
Data in the confirmatory study is thus simulated according to


Contingency table for
The negative predictive value (NPV)


Importantly, for the frequentist trajectory using Welch’s two-sample t-test a significant test with
Figure 4 shows the distribution of effect sizes which yielded a successful exploratory and confirmatory study.
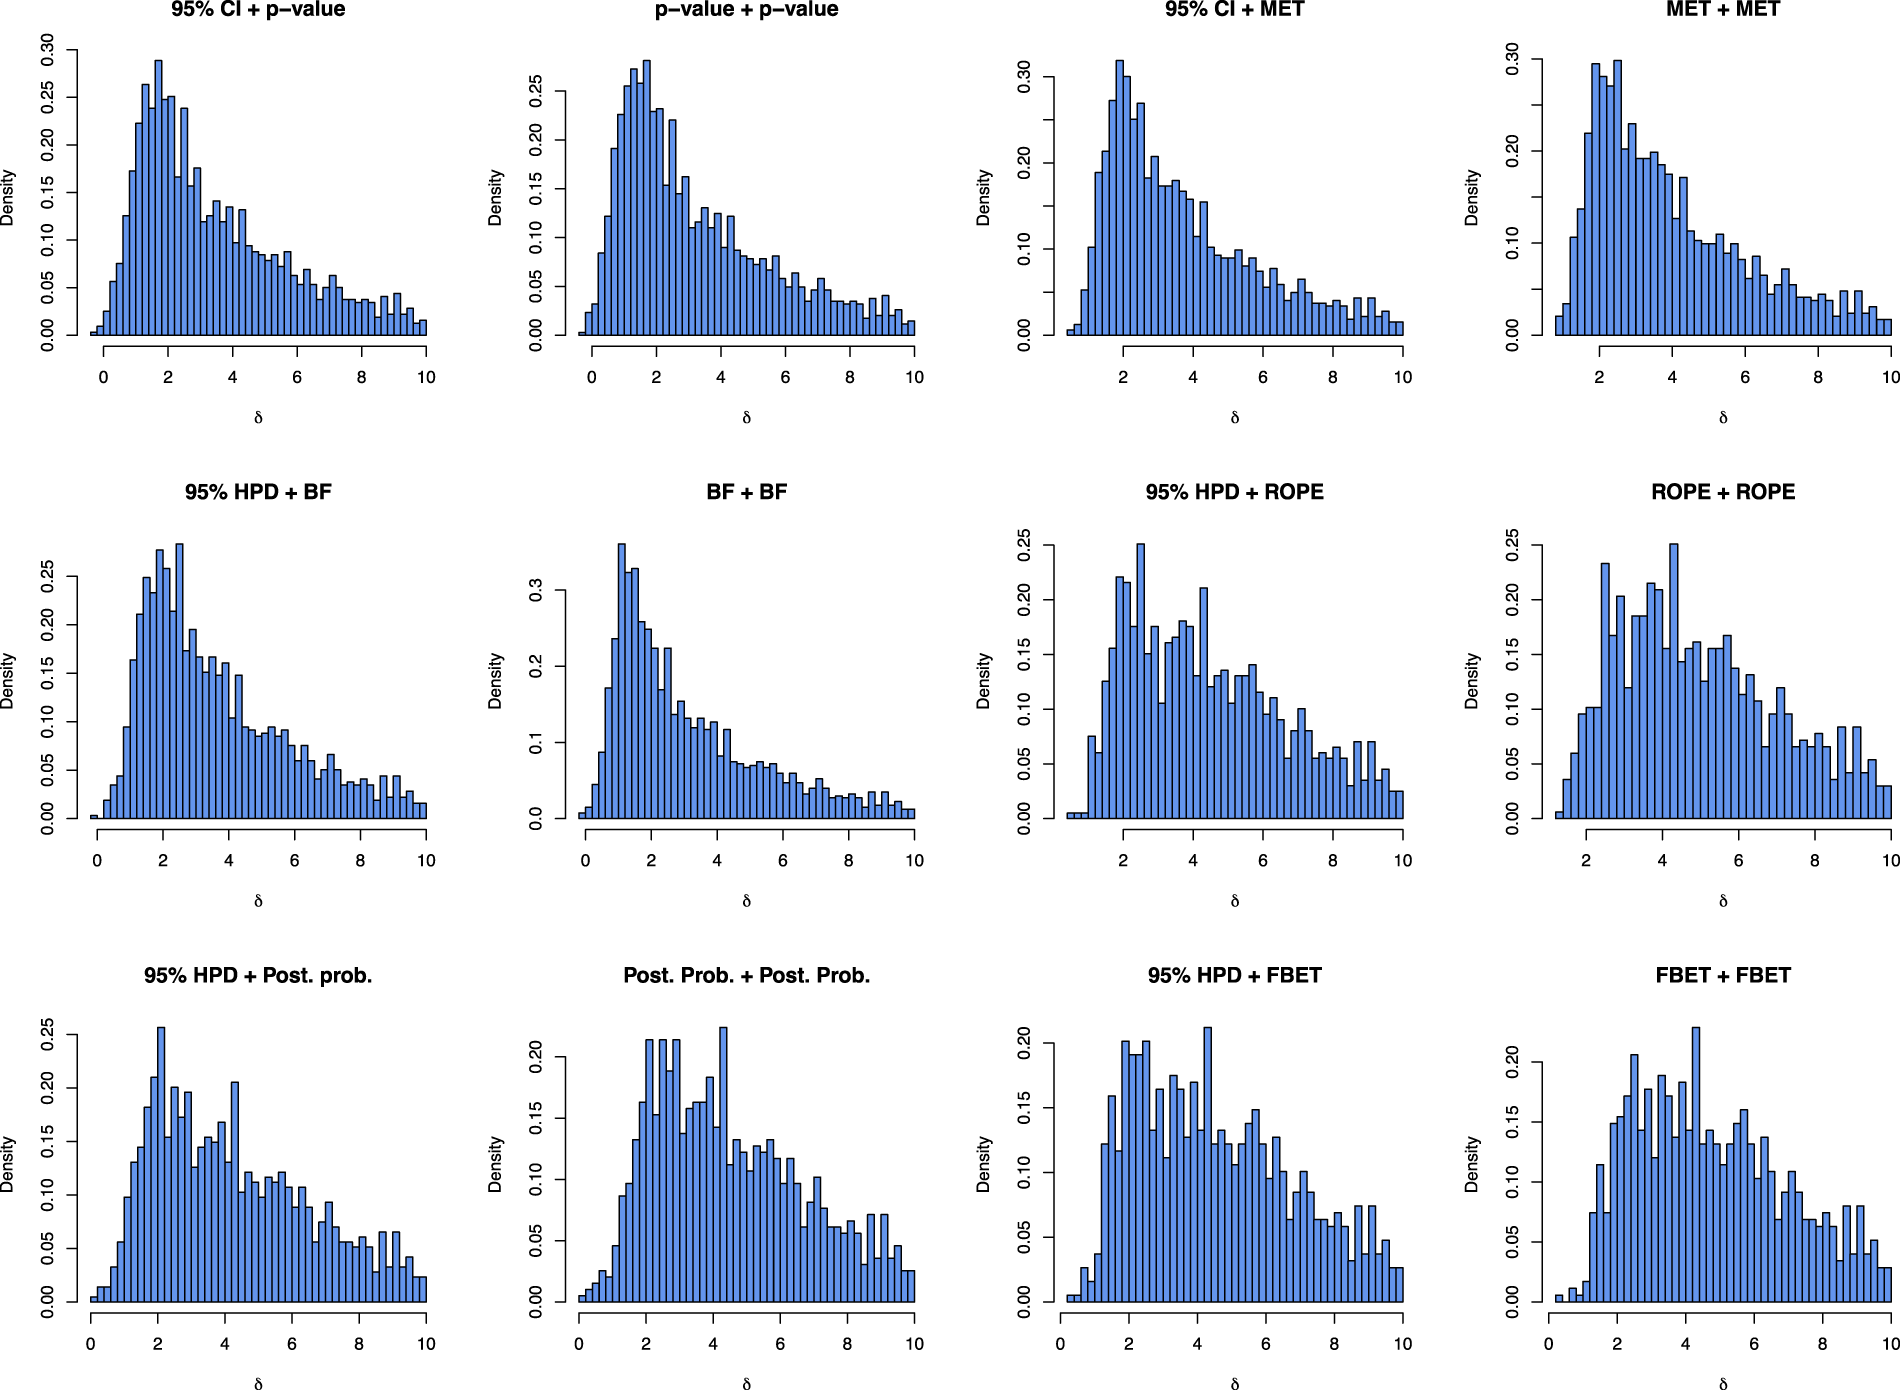
Visualization of effect sizes
From the
Figure 4 shows that there is no substantial difference between double-testing and interval-based estimation plus testing approaches when it comes to which effect sizes do lead to a successful trajectory. The results in the two top left panels for 95% CI + p-value show that compared to a p-value + p-value-based trajectory shown in the panel right to it, more effect sizes do lead to a success in both studies, but the distribution of successful effect sizes does not change substantially. The same phenomenon holds for the other approaches, too. A noticeable exception is the BF, where more effect sizes in the range of
Performance metrics
Figure 5 shows the results for the FDP and FOM for each research pipeline. Starting in the left plot, the two left results are the frequentist research pipelines, and the four right correspond to the BDCs. Blue triangles show the results for estimation and subsequent testing, while points show the results for double-testing.
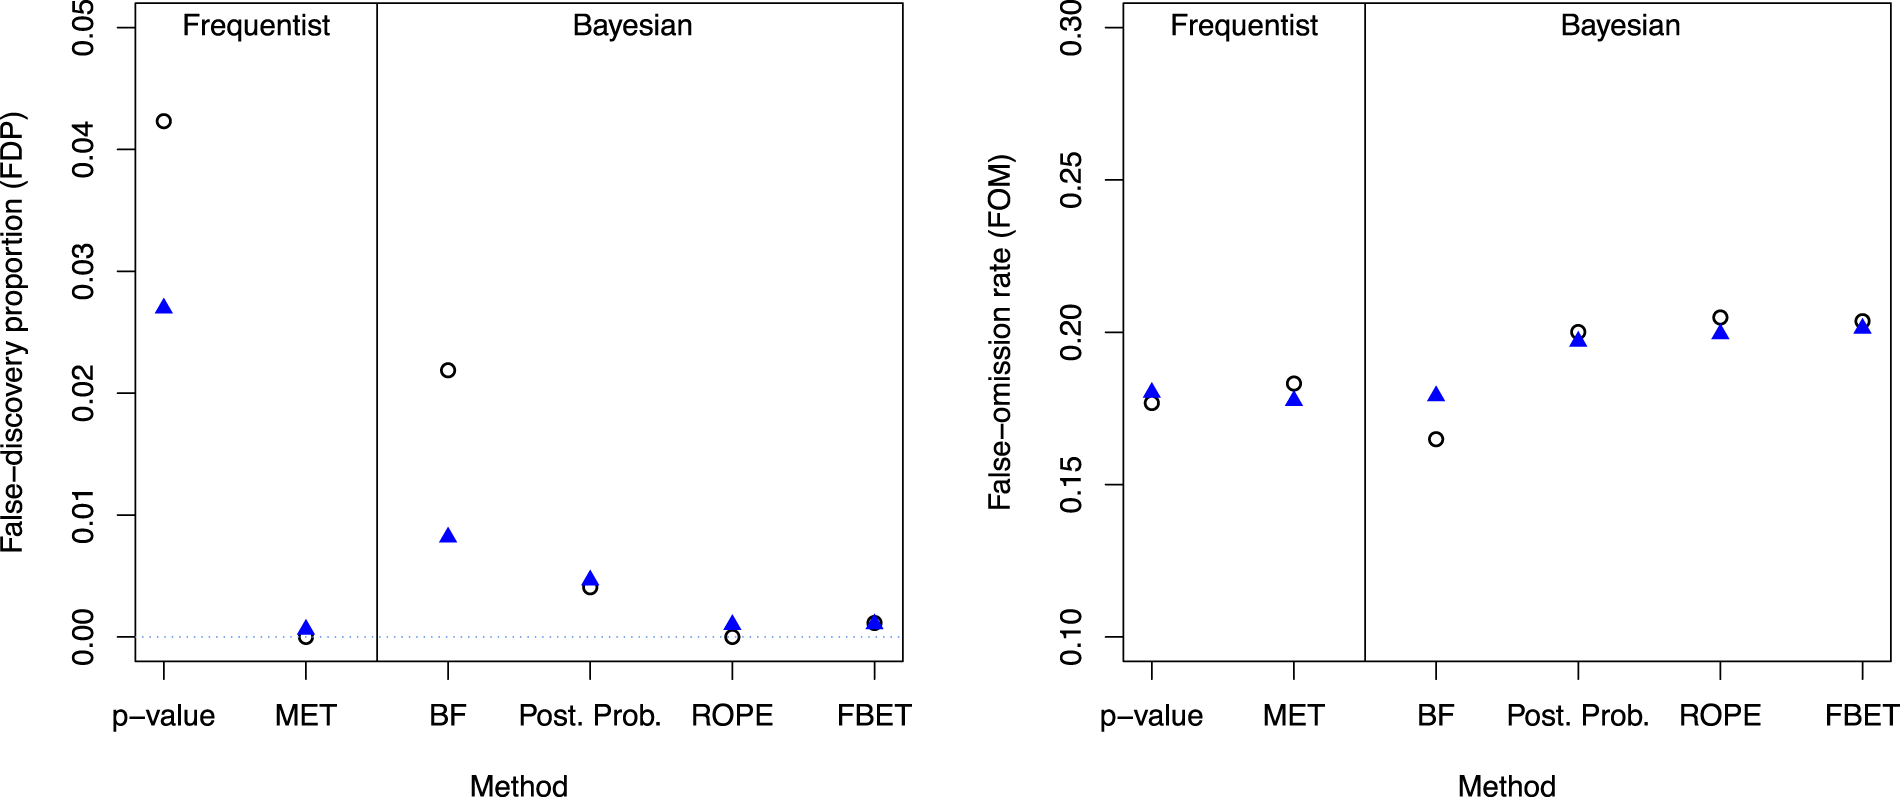
FDP (left) and FOM for the different methods; vertical black line separates frequentist from Bayesian trajectories, circles indicate the results for double-testing and triangles for estimation (95% CI or HPD) and testing.
First, all approaches lead to a FDP which is below 5%. However, there are substantial differences between the methods and the double-based testing trajectory which employs p-values yields the largest FDP of
Shifting to double-testing with the MET, the FDP vanishes entirely when a double-testing strategy is applied. Shifting to estimation and subsequent testing, the FDP increases to
For the Bayesian solutions, there are substantial differences between the methods. First, double-testing with the ROPE yields a FDP of zero, which is highly attractive. Figure 4 shows that the FBET follows with a FDP of
The right plot in Figure 4 shows that the differences in the FOM of the methods are less pronounced, and all methods yield a FOM which is approximately bounded by
With respect to the FOM, the best approach is however the double-testing-based BF pipeline.
The reason why most BDCs yields a PPV close to 1 is due to the meta-analytic prior elicited in Figure 1. The sceptical Cauchy prior shrinks effect sizes towards zero, and thus when an exploratory study and confirmatory study yield an effect larger than the SESOI, the effect has to be large enough to overcome the shrinkage of the Cauchy prior towards zero. Thus, when a positive result is found, the underlying effect is with near certainty existing and FDP
An important consideration is that reducing the FDP also implies that less effect sizes of moderate magnitude transition to a successful trajectory, compare Figure 4. For example, shifting from BF + BF to 95% HPD + BF reduces the FDP substantially—compare Table 1—but at the same time the number of effects which are in
Double-testing versus estimation and testing
The results in Figure 5 show that p-values and BFs yield much smaller FDPs when shifting to estimation and subsequent testing. All other approaches are influenced only slightly by this shift. Table 2 shows that the ROPE, the MET, and posterior probabilities even yield slightly increased FDRs when using estimation and testing compared to a double-testing strategy. As a consequence, it is recommended to use estimation and subsequent testing only when using p-values or interval BFs.
Simulation results for the PPV, NPV, FDP, and FOR of the different research pipelines and means and medians of the sample size
for the confirmatory study.
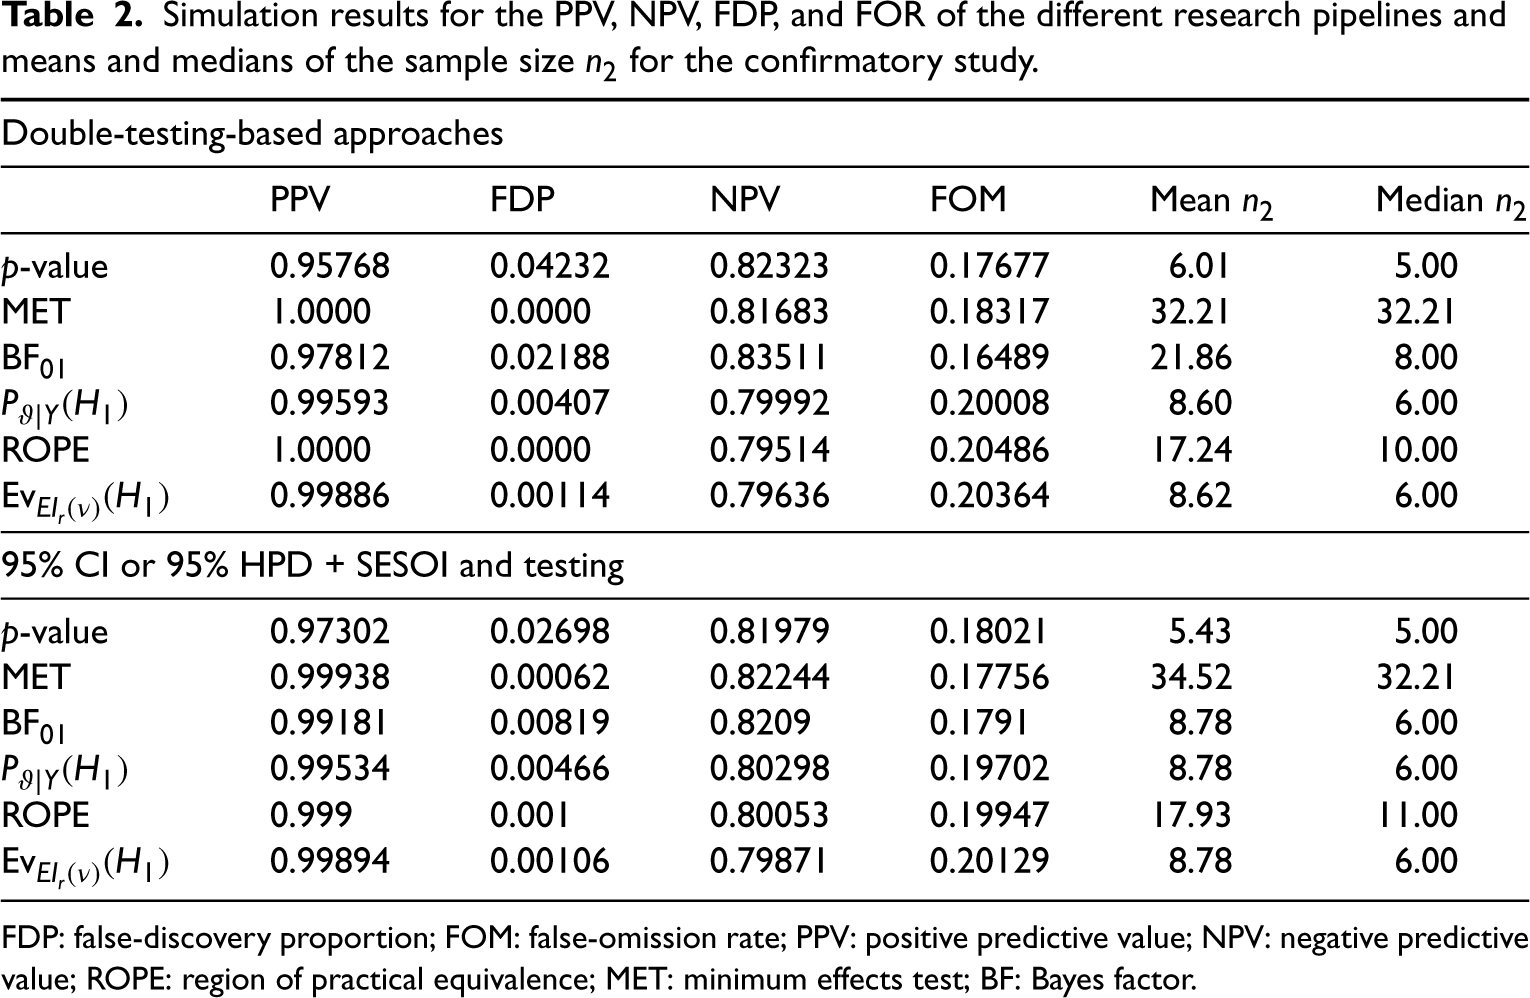
Simulation results for the PPV, NPV, FDP, and FOR of the different research pipelines and means and medians of the sample size
FDP: false-discovery proportion; FOM: false-omission rate; PPV: positive predictive value; NPV: negative predictive value; ROPE: region of practical equivalence; MET: minimum effects test; BF: Bayes factor.
Figure 6 also indicates that the required sample sizes for the replication study increase when using estimation and subsequent testing with the MET. The sample size is reduced only slightly for the p-value and is reduced substantially for interval BFs. The latter strengthens the argument to use estimation and testing solely for interval BFs and p-value-based research pipelines.
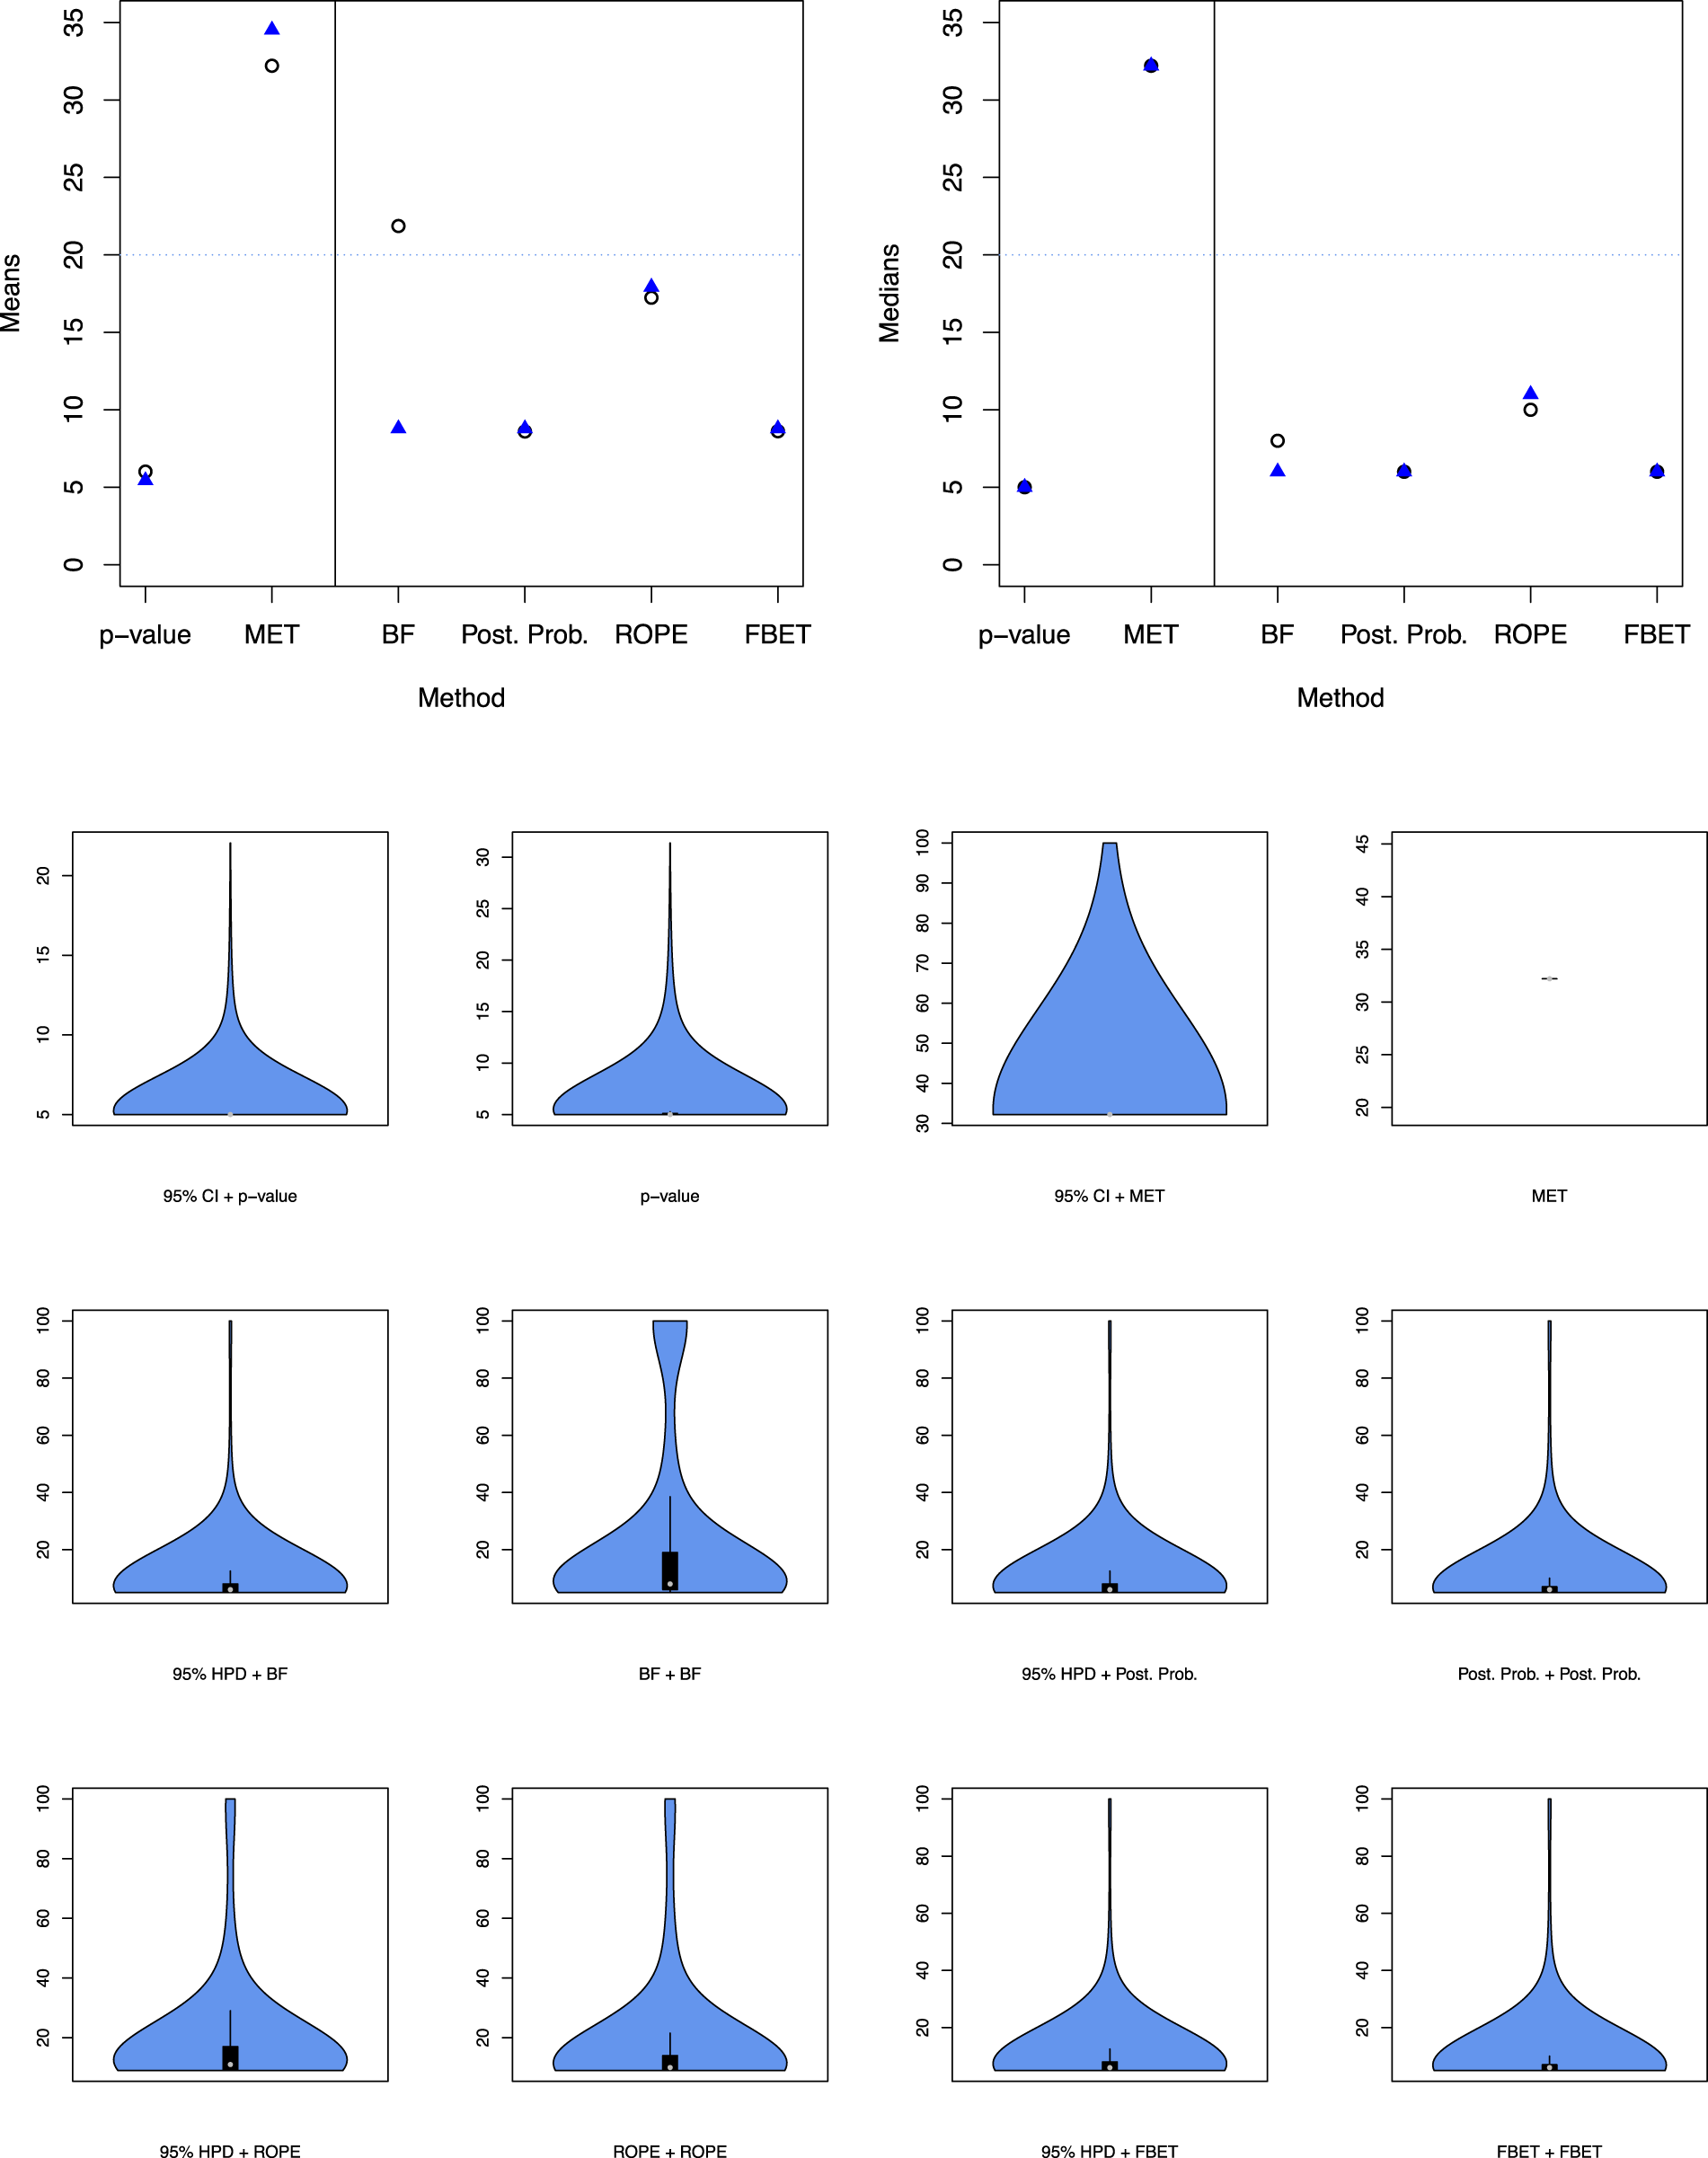
Mean (top left) and median (top right) of sample size
The results in Figure 5 and Table 2 show that shifting to estimation and subsequent testing substantially reduces the FDP when using p-values. Also, when shifting to the MET which incorporates the SESOI from the start, the FDP vanishes entirely. From a Bayesian perspective, the ROPE can reduce the FDP essentially to zero, and the FBET follows lead.
However, a decision which approach to use should incorporate further relevant quantities such as the required sample size
The top left and right plots in Figure 6 show the mean and median sample sizes
Results show that the MET requires the largest number of animals in a replication study. The top left plot shows that the number of animal units also decreases when shifting to 95% HPD + BF from BF + BF. Thus, estimation and subsequent testing is highly recommended for BFs. The same phenomenon holds for the medians, compare the top right plot in Figure 6.
The differences for the ROPE are less pronounced when comparing double testing and estimation plus testing, and the ROPE requires more animals than posterior probabilities, nearly twice as much, compare also Table 2.
The differences for the FBET and p-values are also less pronounced when comparing double testing and estimation plus subsequent testing. An important result is that 95% CI + p-values do require the smallest average number of animals, however. Still, Table 2 shows that the posterior probability-based testing or testing with the FBET requires on average
The bottom plot in Figure 6 shows the violin plots which visualize the distribution of replication study sample sizes
Discussion
From a frequentist perspective, a shift towards statistical approaches which explicitly incorporate the SESOI yields a smaller number of false-positive results than a purely null hypothesis-based approach via Welch’s two-sample t-test. This is reflected in the improvement of the FDP for the p-value-based research pipeline when shifting to 95% CI + subsequent testing. Shifting to the MET which explicitly aims at incorporating the SESOI from the start even yields a smaller FDP and increases the FOM only marginally. Results thus indicate that from a frequentist point of view, estimation and testing is superior to double testing for p-values. When using the MET, double-testing and estimation plus testing yield no substantial differences. However, a drawback of the MET is that the number of animals required for the replication study can be quite large, about 30 animals per group.
Shifting to Bayesian statistical decision criteria can also reduce the FDP substantially, in particular, when using the ROPE or FBET. However, the ROPE suffers from the same problem as the MET regarding the required number of animals for the replication study, although there only
When balancing the FDP, FOM ,and the number of required animals for the replication study, the FBET-based research pipelines yields the best performance. On average,
Also, compared with the frequentist research pipelines, the p-value-based pipeline yields on average only
Thus, we conclude with the following general recommendations:
From a frequentist perspective, when using p-values shifting to estimation and subsequent testing is strongly recommended. Shifting to the MET is only recommended if the number of experimental units is relatively easy to acquire. If ethical or economic concerns require smaller number of animals for a replication study, using 95% CI + subsequent testing with p-values is preferred over the MET. From a Bayesian perspective, 95% HPD estimation and subsequent testing with the FBET yields the best tradeoff in terms of FDP, FOR, and the number of animals required for the replication study. Thus, unless there are specific reasons to use a different approach this is the recommended default choice. Both the MET and ROPE are questionable from a purely ethical perspective because they require the largest number of animals.
Furthermore, two points should be noted: First, while the FBET, posterior probability and the ROPE are influenced little by shifting to estimation plus testing, the FDP of the BF is reduced. Thus, estimation and subsequent testing is explicitly recommended when using interval BFs.
Secondly, the performance of the FBET may be due to the selected reference function
A further important result is that all Bayesian approaches yield a smaller FDP than the p-value-based research pipeline, no matter whether double testing or estimation and subsequent testing is used, compare Figure 5.
Limitations of the results include uncertainty in the elicited Cauchy
Another limitation is that the thresholds for the BDCs were selected ad hoc, but simulation results show that these yield reasonable operating characteristics such as FDP smaller than 5% and FOM smaller than 25% . Also, we did not address the task of designing a research pipeline with prespecified boundaries on certain operating characteristics, which could be tackled in future research.
Other reverse-Bayes methods
There are multiple venues to extend the current results, for example, by explicitly considering replication measures such as reverse-Bayes methods. 12 The latter include, for example, the sceptical p-value, 57 replication BF, 38 and other measures.24,34,12 However, these reverse-Bayes methods are even more specialized than the BDCs investigated in this article, and corresponding frequentist methods such as the dual-criterion design proposed by Rosenkranz 27 then would constitute reasonable competitors to judge replication success. Most of these approaches also require further modeling assumptions and sample size calculations for replication studies are a topic of ongoing research. 58
Adaptive designs
An important aspect raised by one reviewer is the fact that the naive combination of two studies might fit a sample size planning approach such as the normal-normal model, but an adaptive design might be more appropriate in practice. Thus, shifting towards an adaptive design might be a more realistic option than to opt for an approach which conducts a confirmatory replication study in case the exploratory study was successful.
A further possibility for future research is thus to explicitly consider adaptive designs such as group-sequential trial designs which allow to stop a trial early for futility or efficacy. The benefit of these approaches for preclinical animal research has recently been demonstrated by Neumann et al., 21 compare also Majid et al. 20
Regarding the choice of the SESOI
Second, the power of 50% is underpowered from a purely statistical point of view. However, the number of animals used in preclinical research is often small to moderate and here the goal was to mirror current research practices which are often not optimal.34,21 Future research could shift to more conservative power calculations of 80% in the replication study, and investigate how results differ. This approach could be more in line with acknowledging the ethical constraints of animal trials.
Summary
In summary, using estimation with the 95% HPD and subsequent testing with the FBET obtains an appealing overall performance according to Table 2. The average total number of required animals for both the original and replication is below
Other Bayesian approaches such as posterior probabilities or the ROPE fare similar but require either more animals or yield slightly larger FDPs. From a frequentist perspective, using estimation and subsequent testing is superior for p-value-based research pipelines. Shifting to the MET is feasible only when a large number of animals in the replication study are attainable and ethically defendable.
Thus, shifting to (Bayesian) SESOI-based approaches can reduce the false discovery rate of preclinical animal research while keeping the number of experimental units required for a confirmatory study at a moderate level. While more research is needed in this direction, the result provided in this article should motivate researchers to consider SESOI-based approaches—in particular, BDCs—more explicitly in preclinical animal research.
Supplemental Material
sj-pdf-1-smm-10.1177_09622802231184636 - Supplemental material for Reducing the false discovery rate of preclinical animal research with Bayesian statistical decision criteria
Supplemental material, sj-pdf-1-smm-10.1177_09622802231184636 for Reducing the false discovery rate of preclinical animal research with Bayesian statistical decision criteria by Riko Kelter in Statistical Methods in Medical Research
Footnotes
Declaration of conflicting interests
The author(s) declared no potential conflicts of interest with respect to the research, authorship, and/or publication of this article.
Funding
The author(s) received no financial support for the research, authorship and/or publication of this article.
Supplemental material
Supplemental materials for this article are available online.
Notes
References
Supplementary Material
Please find the following supplemental material available below.
For Open Access articles published under a Creative Commons License, all supplemental material carries the same license as the article it is associated with.
For non-Open Access articles published, all supplemental material carries a non-exclusive license, and permission requests for re-use of supplemental material or any part of supplemental material shall be sent directly to the copyright owner as specified in the copyright notice associated with the article.