
Abstract
Screening mammography is the primary preventive strategy for early detection of breast cancer and an essential input to breast cancer risk prediction and application of prevention/risk management guidelines. Identifying regions of interest within mammogram images that are associated with 5- or 10-year breast cancer risk is therefore clinically meaningful. The problem is complicated by the irregular boundary issue posed by the semi-circular domain of the breast area within mammograms. Accommodating the irregular domain is especially crucial when identifying regions of interest, as the true signal comes only from the semi-circular domain of the breast region, and noise elsewhere. We address these challenges by introducing a proportional hazards model with imaging predictors characterized by bivariate splines over triangulation. The model sparsity is enforced with the group lasso penalty function. We apply the proposed method to the motivating Joanne Knight Breast Health Cohort to illustrate important risk patterns and show that the proposed method is able to achieve higher discriminatory performance.
Introduction
Breast cancer (BC) is the leading cancer diagnosis among women worldwide, accounting for 1 in 4 cancers diagnosed in women, with more than 2.1 million new cases identified each year.
1
Mammography is currently the primary BC screening strategy. Guidelines recommend screening mammography from the age of 45 or 50 in the US. Making full use of mammogram images is key for risk stratification to implement risk reduction strategies in BC prevention. In this particular setting, a predictive model approach, where mammogram images serve as predictors in predicting the onset of BC over 5 or 10 years (survival-valued response variable) is well-suited to exploit the dependencies between spatial regions and BC risk. The personalized predictions on the future BC risk bring potential clinical utility as demonstrated by current guidelines based on 5- and 10-year risk.
2
However, prediction with imaging data is challenging due to the high dimensionality of the observation space (
Regression models incorporating high-dimensional imaging predictors have been extensively studied in the literature. Zipunnikov et al. 3 explored a connection between the singular value decomposition and functional principal component analysis (FPCA) for analyzing brain images by transferring images to a long vector. Other approaches for functional or smooth principal component analysis for tensor data have been proposed; see Huang et al., 4 Allen, 5 and Lin et al. 6 for example. Reiss and Ogden 7 developed a class of generalized scalar-on-image regression models. Wang et al. 8 considered the scalar-on-image regression model via total variation. Bayesian approaches using spatial priors have also been developed; see Huang et al. 9 and Guo et al. 10 for example.
Despite the rich literature on incorporating imaging data as a predictor, most approaches that use the whole image without pre-specifying summary-level features are based on the assumption that the image is bounded within a rectangular domain. The breast area within mammogram images, however, is bounded within a semi-circular region. For imaging data bounded in a complex domain, many conventional smoothing methods in the literature, such as tensor product, kernel, and wavelet smoothing, all suffer from the problem of boundary leakage. 11 Boundary leakage causes the erroneous selection of background information because sharp changes from the image to the background will dominate the information conveyed from the image; see Ramsay 12 for a few of such examples. Accommodating the irregular boundary is especially crucial when our interest lies in identifying regions of interest (ROIs) for future risk within mammogram images, as the true signal comes only from the semi-circular domain of the breast region, and noise elsewhere.
With the prior belief that a few ROIs are “important” to predict abnormalities or evolving premalignant tissue proliferation within the breast that will more accurately classify risk, we are interested in spatial location selection to identify a few important locations and perform risk stratification based on the selected locations. We aim to encourage ROI selection in a contiguous manner to enable structured and interpretable solutions for potential implementation in the clinical setting. In this paper, we show how the bivariate smooth piecewise polynomial function over triangulations13,14 can be used to accommodate the irregular domain in the mammogram imaging data. We show how the ROI selection over triangulation can be incorporated into a predictive model. In a translational context for BC, this would mean that the focus can be shifted to the selected ROI to investigate biology and evolution of tissue to cancer over time as recently applied in the NCI Precancer Atlas. 15
The main contributions of this article are as follows. First, we propose a unified framework incorporating group-wise lasso penalty to identify ROIs within mammogram imaging data that are predictive to 5-year BC risk. Second, we incorporate the bivariate spline basis functions defined on triangulations to capture the variations and connections among values at different locations for mammograms bounded in an irregular domain. Third, we apply the proposed framework to the Joanne Knight Breast Health Cohort at Siteman Center to illustrate important risk patterns and show that we can achieve higher prediction accuracy than benchmark models.
This paper is organized as follows. In Section 2, we define notation and discuss the bivariate spline basis approximation over triangulation to overcome the irregular boundary issue. We show that the spatial location selection over triangulation can be done with the penalized regression with a group-wise penalty. In Section 3, we investigate the finite sample performance of the proposed method via intensive simulation studies. The proposed method is then applied to the motivating Joanne Knight Breast Health Cohort at Siteman Cancer Center in Section 4 to leverage new insights. We conclude the paper with a discussion and future remarks in Section 5.
Model and estimation method
A Cox proportional hazards model with the imaging predictor
Suppose there are
For the imaging predictors, we let

Because the mammogram images are observed on a semi-circular region with an irregular boundary, we approximate the imaging data by the bivariate spline that are piecewise polynomial functions over a two-dimensional triangulated domain.
14
We first define some notations as follows. Let
The triangulation grid with 115 triangles.
We adopt the Bernstein polynomial basis function. For an arbitrary point
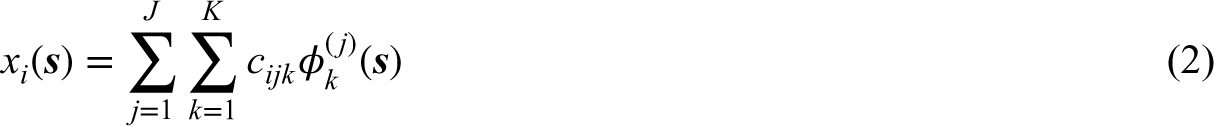
The imaging predictor
In addition to the imaging data, we assume that there are some non-functional demographic variables


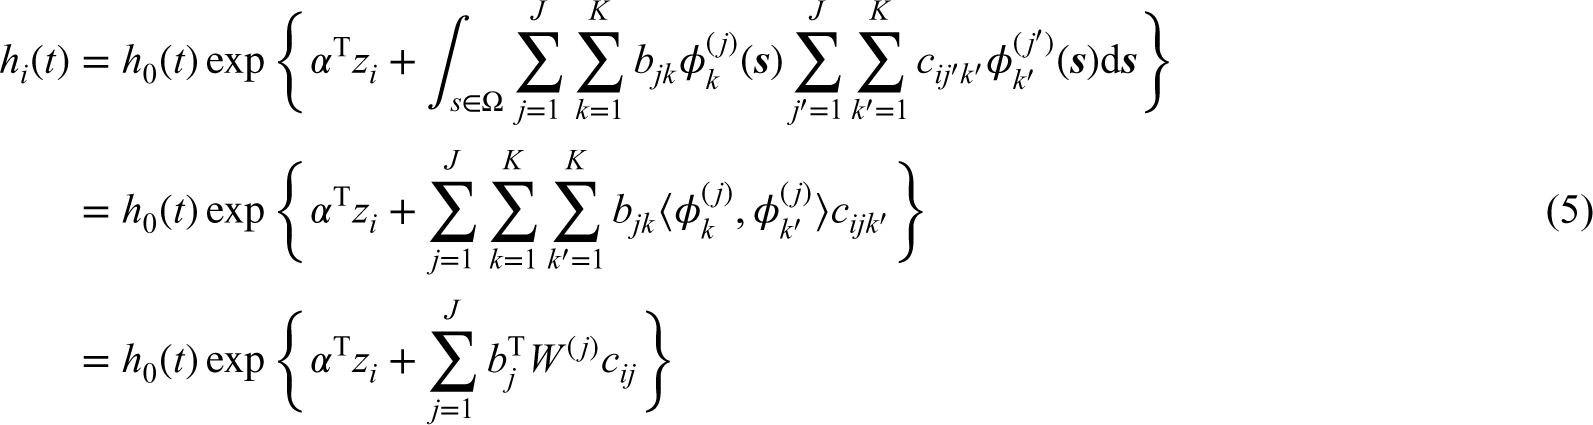
In matrix notation, we can rewrite (5) as

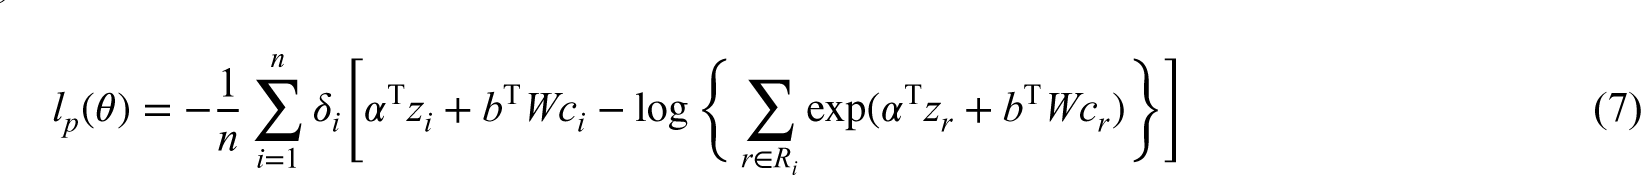
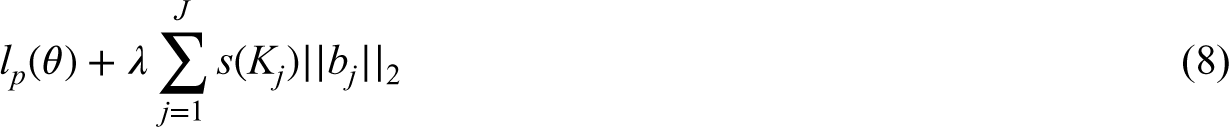
We consider the vector of
We investigate the finite sample performance of the proposed method in this simulation study. The measurements on the images are simulated as follows:

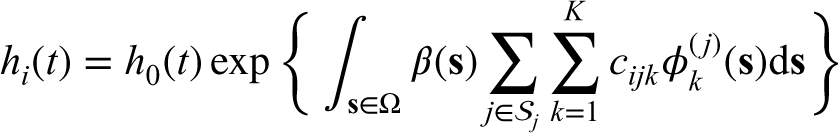
To generate the survival outcome, we consider the following proportional hazards model:
The number of selected triangles
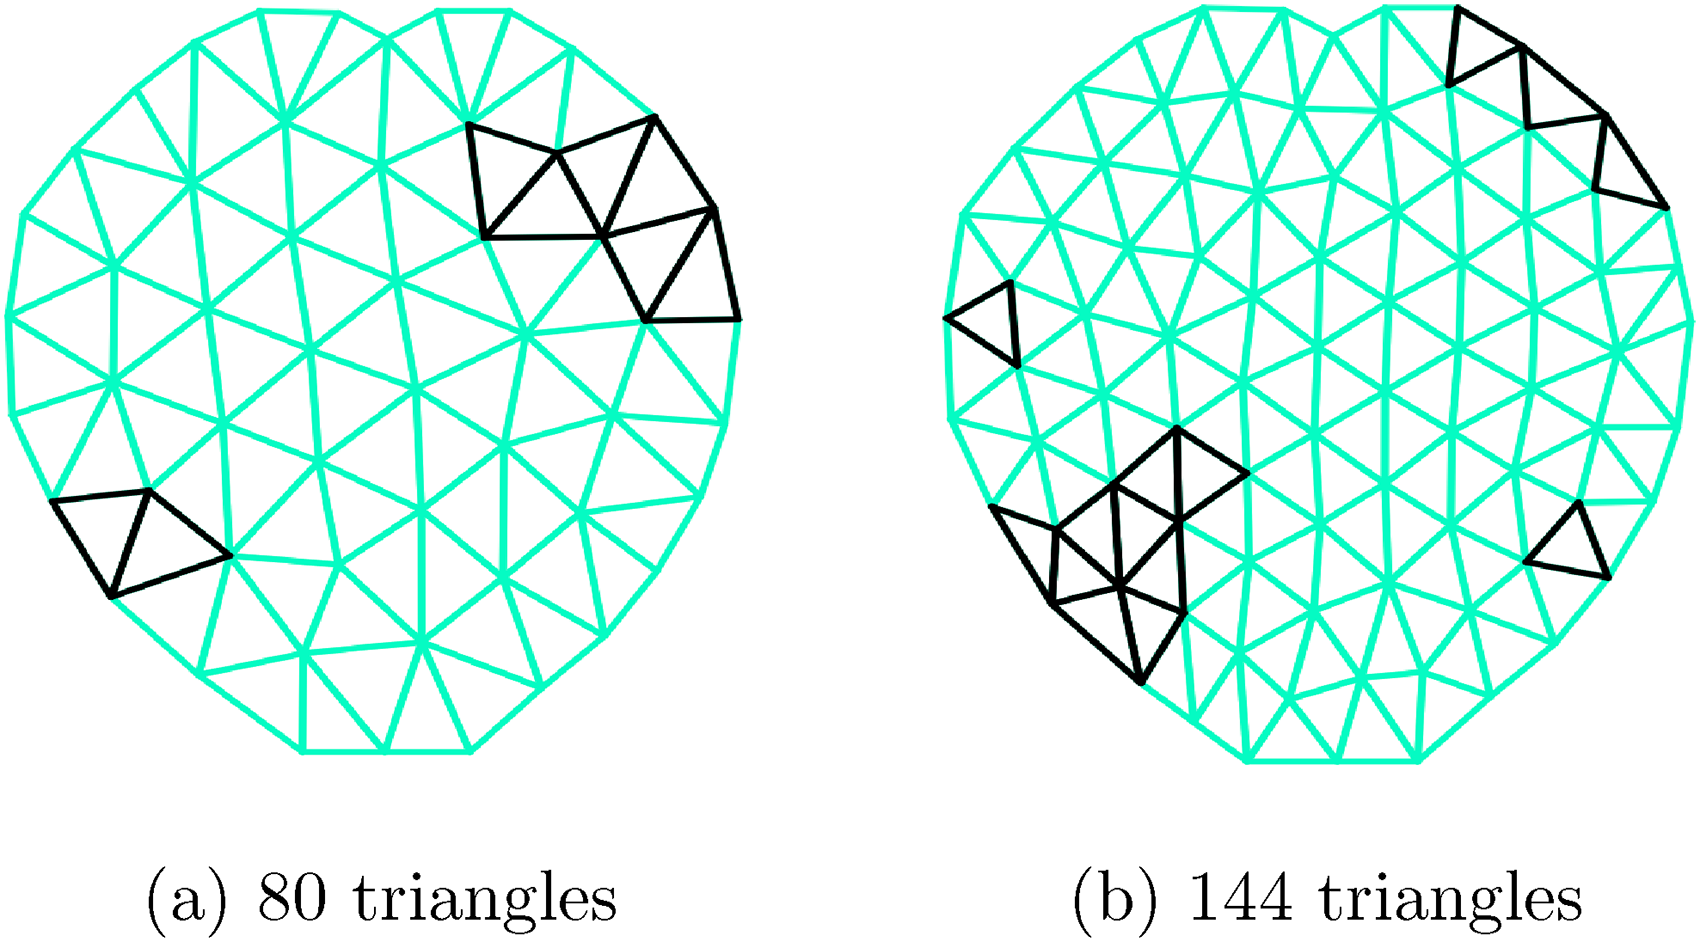
Illustration of the triangulation grid used for the simulation study with irregular boundary; triangles colored in black are the ones that are selected to be predictive of the hazard function. This triangulation plot is created using the
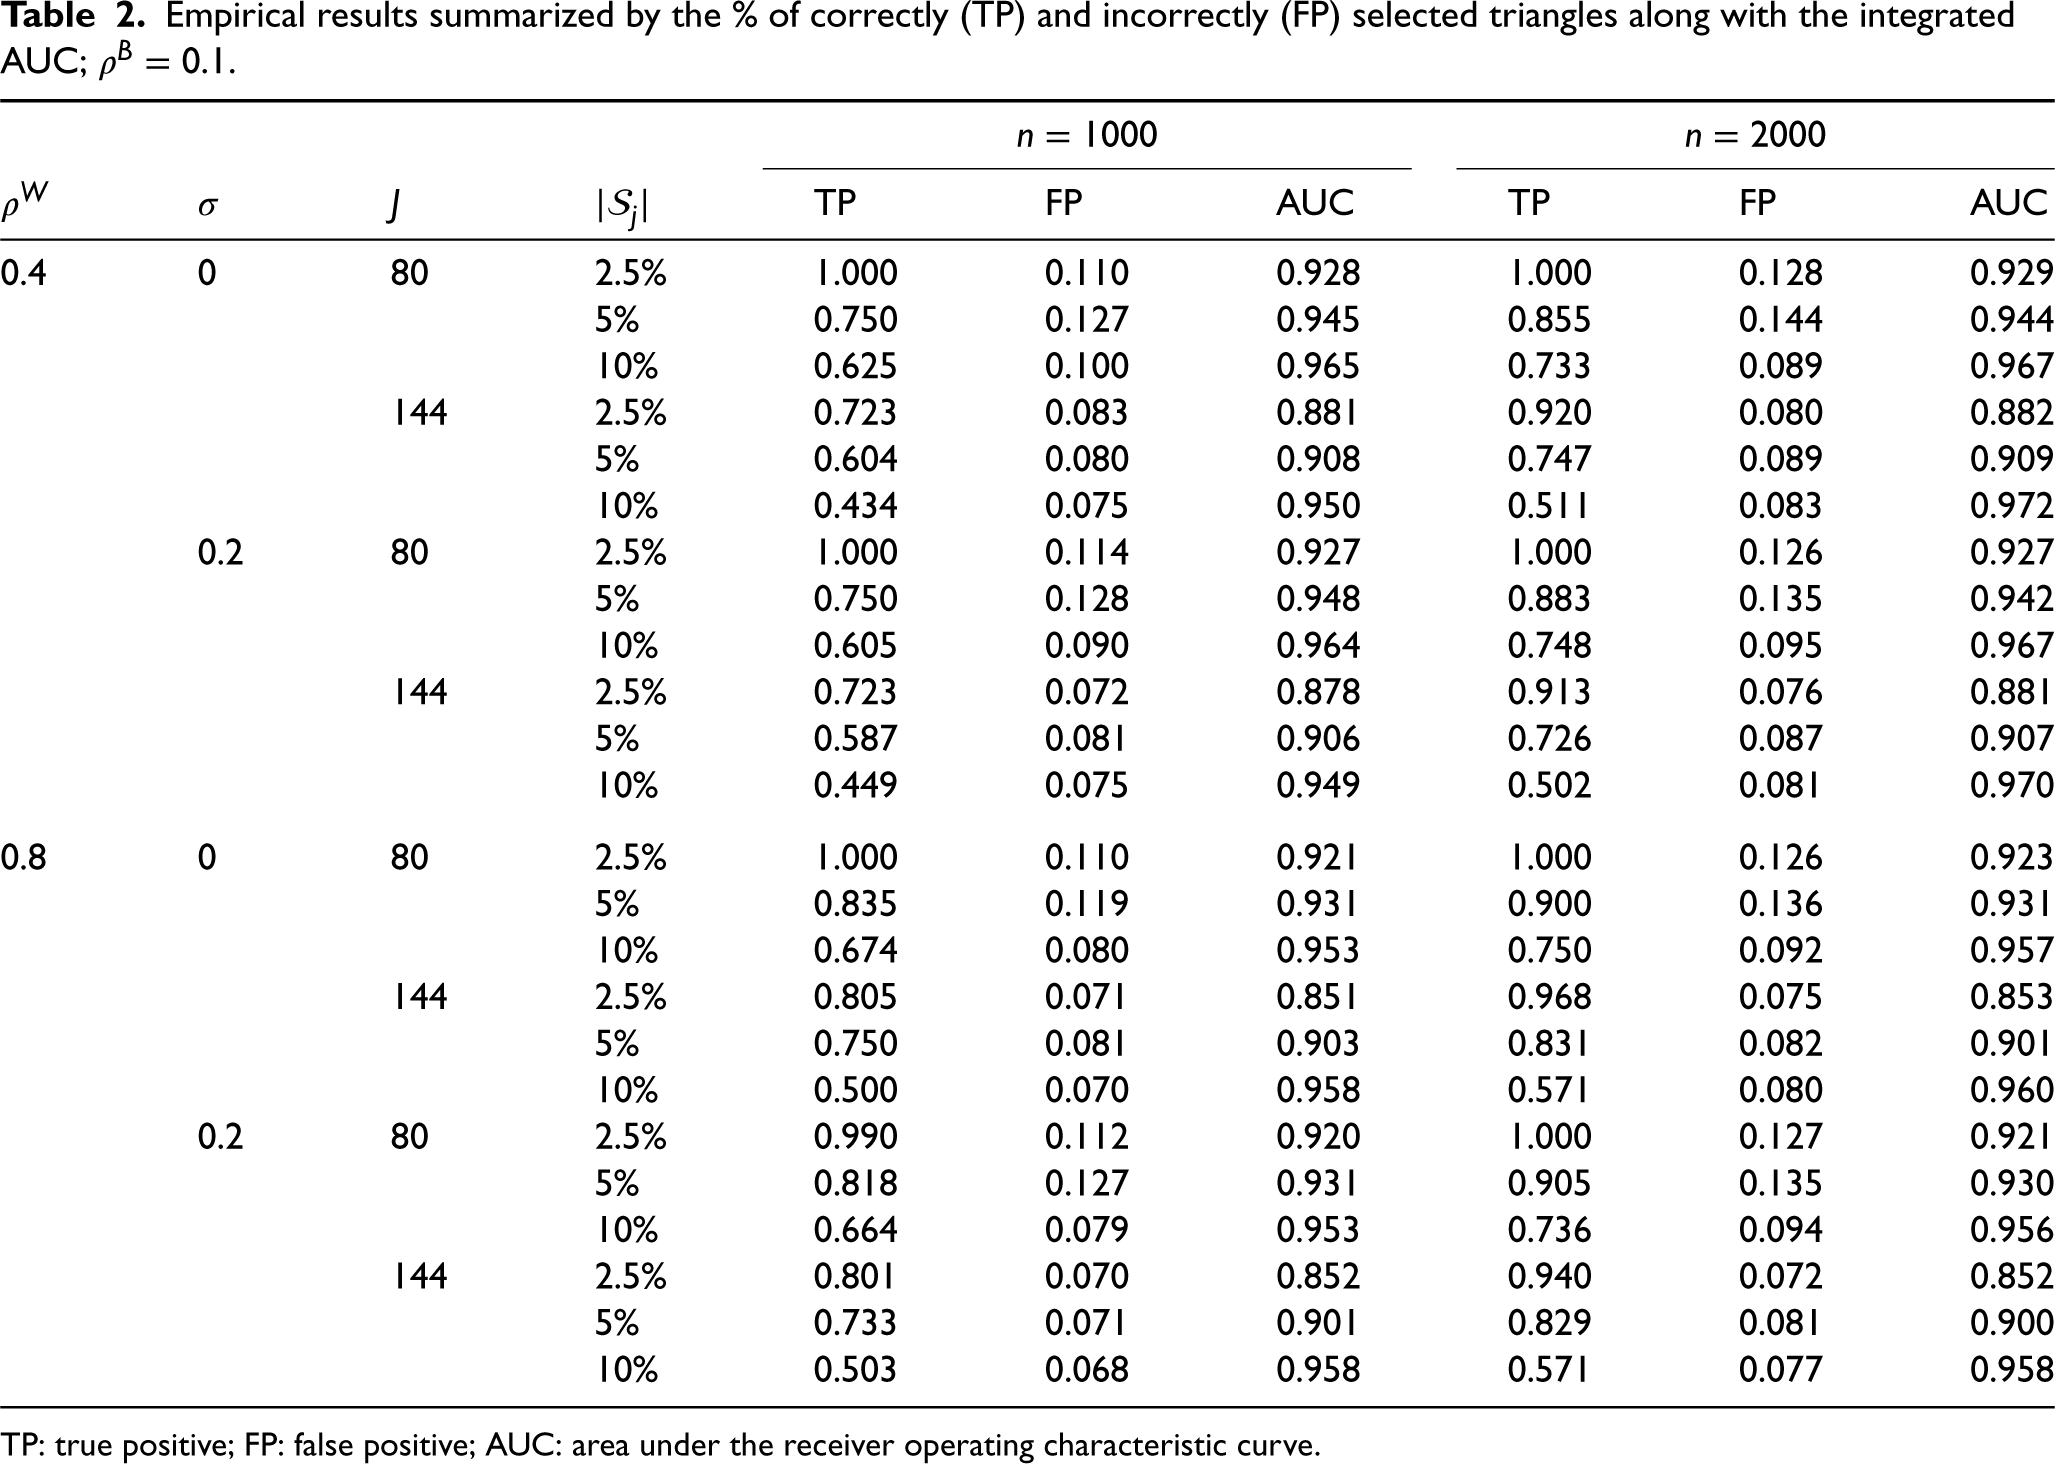
We show the simulation results in Tables 1 and 2. For each setting, we have simulated 100 datasets with
From Tables 1 and 2, we can observe a decreasing trend in the TP rate with an increase in
Empirical results summarized by the % of correctly (TP) and incorrectly (FP) selected triangles along with the integrated AUC;
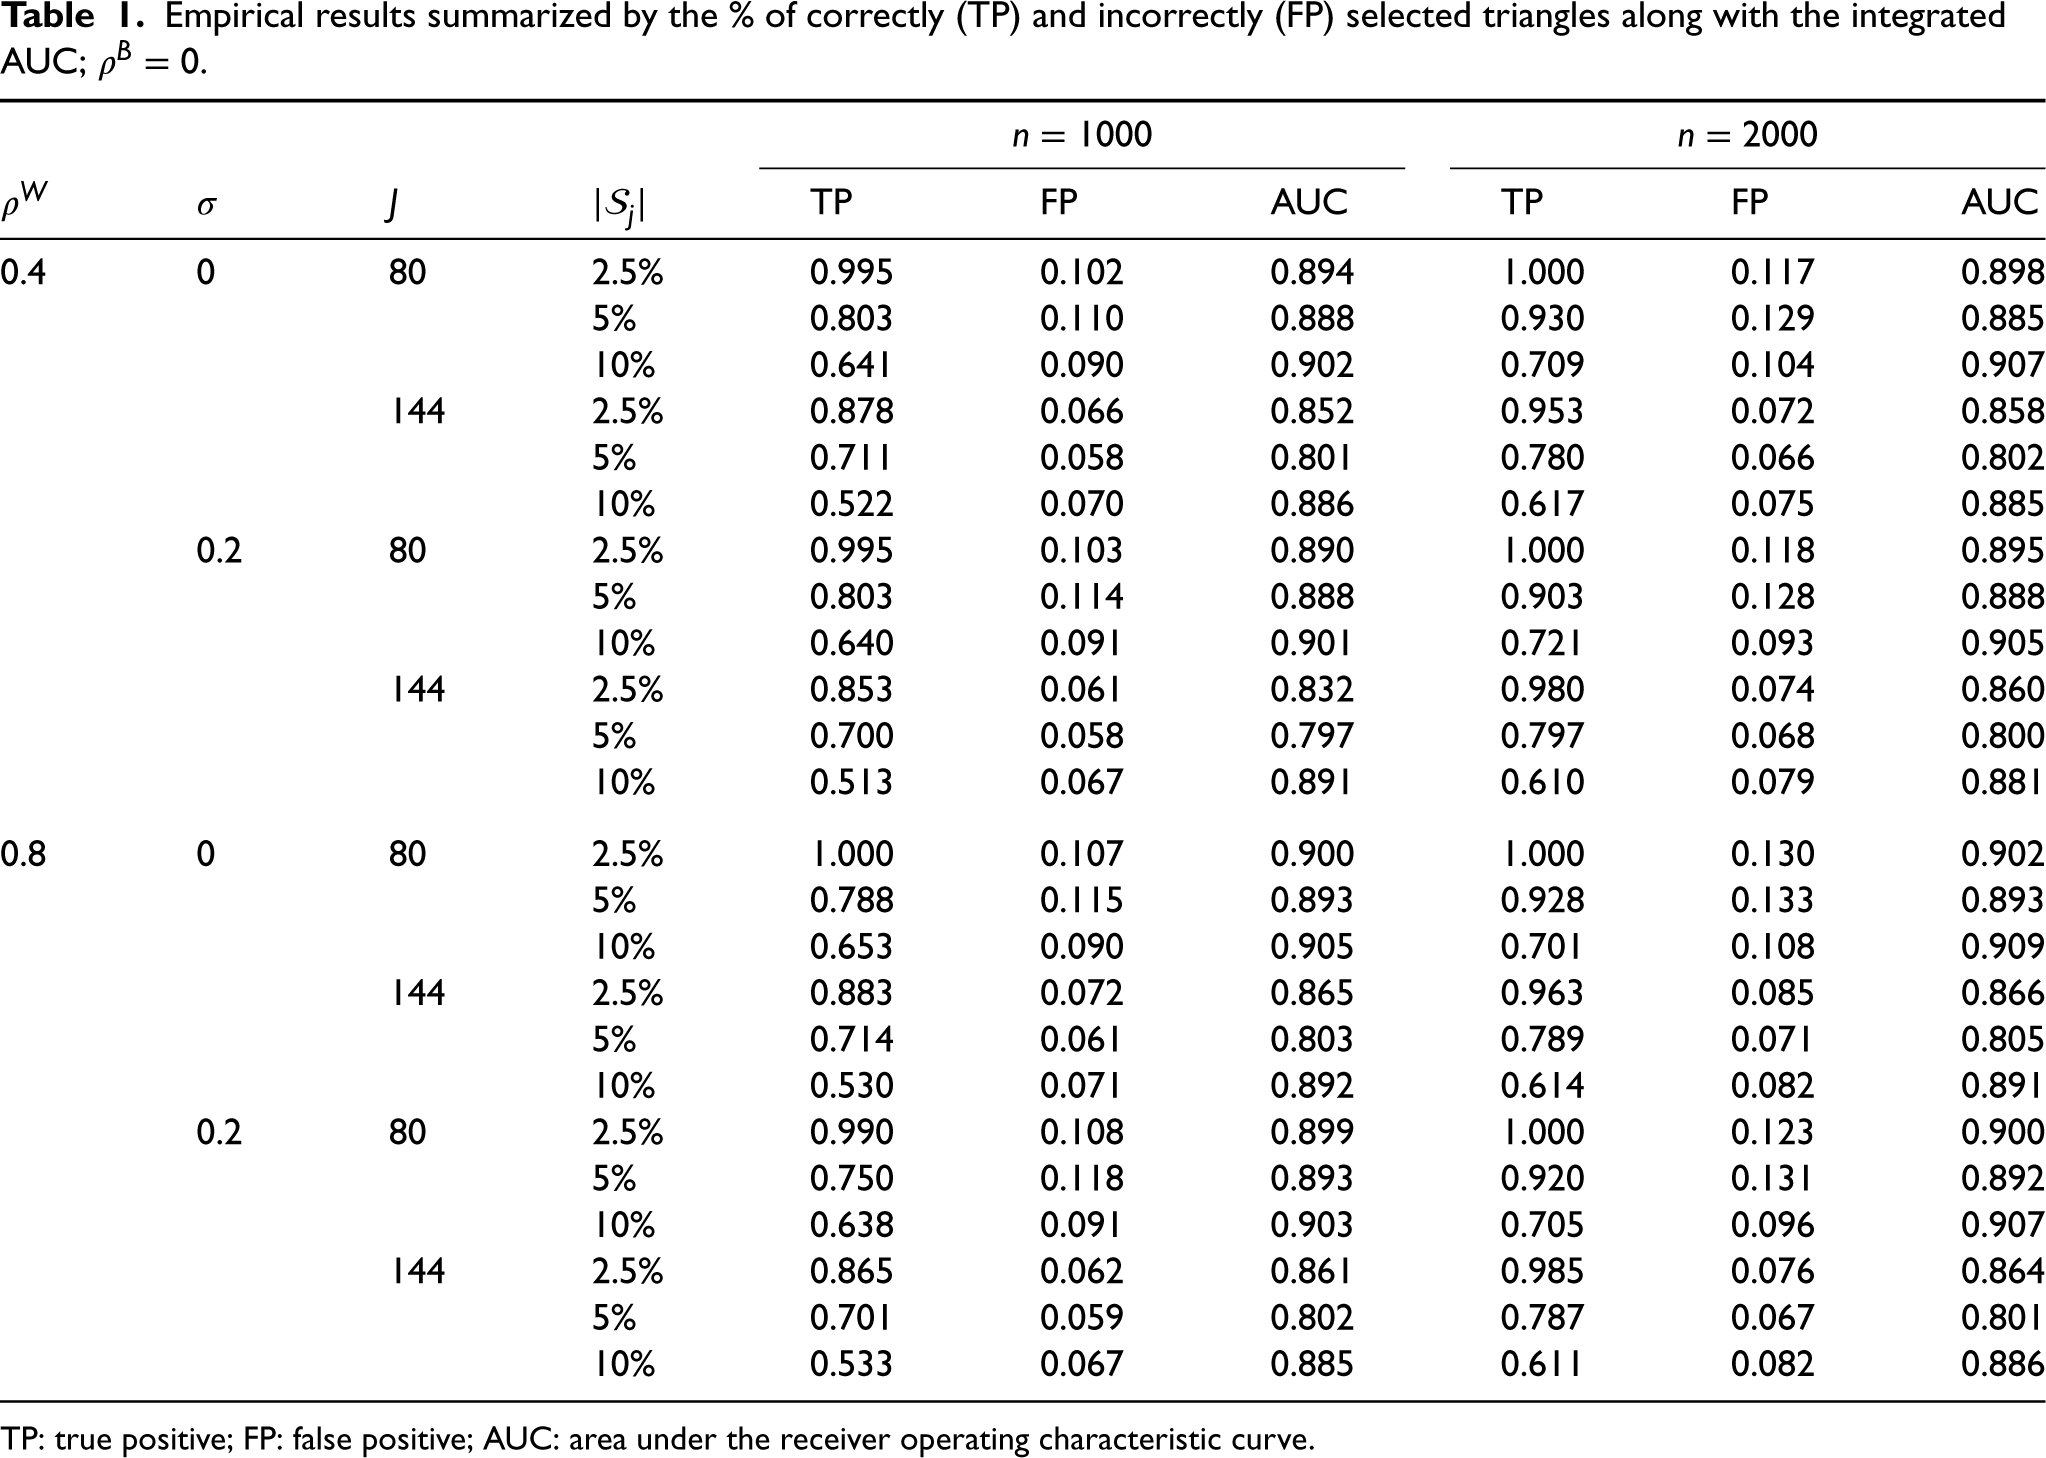
TP: true positive; FP: false positive; AUC: area under the receiver operating characteristic curve.
Empirical results summarized by the % of correctly (TP) and incorrectly (FP) selected triangles along with the integrated AUC;
TP: true positive; FP: false positive; AUC: area under the receiver operating characteristic curve.
Software in the form of
This study is motivated by the Joanne Knight Breast Health Cohort at Siteman Cancer Center. The cohort was established to link BC risk factors, mammographic breast density, and blood markers for women from varying socioeconomic and racial backgrounds in the St. Louis region undergoing routine mammographic screening. Women were recruited from November 2008 to April 2012, and have been followed through October 2020. We treat the conversion from baseline (BC free) to the onset of BC as the time-to-event outcome and focus on 785 women within the nested case-control cohort at the baseline. We have excluded women who have been diagnosed with BC within the first 6 months of entry to the cohort and those without a valid craniocaudal view mammogram. Of those who were included in the study, 246 have been diagnosed with BC prior to the end of follow-up. The set of mammogram images was pre-processed prior to any analytical procedures to ensure that the breast area on the mammogram is approximately aligned across a woman in the cohort; see Jiang et al.,24,25 for more details on the registration procedure. The pixel intensities between the two mammograms within a woman (left and right) are then averaged in a similar fashion for breast density which is well accepted in the BC literature. 26
In this analysis, we consider a proportional hazards function with the demographic variables
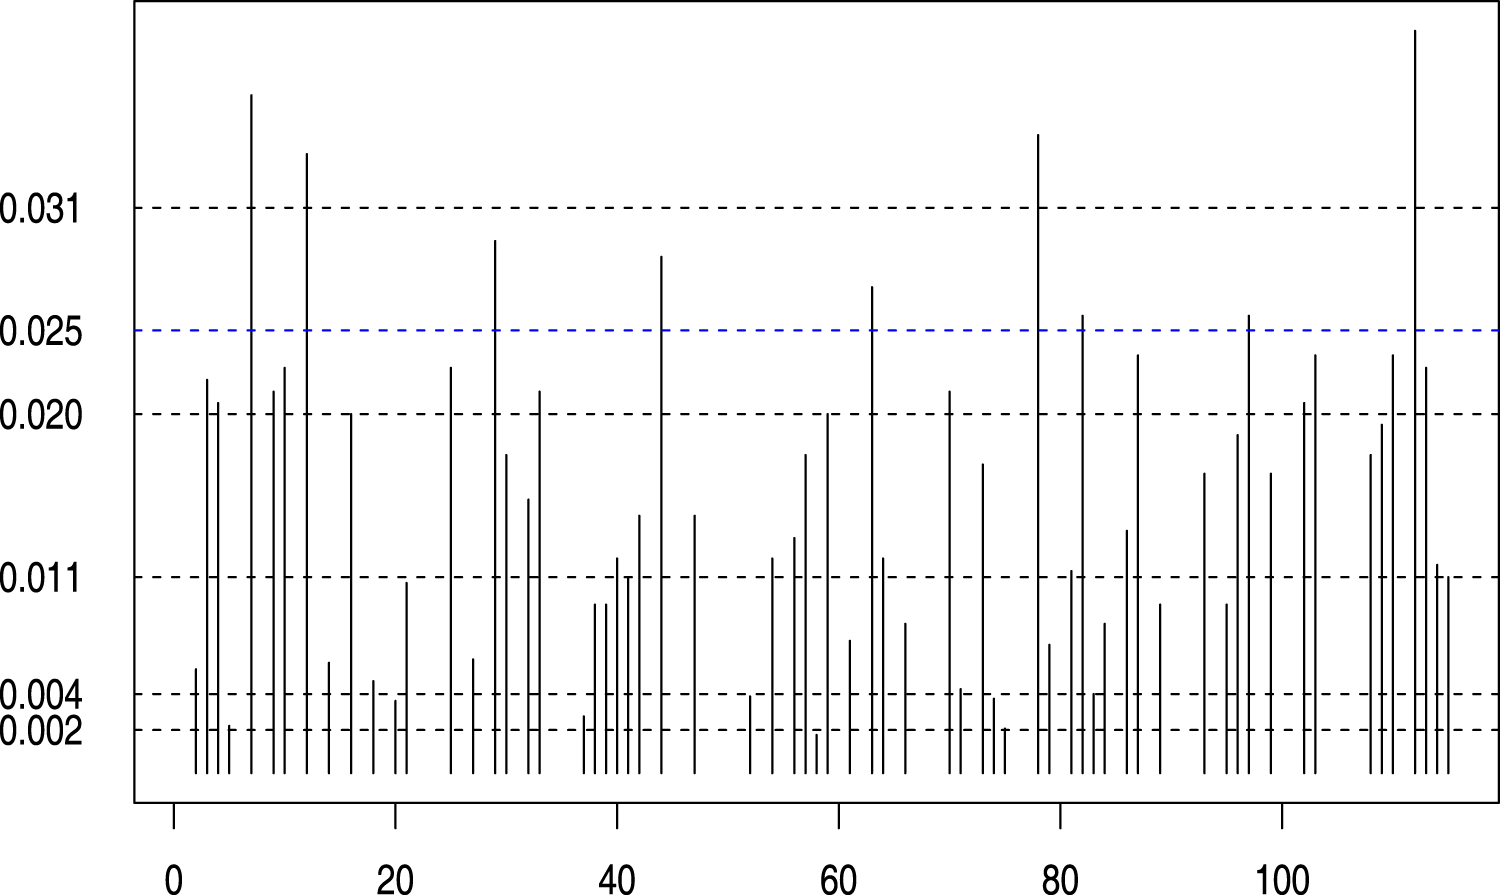
The selected spatial locations (115 triangles) at different penalty
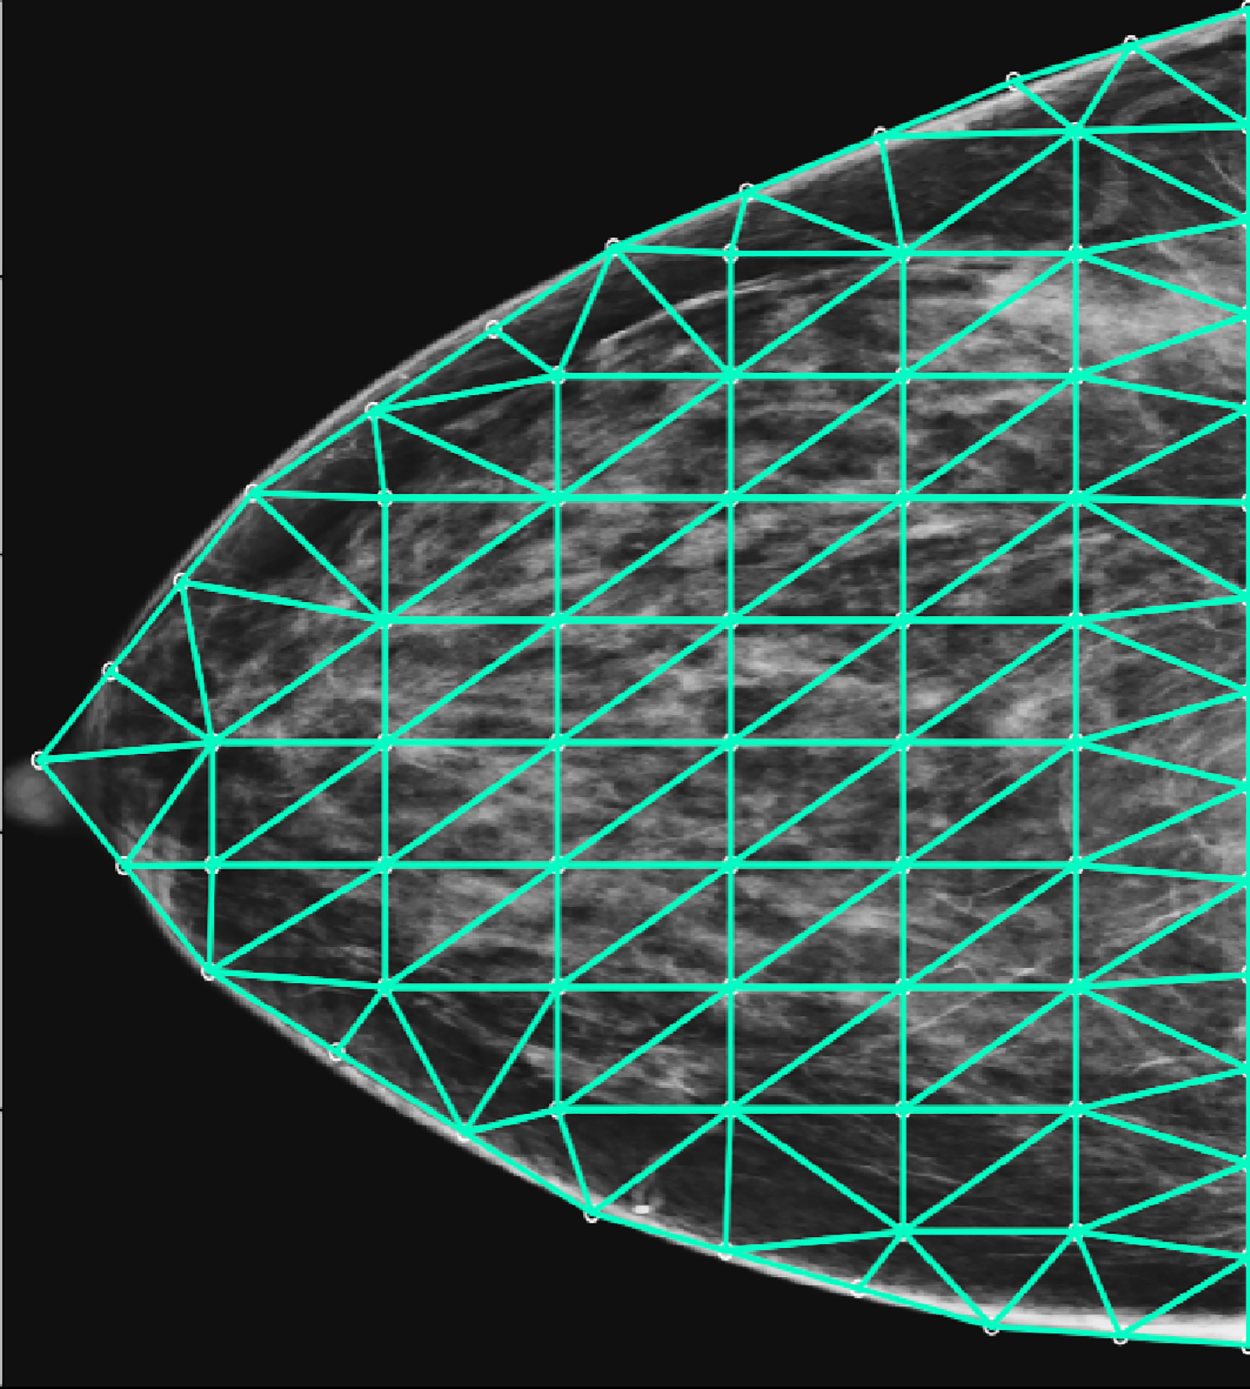
The optimal penalty value as a function of a 5-fold cross-validation using the CVPL criteria is shown in Figure 3 with the blue horizontal dotted line. As a result, all spatial locations that exceed the blue dotted line were selected in this study. We further illustrate these specific locations mapped onto the original mammogram in Figure 4. Additionally, we have conducted a 10-fold internal cross-validation to avoid over-optimism of the prediction performance in estimating the 5-year BC risk. The prediction performance is assessed using the integrated AUC. Figure 5 shows the estimated AUC averaged over the 10-fold cross-validation as a function of different penalty values. Of note, the blue vertical dotted line in Figure 5 is in correspondence with the optimal
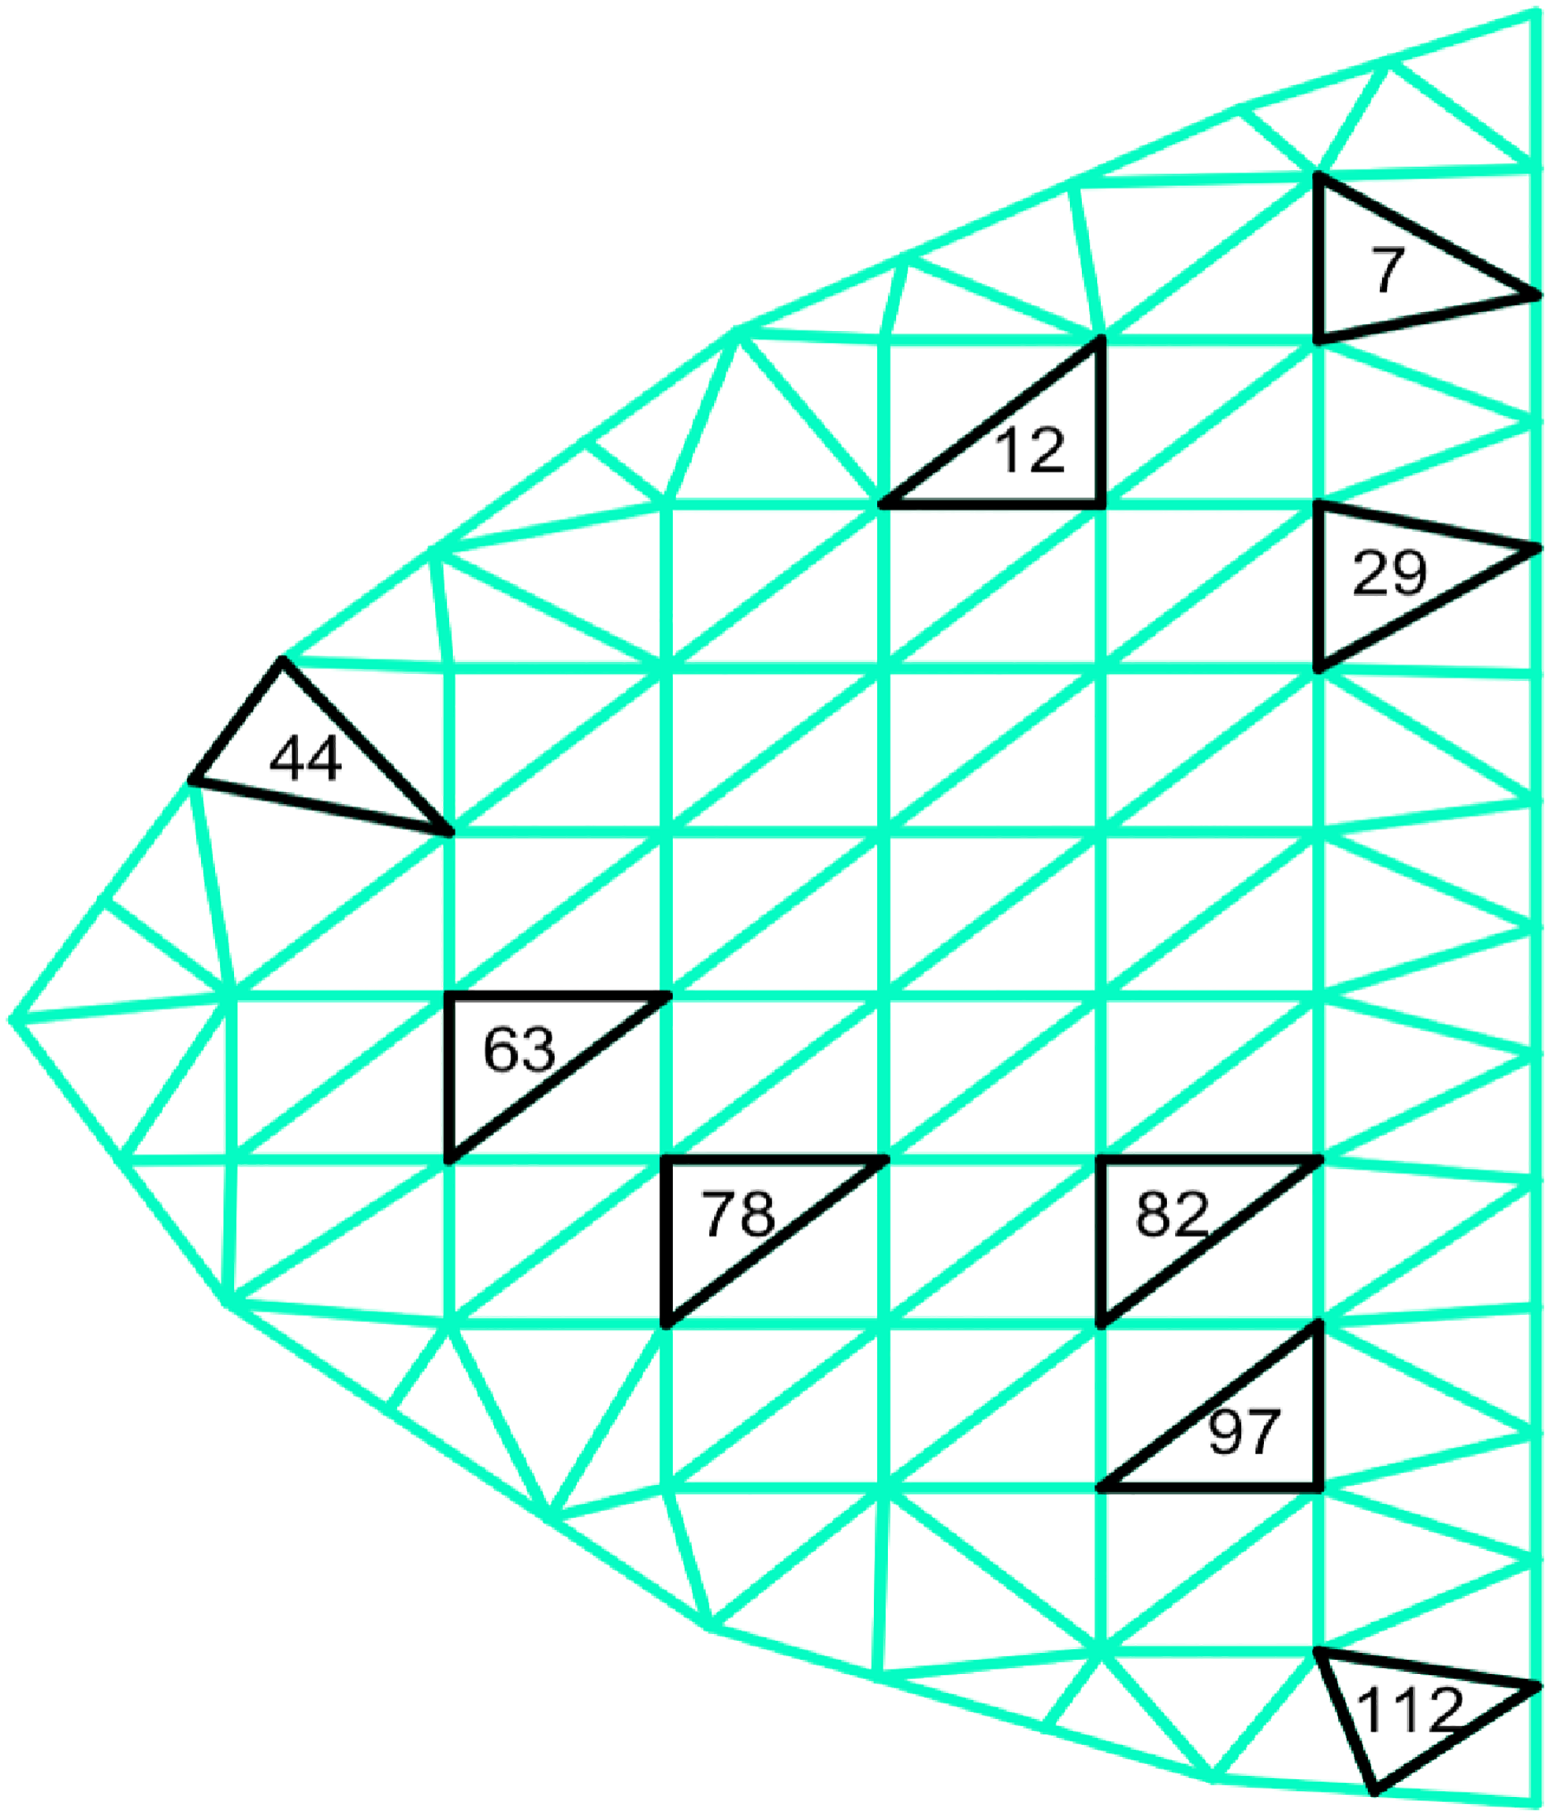
The selected locations with the tuned penalty value mapped onto the mammogram image.
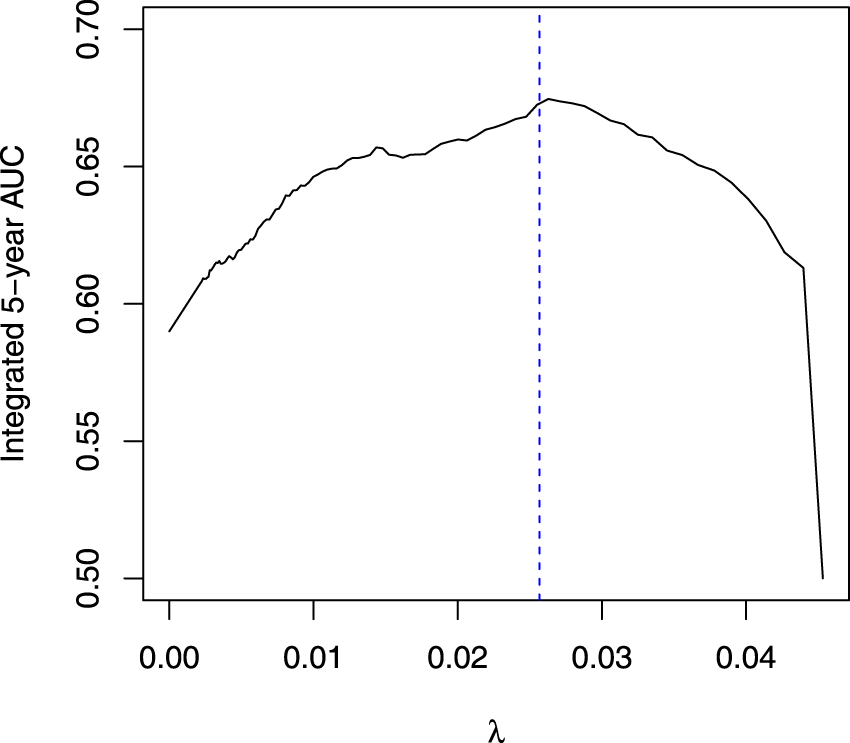
The average 5-year integrated AUC across the 10-fold cross-validation at different penalty values; the blue dashed line represents the selected optimal value using the CVPL criteria. AUC: area under the receiver operating characteristic curve; CVPL: cross-validated partial likelihood.
Additional sensitivity analysis with decreasing (87) and increasing (150) number of triangles instead of the presented 115 are shown in the supplementary document for interested readers. The locations selected with 87 and 150 triangles are similar to what we observe in Figure 4. The average AUC value was superior for the setting with 115 triangles, thus, we present the results under the current setting. Finally, we would like to comment on the promising computational time for the proposed analysis. The entire estimation, applied to our cohort dataset, took approximately 30 min on a standard laptop (2.9 GHz, 16 GB RAM) without parallel computing.
In this article, we proposed a modeling framework for incorporating mammogram images bounded in an irregular domain. Based on this framework, a partial data log-likelihood based on the proportional hazards model with group lasso penalty is formulated to (1) enforce sparsity and identify ROIs that are associated with the survival outcome; and (2) predict the 5-year risk of BC. The finite sample performance of the proposed method has been evaluated from intensive simulation studies. We have applied the proposed framework to the motivating dataset from the Joanne Knight Breast Health Cohort at Siteman Cancer Center. We have identified ROI within mammograms that are associated with 5-year BC risk. This is particularly meaningful in practice, as the focus could potentially be shifted to the selected ROI to investigate the biology and evolution of tissue to BC over time. The importance of these ROIs has been illustrated with the barplot. Finally, the prediction performance is superior with the optimal penalty parameter tuned from a nested cross-validation as compared to without including any penalty at all. Although our method is motivated by the mammogram imaging data, it can be naturally applied in other settings, such as brain image and lung computed tomography, where they are also bounded within an irregular domain.
Footnotes
Declaration of conflicting interests
The author(s) declared no potential conflicts of interest with respect to the research, authorship, and/or publication of this article.
Funding
The author(s) disclosed receipt of the following financial support for the research, authorship, and/or publication of this article: This research is partially supported by the NCI (R37 CA256810), Breast Cancer Research Foundation (BCRF 20-028), and the NSERC Discovery grant (RGPIN-2018-06008).