
Abstract
The response of many governments to the COVID-19 pandemic has involved measures to control within- and between-household transmission, providing motivation to improve understanding of the absolute and relative risks in these contexts. Here, we perform exploratory, residual-based, and transmission-dynamic household analysis of the Office for National Statistics COVID-19 Infection Survey data from 26 April 2020 to 15 July 2021 in England. This provides evidence for: (i) temporally varying rates of introduction of infection into households broadly following the trajectory of the overall epidemic and vaccination programme; (ii) susceptible-Infectious transmission probabilities of within-household transmission in the 15–35% range; (iii) the emergence of the Alpha and Delta variants, with the former being around 50% more infectious than wildtype and 35% less infectious than Delta within households; (iv) significantly (in the range of 25–300%) more risk of bringing infection into the household for workers in patient-facing roles pre-vaccine; (v) increased risk for secondary school-age children of bringing the infection into the household when schools are open; (vi) increased risk for primary school-age children of bringing the infection into the household when schools were open since the emergence of new variants.
Introduction
Analysis of household infection data
Households have often played an important role in infectious disease epidemiology, with policies in place and under consideration in the UK to reduce both within- and between-household transmission. 1 This is because the close, repeated nature of contact within the household means that within-household transmission of infectious disease is common. Also, most of the population lives in relatively small, stable households. 2 From the point of view of scientific research, the household is a natural unit for epidemiological data collection and households are small enough to allow for explicit solution of relatively complex transmission models. Some of the earliest work in this field was carried out by Reed and Frost, whose model was first described in the literature by Abbey 3 in a paper that analysed transmission in boarding schools and other closed populations. Frost’s 1928 lecture was later published posthumously, 4 with a re-analysis of his original household dataset from the 1918 influenza pandemic carried out using modern computational and modelling approaches by Fraser et al. 5
Subsequent important contributions were made in empirical studies of transmission in households, for example the highly influential study of childhood diseases by Hope Simpson, 6 and epidemic theory based on the analyses of discrete- and continuous-time Markovian epidemics presented by Bailey. 7 A key development was the solution by Ball 8 of the final size distribution of a random epidemic in a household without requiring Markovian recovery from infection, which then enabled statistical analyses of household infection data such as that by Addy et al. 9 Still further progress is possible due to the use of modern computational methods, particularly Monte Carlo approaches, to augment datasets10–12 or to avoid likelihood calculations. 13
Continued methodological developments and data availability have enabled increasingly sophisticated inferences to be drawn from household studies of respiratory pathogens, dealing with for example interactions between adults and children, 14 case ascertainment, 15 interactions between strains, 16 and details of family structure. 17 During the current pandemic, there have been numerous household studies, 18 with three recently published studies being notable for combining fitting of a transmission model with significant differentiation of risks being those of Dattner et al., 19 Li et al. 20 and Reukers et al. 21
Context for this study
The severe acute respiratory syndrome coronavirus 2 (SARS-CoV-2) emerged in the human population in late 2019 and the WHO declared a pandemic in March 2020. 22 Early in the pandemic, it became clear that risks of transmission, mortality and morbidity from the associated coronavirus disease (COVID-19) were highly heterogeneous with age, 23 and also that work in patient-facing roles was associated with increased risk of positivity in the community 24 as would be expected given the risks of healthcare-associated transmission. 25
During the period of the study, there have been two major ‘sweeps’ in the UK, during which a SARS-CoV-2 variant of concern (VOC) emerged and became dominant.
The first of these was PANGO lineage B.1.1.7, 26 or ‘Alpha’ under WHO nomenclature. 27 The first samples of this variant were found in September 2020, 26 and it was designated a VOC on 18 December 2020. 28 There is evidence for both increased transmissibility of this variant, and increased mortality amongst infected cases,29–31 although conditional on hospitalisation outcomes may not be worse. 32 The second VOC to emerge was PANGO lineage B.1.617.2, 33 or ‘Delta’ under WHO nomenclature, 27 which was designated a VOC on 6 May 2021 and is now the dominant variant in the UK. 34
Both of these variants were relatively easy to track through the S gene target in commonly used polymerase chain reaction (PCR) tests, with more details on this approach provided in section ‘Description of data’sec below.
Throughout 2021, the UK rolled out a comprehensive vaccination programme with priority given to healthcare workers, the clinically vulnerable, and then with prioritisation by age, from oldest to youngest.35,36 We will not include vaccination here at the individual level, but rather note its overall effect on infection and transmission at different times.
Here, we apply a combination of methods, including a regression that explicitly accounts for transmission, to the Office for National Statistics (ONS) COVID-19 Infection Survey (CIS) data from 26 April 2020 to 15 July 2021. 24 We particularly consider the absolute magnitude of transmission within and between households, as well as the associations between these and household size, age, infection with VOCs (inferred via S gene target) and work in patient-facing roles.
Methods
Description of data
ONS CIS 1 has a design based on variable levels of recruitment by region and time as required by policy, but otherwise uniformly random selection of households from address lists and previous ONS studies on an ongoing basis. If verbal agreement to participate is obtained, a study worker visits each household to take written informed consent, which is obtained from parents/carers for those aged 2–15 years. Participants aged 10–15 years provide written assent and those under 2 years old are not eligible.
Participants are asked questions on issues including work and age 2 as well as being tested for SARS-CoV-2 infection via reverse transcription PCR (RT-PCR). To reduce transmission risks, participants aged 12 years and over self-collect nose and throat swabs following study worker instructions, and parents/carers take swabs from children aged under 12 years. At the first visit, participants are asked for optional consent for follow-up visits every week for the next month, then monthly for 12 months from enrolment. The first few weeks of a hypothetical household participating in this study are shown schematically in Figure 1.
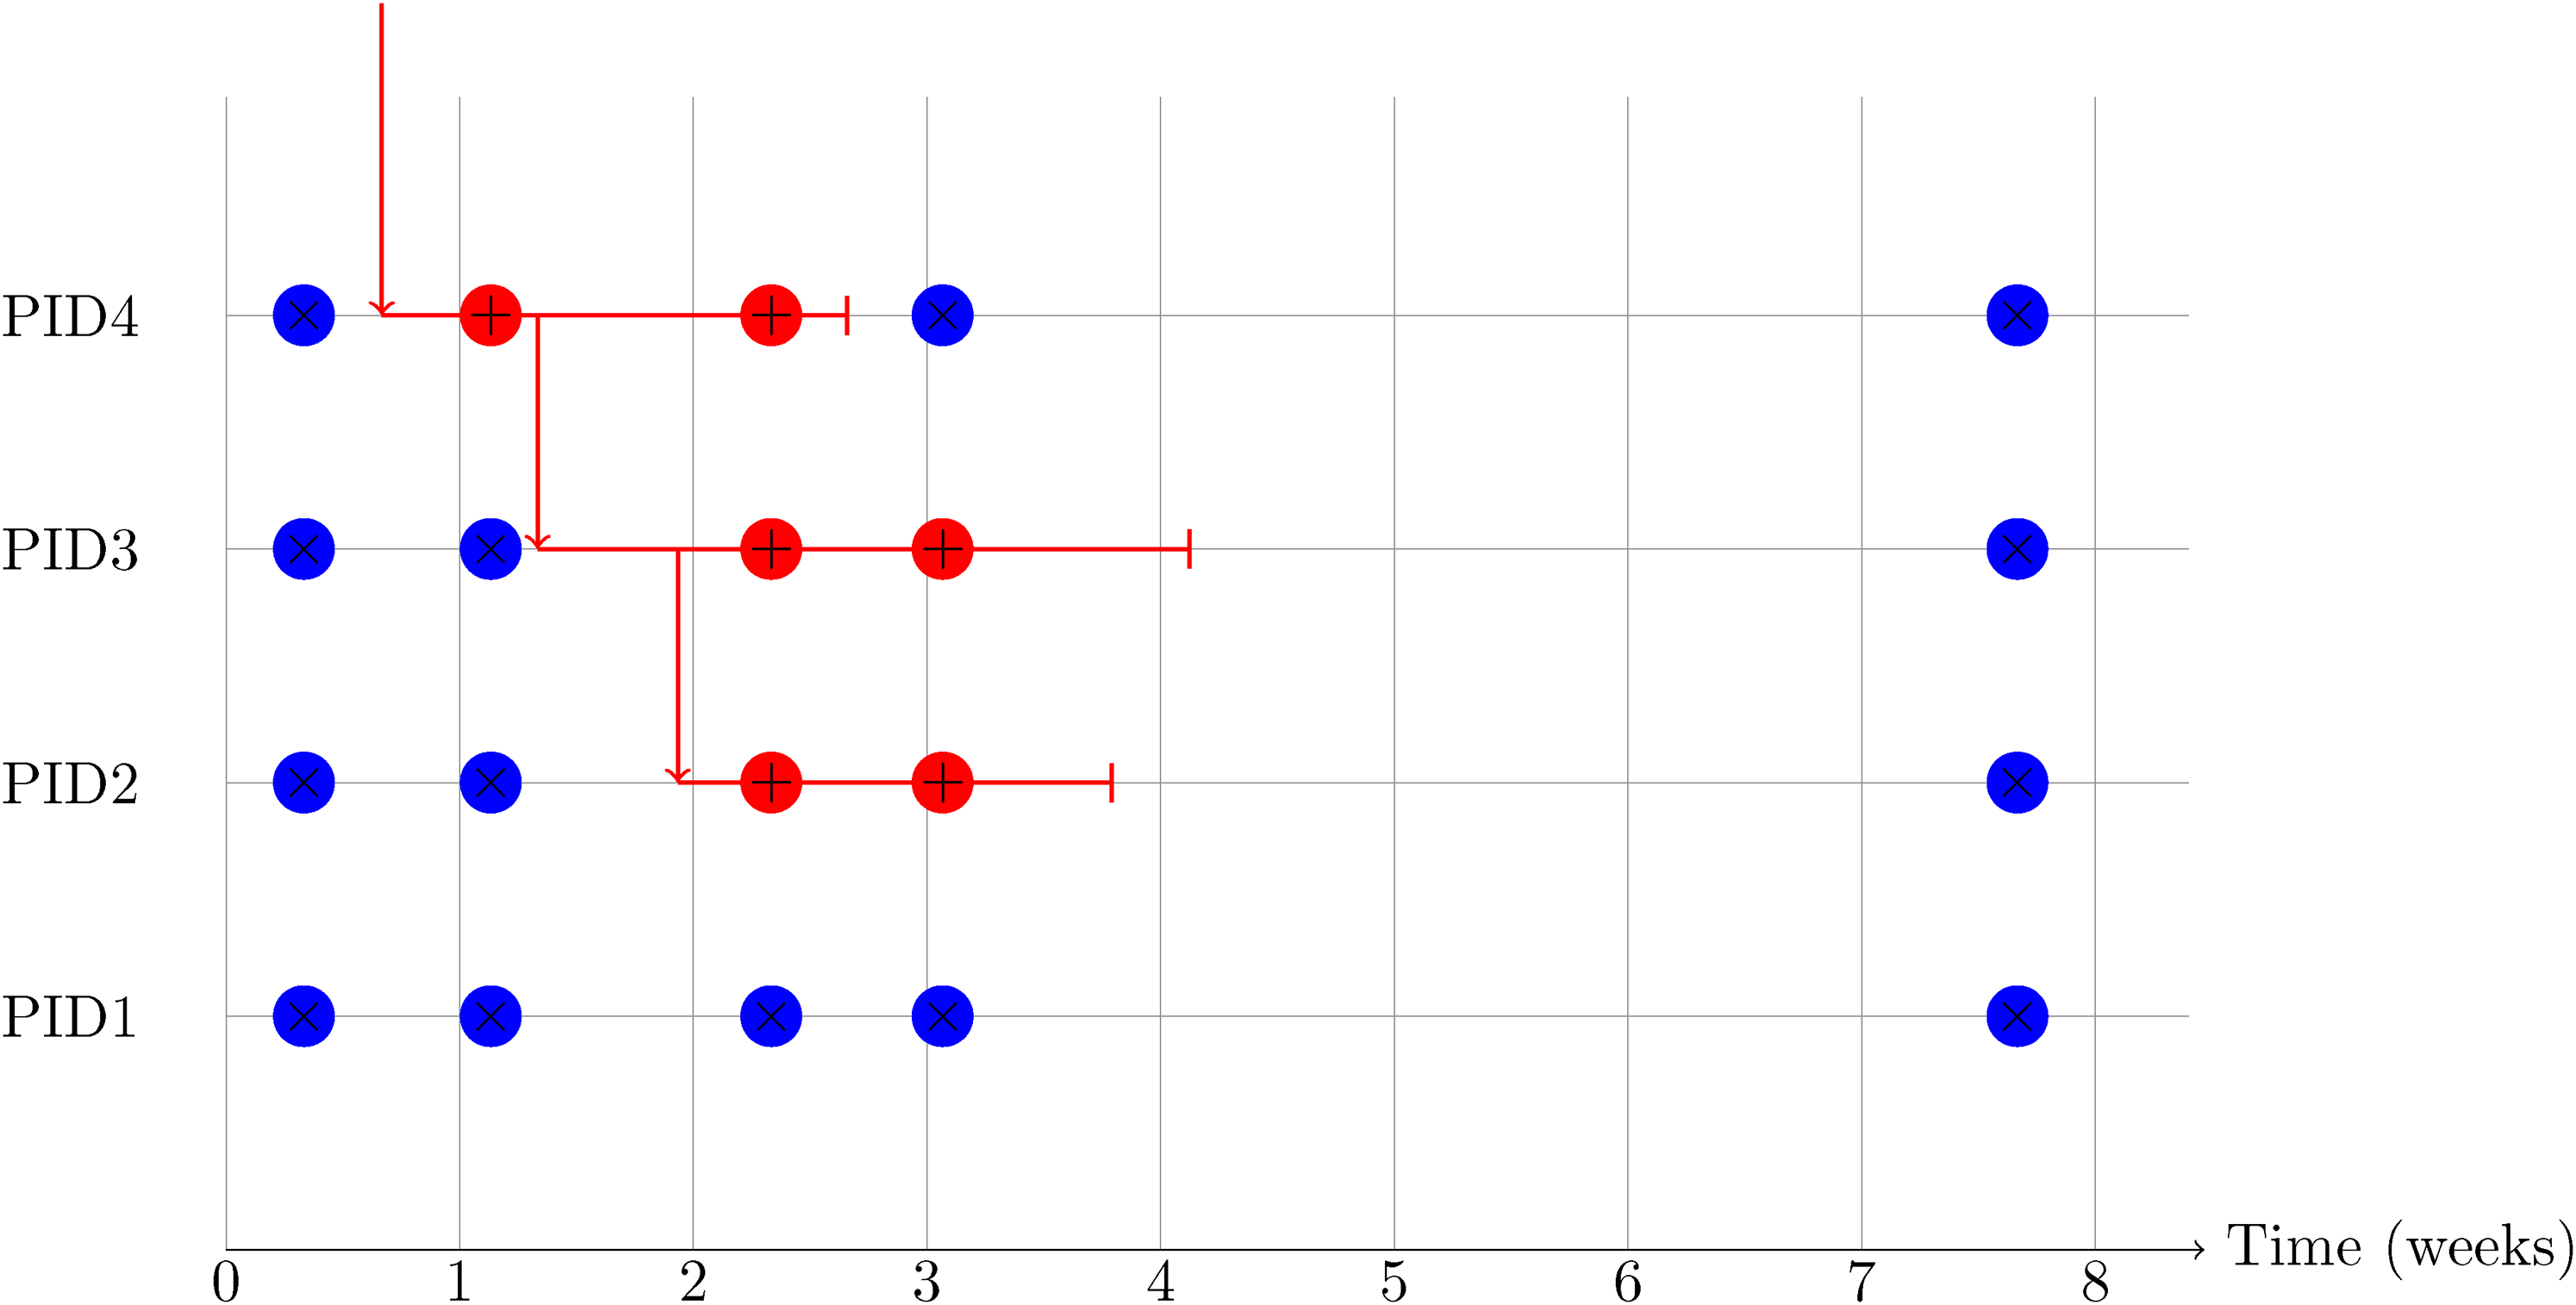
Schematic diagram of a hypothetical but realistic data pattern for a four-person household in the first 2 months after recruitment. Each negative test is shown as a blue circle containing
Swabs were analysed at the UK’s national Lighthouse Laboratories at Milton Keynes and Glasgow using identical methodology. RT-PCR for three SARS-CoV-2 genes (N protein, S protein and ORF1ab) used the Thermo Fisher TaqPath RT-PCR COVID-19 Kit, and analysed using UgenTec FastFinder 3.300.5, with an assay-specific algorithm and decision mechanism that allows conversion of amplification assay raw data from the ABI 7500 Fast into test results with minimal manual intervention. Samples are called positive if at least a single N-gene and/or ORF1ab are detected. Although S gene cycle threshold (Ct) values are determined, S gene detection alone is not considered sufficient to call a sample positive.
This analysis includes all SARS-CoV-2 RT-PCR tests of nose and throat swabs from 26 April 2020 to 15 July 2021 for English households in the ONS CIS. We restrict our analysis to households of size 6 and under, partly for computational reasons that we will discuss below, and partly because this captures the overwhelming majority of households, with larger households being atypical in various ways.
2
Over 94% of households have all members participating, and for the remainder we treat the household as composed of participants only. In contrast to other studies, the households we select constitute an approximately representative sample from the population when stratified by date and region. The restriction to England was chosen because we split the data into four time periods, corresponding to changing situations about policies that are devolved (i.e. policies are different in Scotland, Wales and Northern Ireland). These time periods split the data into the following tranches, with associated time periods and notable events (described broadly).
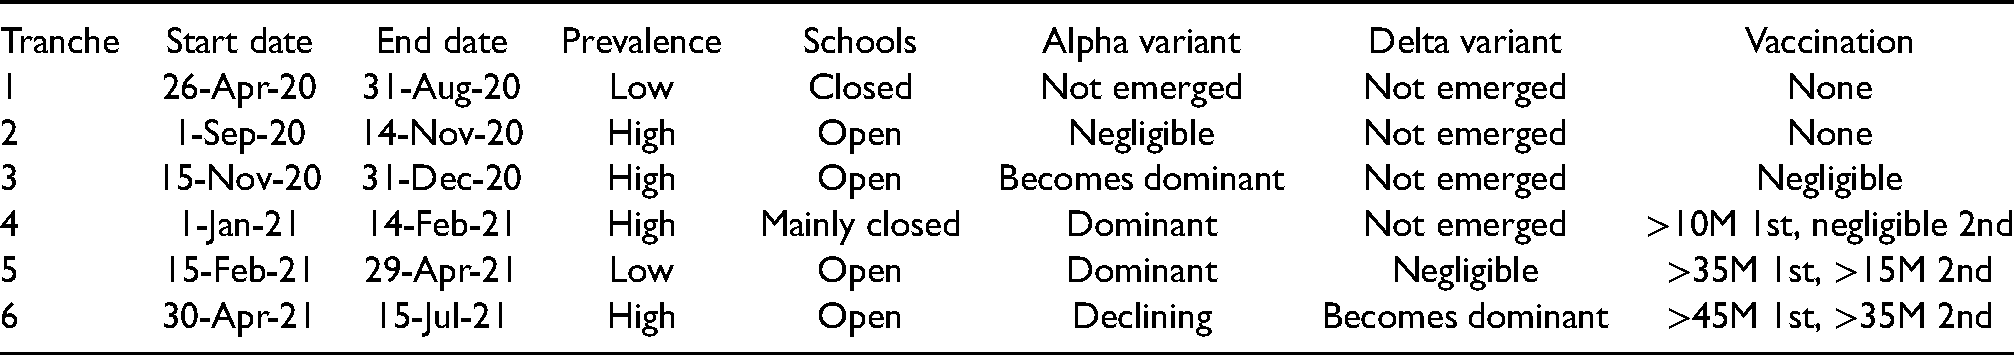
Tranche 1: 26 April 2020 to 31 August 2020; low prevalence; schools closed; Alpha and Delta variants not emerged yet; no vaccine available. Tranche 2: 1 September 2020 to 14 November 2020; high prevalence; schools open; negligible Alpha variant; Delta variant not emerged yet; no vaccine available. Tranche 3: 15 November 2020 to 31 December 2020; high prevalence; schools open; Alpha variant becomes dominant; Delta variant not emerged yet; negligible vaccine coverage. Tranche 4: 1 January 2021 to 14 February 2021; high prevalence; schools closed (except for pre-school); Alpha variant dominant; Delta variant not emerged yet; over 10 million first vaccine doses by end of time period. Tranche 5: 15 February 2021 to 29 April 2021; low prevalence; schools open; Delta variant negligible; over 35 million first and 15 million second vaccine doses by end of time period. Tranche 6: 30 April 2021 to 15 July 2021; high prevalence; schools open; Delta variant becomes dominant; over 45 million first and 35 million second doses distributed by end of time period.
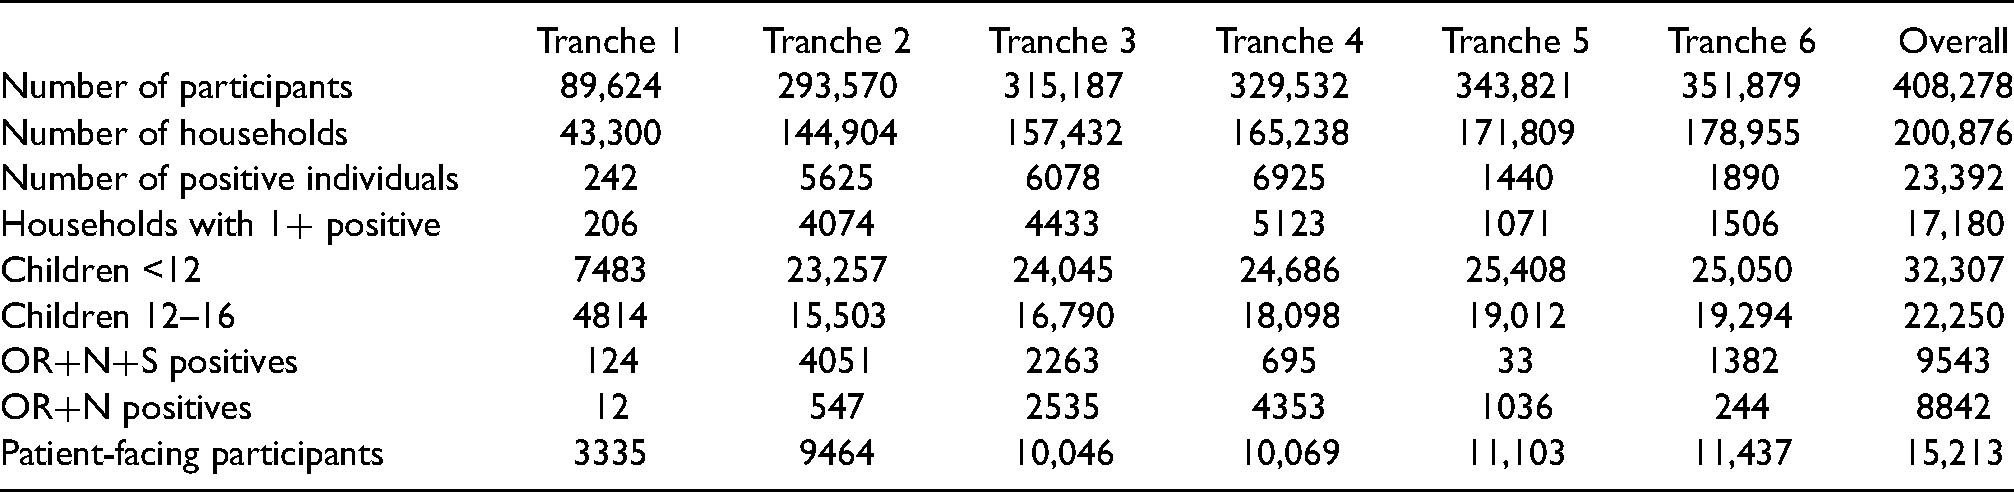
These properties are summarised again in Table 1. The properties of the data allocated to these tranches are shown in Table 2. Note that, while we do not include new primary infections in households after 15 July 2021, but do include later secondary infections in households where the primary infection happened before 15 July 2021. This is done to reduce problems with censoring.
Summary of properties of the time periods (tranches) that the data are split into for analysis.
Features of the dataset and different tranches.
Mathematical representation of data
Suppose we have a set of 
We let a tranche be defined by a time interval 

Exploratory analysis of density and ages
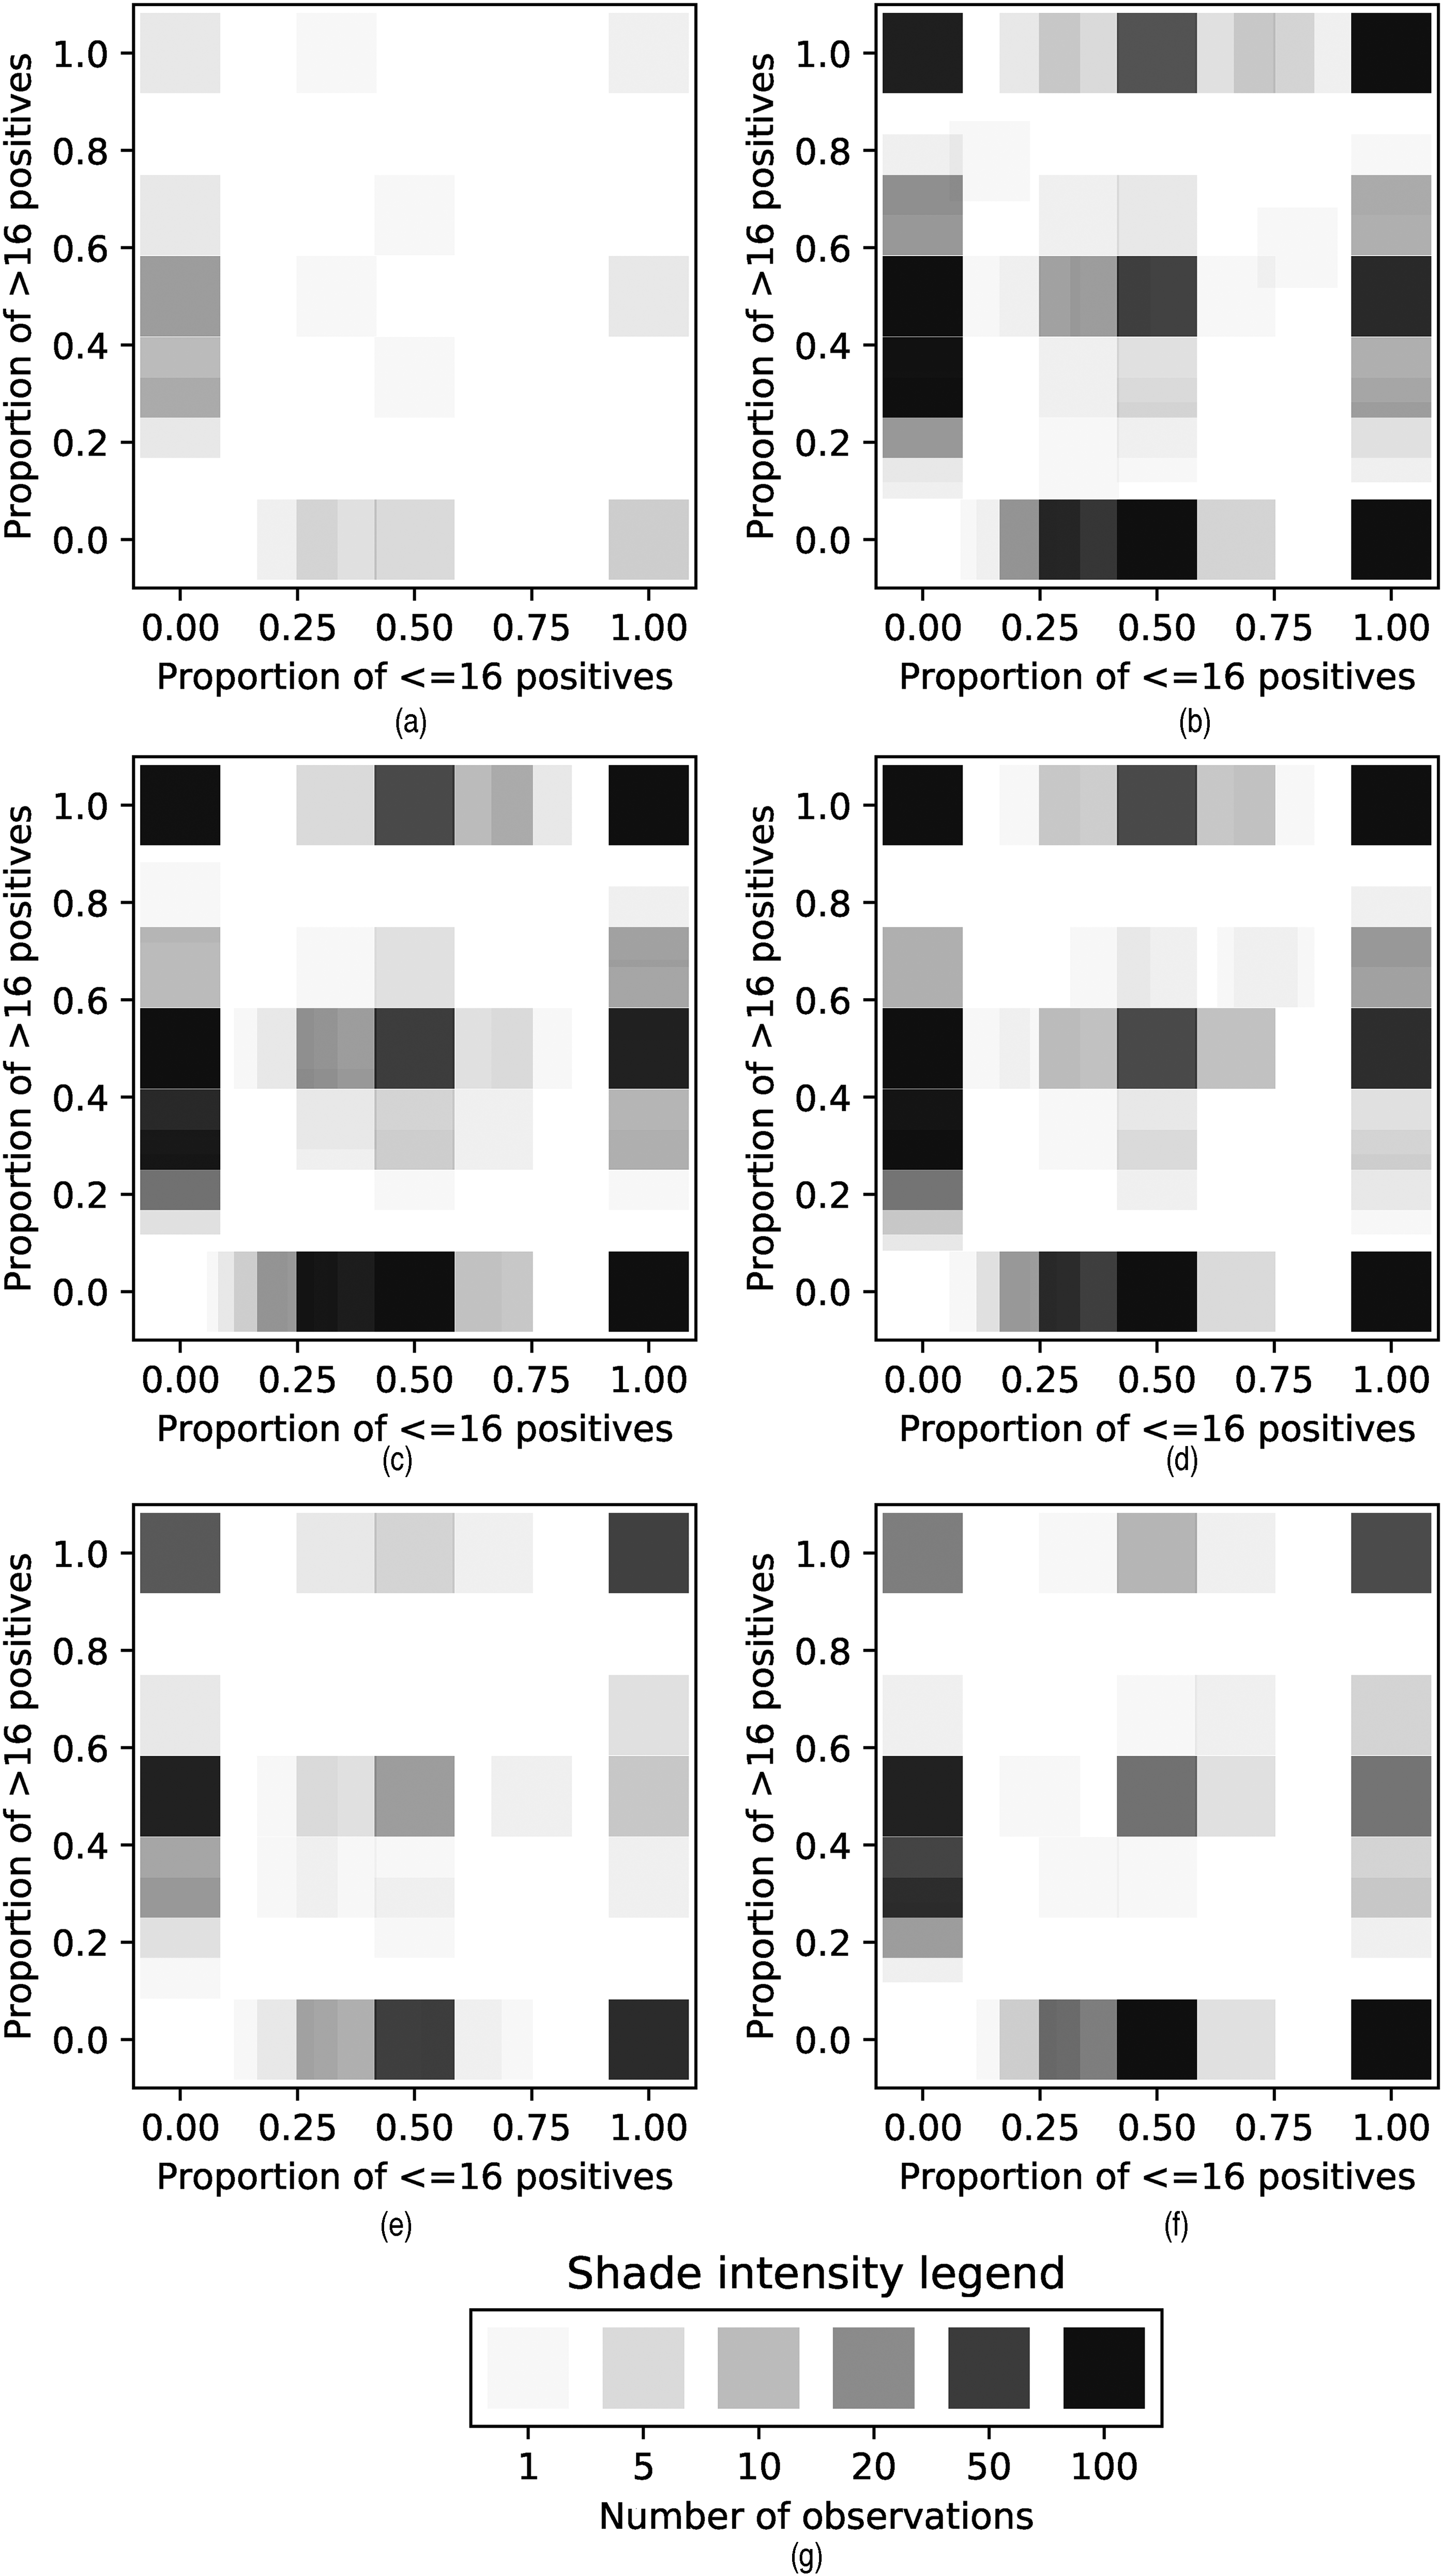
An important part of our analysis will be consideration of counts/proportions of households with a given composition of cases displayed as histograms as shown in Figure 2, and density plots as shown in Figure 3.

Histograms of household attack rates. (a) Tranche 1, (b) Tranche 2, (c) Tranche 3, (d) Tranche 4, (e) Tranche 5, and (f) Tranche 6.
Kernel density plots showing proportion of positives in different age classes in households. (a) Tranche 1, (b) Tranche 2, (c) Tranche 3, (d) Tranche 4, (e) Tranche 5, (f) Tranche 6, and (g) Legend.
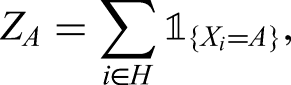
The heights of the histogram bars are given by
The density plots are obtained by considering some feature (in this case, age) that takes values 
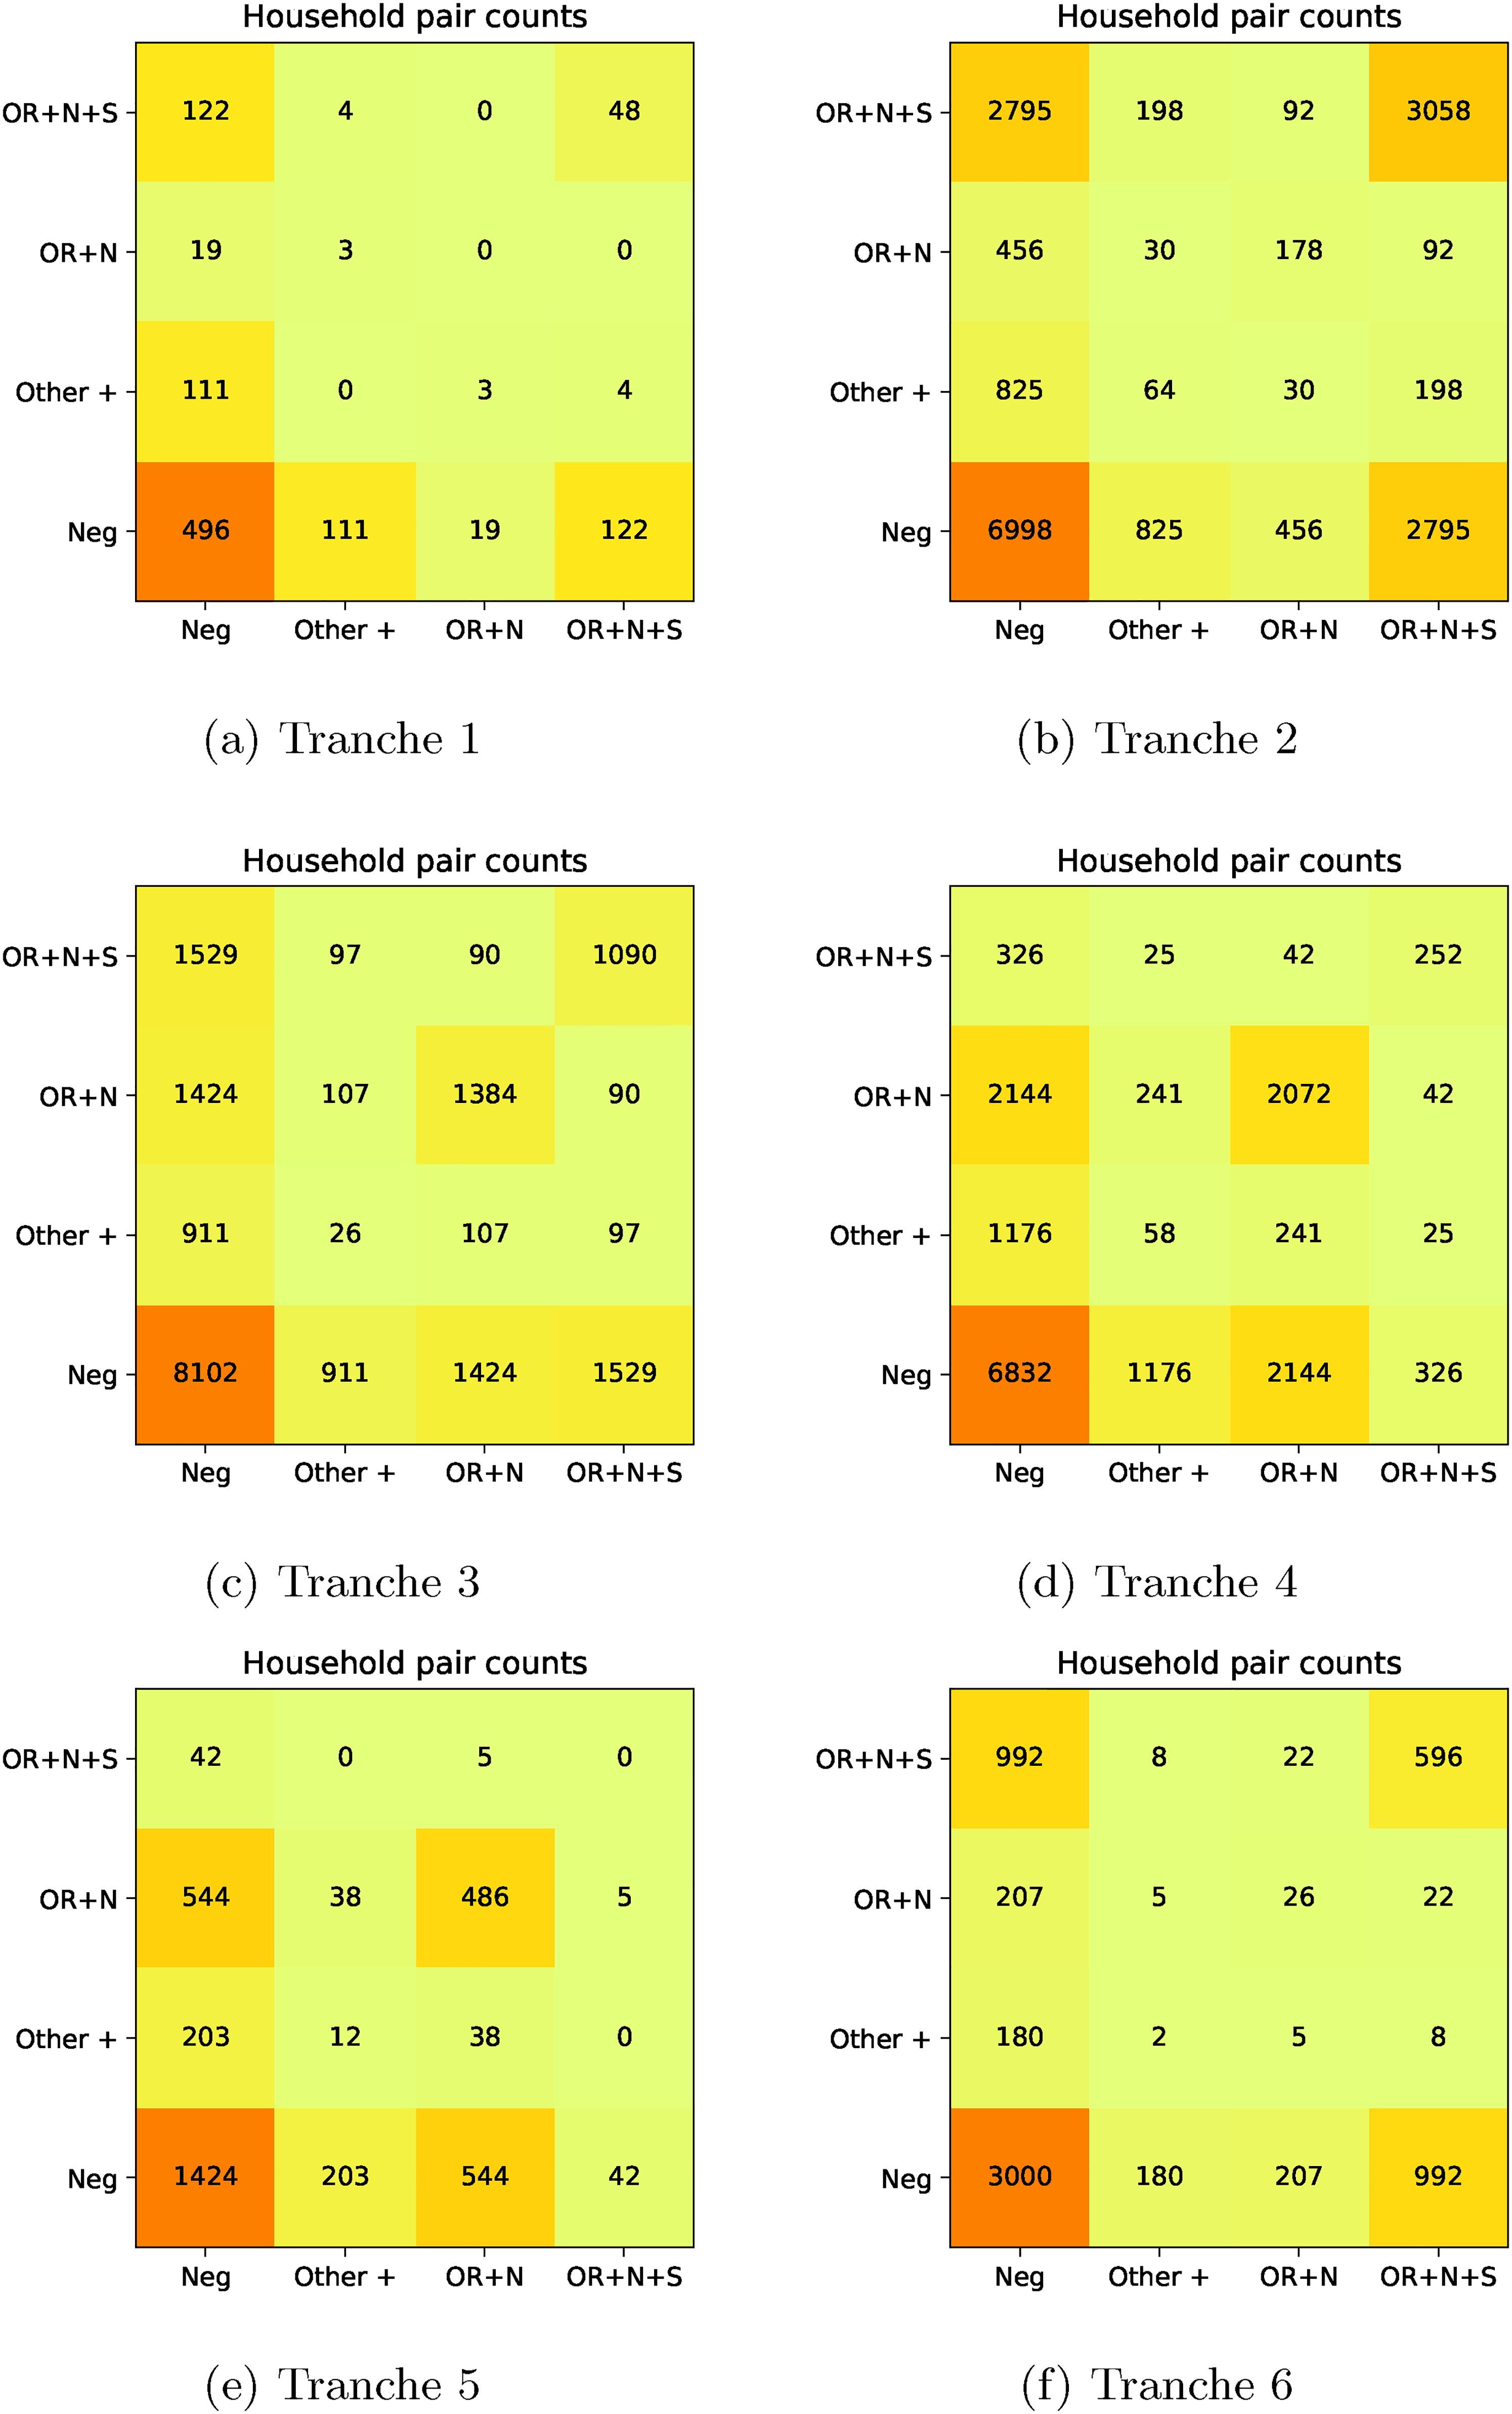
Pair counts for PCR gene positivity patterns. (a) Tranche 1, (b) Tranche 2, (c) Tranche 3, (d) Tranche 4, (e) Tranche 5, and (f) Tranche 6.
Residual analysis and gene positivity pattern
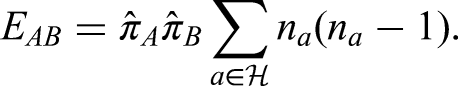
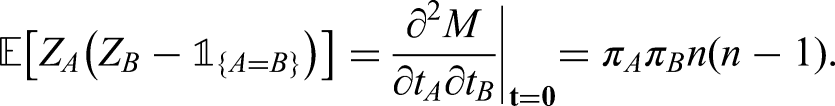
We are also interested in tabulation of features and positives in households in a manner that allows their clustering to be assessed. In particular, this involves calculation of Pearson residuals for the within-household pairs of features and positives. Let 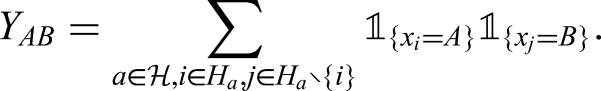
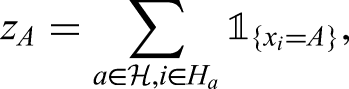

Here we will use pattern of PCR target failure as a feature and the restriction of households to those in which there is at least one infection (to avoid domination of the tables by all-negative households), that is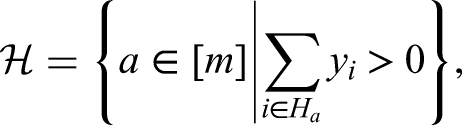
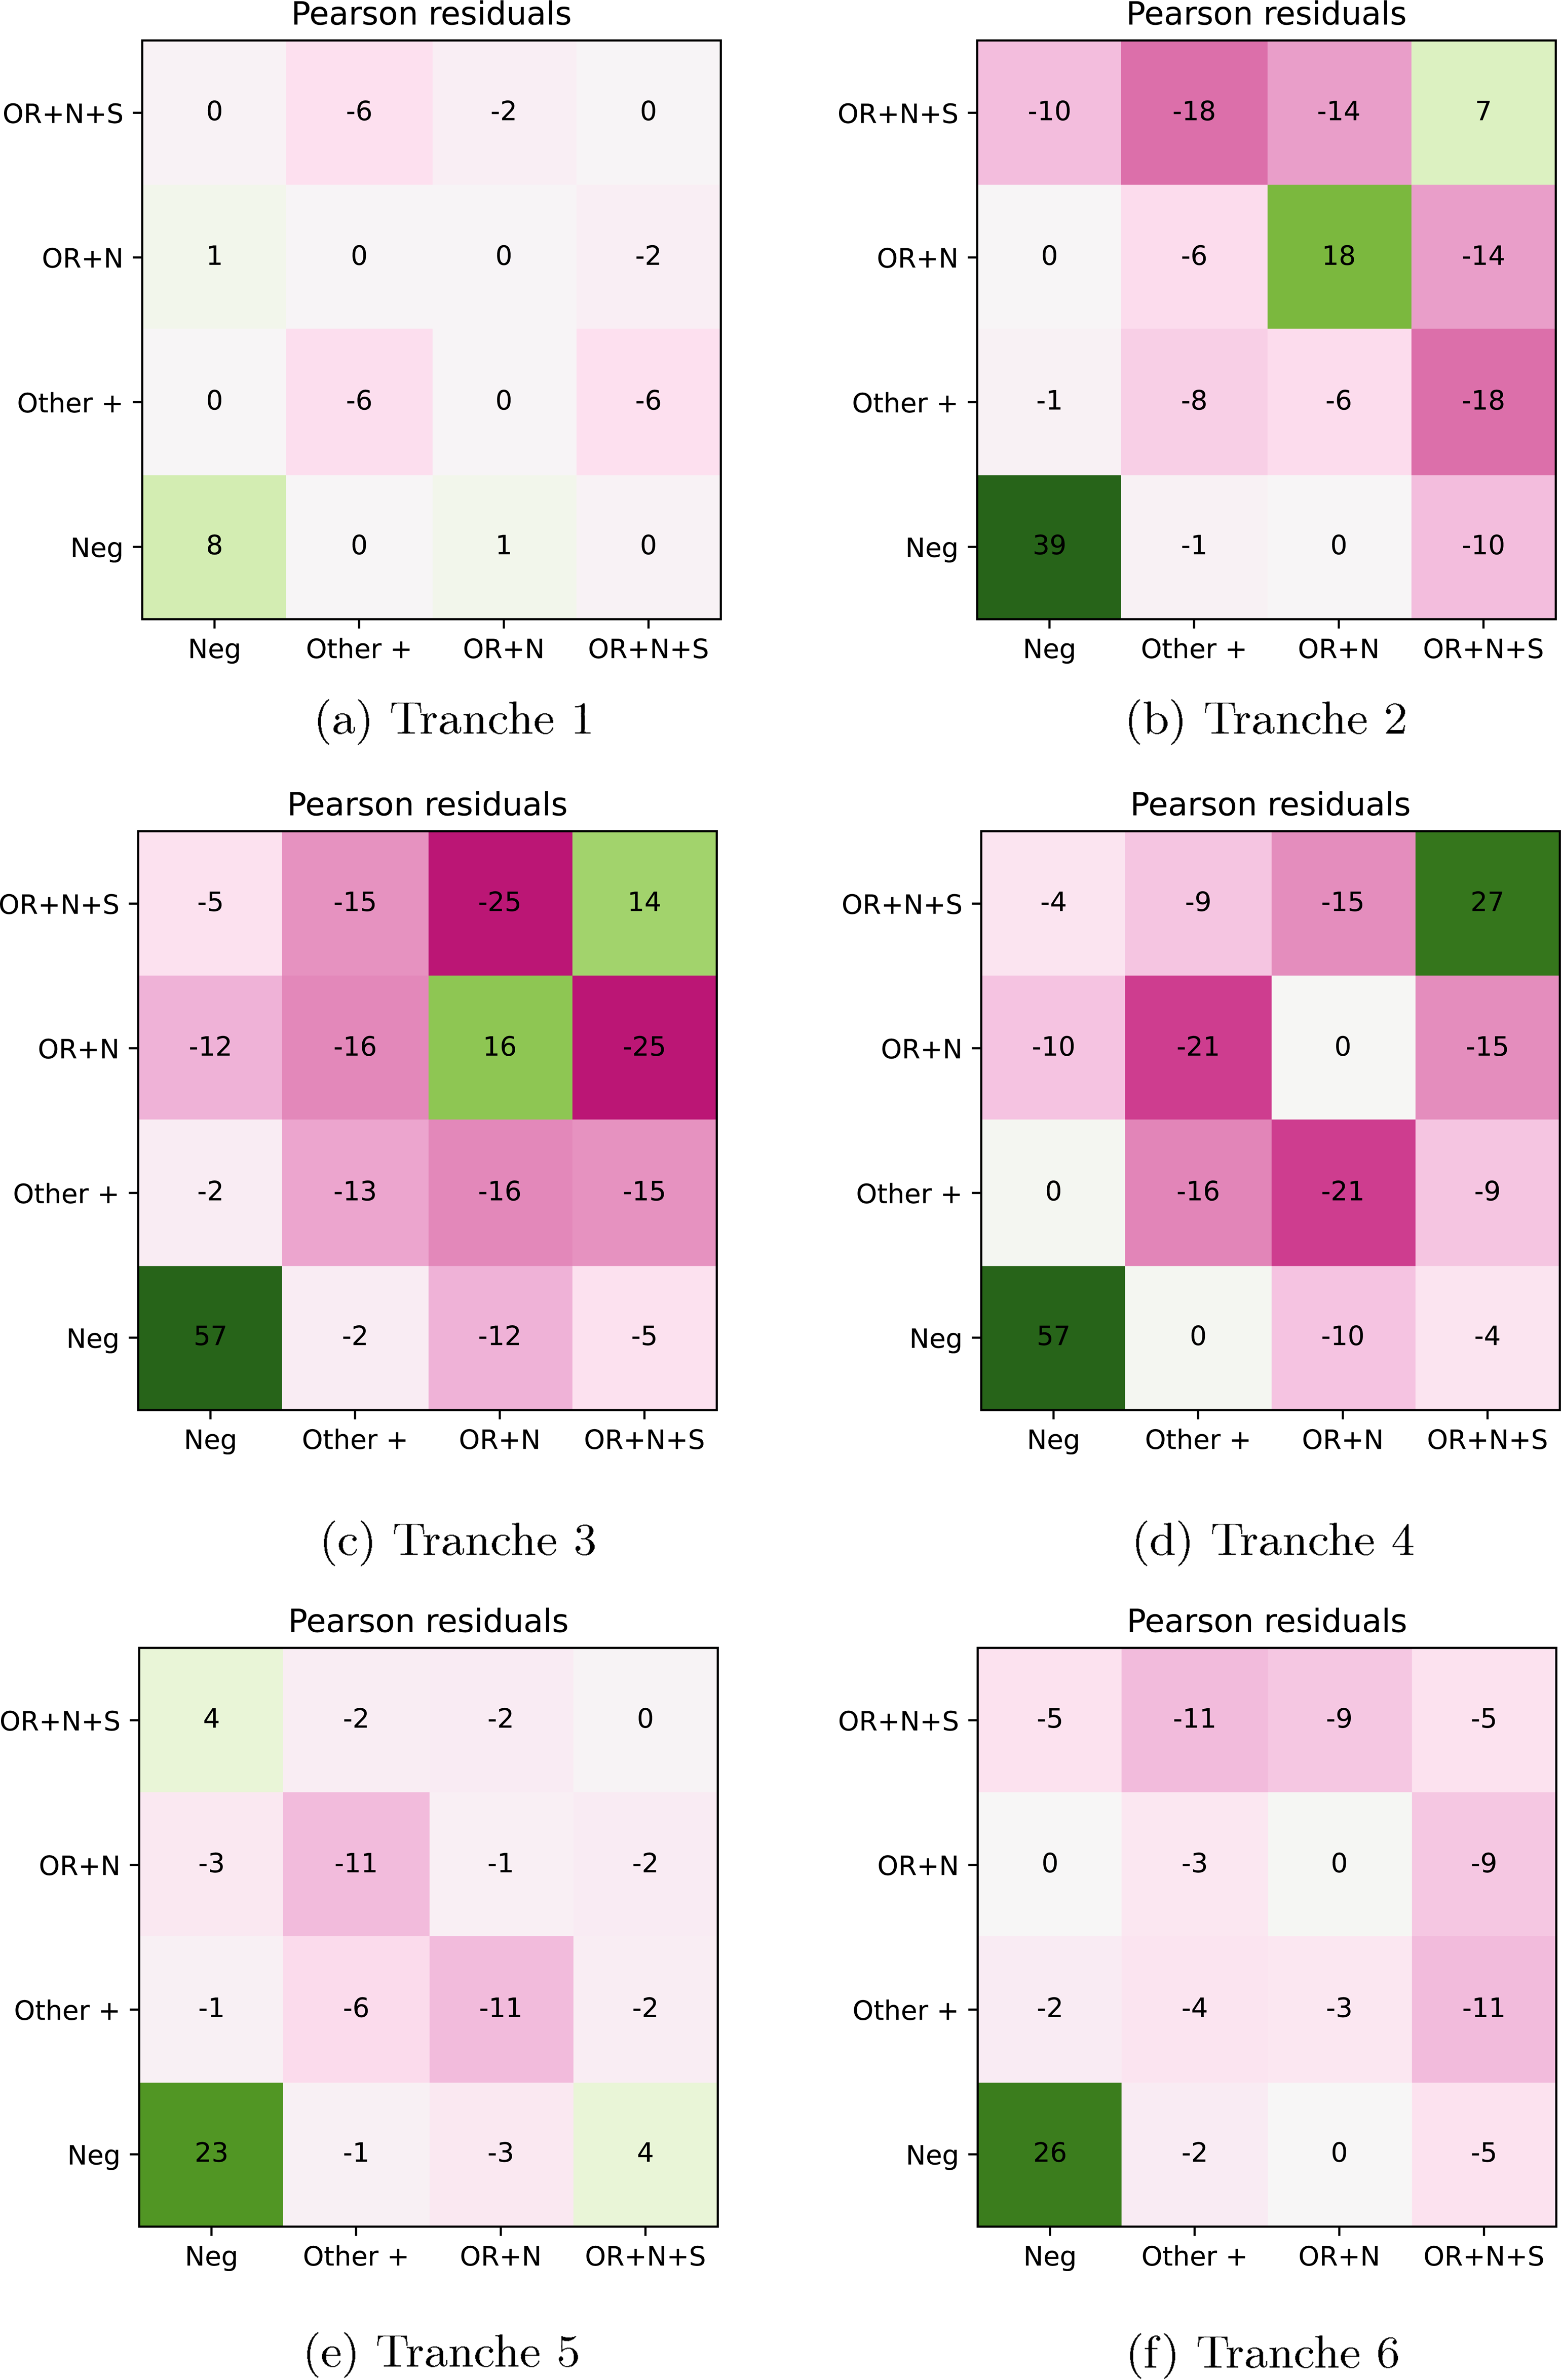
Residual plots for PCR gene positivity patterns. (a) Tranche 1, (b) Tranche 2, (c) Tranche 3, (d) Tranche 4, (e) Tranche 5, and (f) Tranche 6.
There are three main patterns of gene positivity that we are interested in:
Full probability model
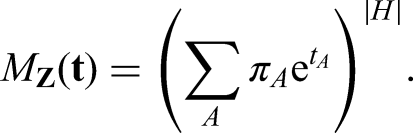
While the more exploratory methods above are useful for formulating hypotheses, the main part of our analysis will be household regression, using time, household size and individual features to predict positivity. We start by defining a vector and matrix for each household 

We will consider the relevant equations for a household 

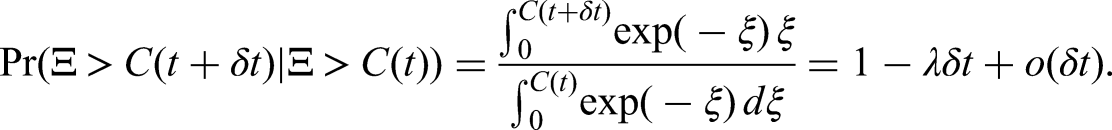
The first model component is the probability of avoiding infection from outside; for the 

The second component of the model is variability in the infectiousness at the individual level, usually interpreted as arising from the distribution of infectious periods. Suppose, in particular, that a household has just one susceptible and one infectious individual, and that the infectious individual exerts a force of infection 
Using 

For our modelling, we assume that each individual picks an infectious period from a unit-mean Gamma distribution since the equations are not sensitive to the mean and this therefore provides a natural one-parameter distribution with appropriate support. The Laplace transform of this as used in (6) is
The third component of the model is the infection rate from individual 
Model variables and fitting
We now enumerate all of the model parameters, distinguishing between the ‘natural’ representations of parameters that sit in 
The second part of the parameter space relates to baseline within-household transmission with natural representation 
The third part are features, where we consider:
Three age groups: 2–11 years old; 12–16 years old; and older. Working in a patient-facing role or not. Pattern of PCR gene target positivity: OR
We assume that age and working in a patient-facing role have an association with external risk, leading to natural parameters
Model fitting was performed in an approximate Bayesian framework using the Laplace approximation. As noted above, households of size 7 and larger were excluded from the analysis partly because these are often very different in composition from smallerhouseholds, and partly because of the numerical cost of solving a linear system of size
Data processing and software implementation
The analysis was carried out on the ONS Secure Research Server in the Python 3 language. To illustrate issues with data processing, note that the ‘flat’ form for the data extracted from the database after cleaning takes a form like:
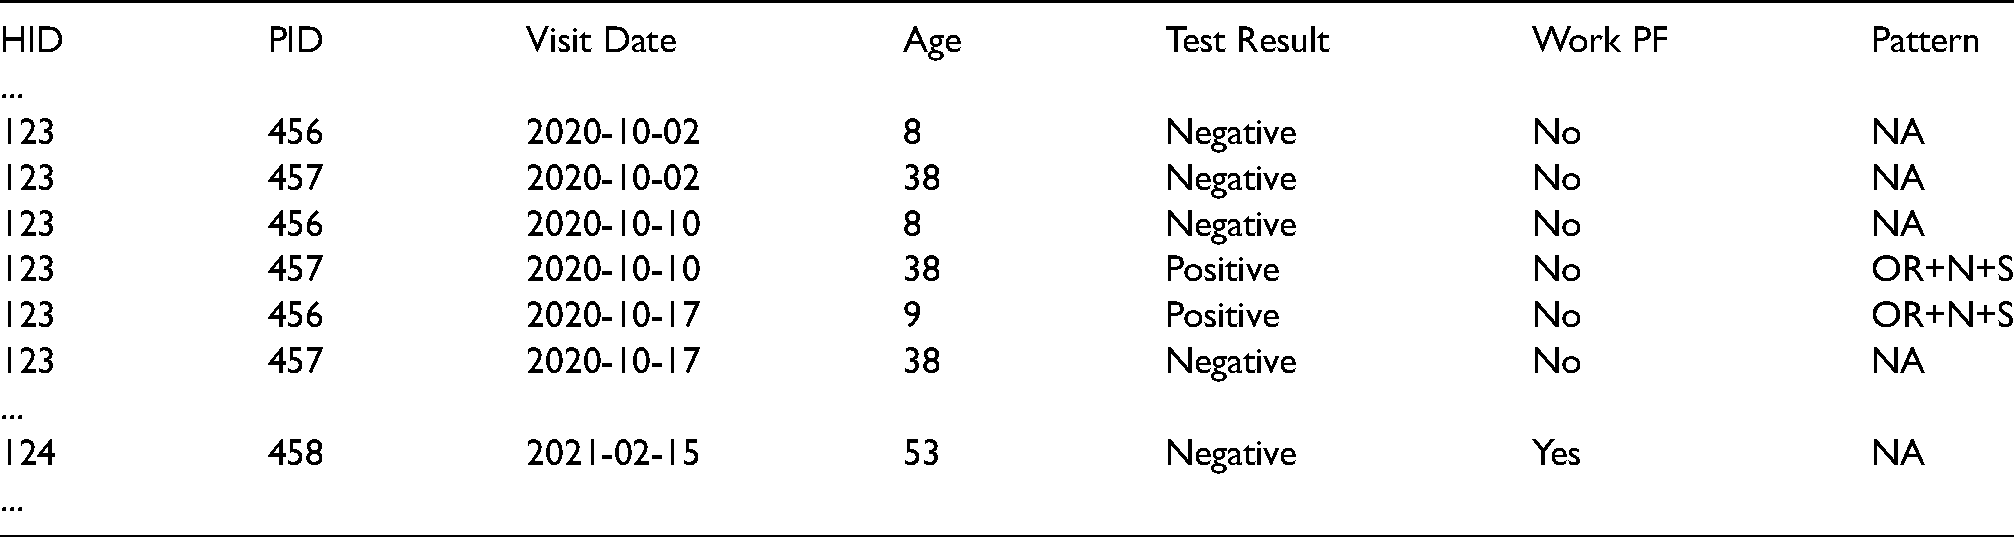
In particular, there is a hierarchical structure to the data. Households, each with a unique household ID in the HID column, have a number of study participants with a unique participant ID in the PID column, and each participant being visited on a number of dates as in the Visit Date column. Each visit will have associated participant features (e.g. as in the Age column above) and a Test Result.
The large size of this flat file (slightly under three million rows) means that it is advantageous to use specialist libraries, in this case pandas41,42 together with NumPy. 43 To deal with the nested structure of the data, we used the ‘split-apply-combine’ paradigm that this library encourages by analogy with SQL operations. In the example above, this would involve first associating each participant with an age using pandas.groupby(′PID′) and pandas.DataFrame.apply(numpy.min), and then producing an array of ages for each household using pandas.groupby(′HID′) and pandas.DataFrame.apply(numpy.array). A similar approach is possible for test results and multiple features.
Apart from data processing, the main computational cost of the analysis is the linear algebra associated with solving (5), particularly for larger households. Due to portability, this was carried out in NumPy on the ONS system, however we found that implementation in Numba 44 can generate significant speed-ups, as might use of GPU hardware through use of, for example, PyTorch. 45
Access to ONS CIS data is possible via the Office for National Statistics’ Secure Research Service, and Python code demonstrating the methodology applied to publicly available data is at https://github.com/thomasallanhouse/covid19-housefs.
Results and discussion
Exploratory analysis
Figure 2 shows the distribution of positives in households; comparison with Table 2 shows that the number of households with two or more positives are much greater than would be expected under the assumption of independence. In fact, some histograms even take a bimodal ‘U’-shape.
This multi-modality is even more apparent in the kernel plots in Figure 3, which also demonstrate that it is common to see households with only child positives, only adult positives, or both. In particular, this suggests that both children and adults can be responsible for bringing infection into the household. While some of the child-infection-only households could arise due to failure of ascertainment of an adult infection in the household, this is unlikely to be true for most, meaning, the introduction of infection to the household would have been due to a child (and vice versa for adult-infection-only households).
Residual analysis
The pair counts and Pearson residual analysis – applied to the maximal PCR target gene positivity pattern being OR
Regression analysis
The regression analysis has its outputs shown in Table 3, Figures 6 and 7. We now present these in order.
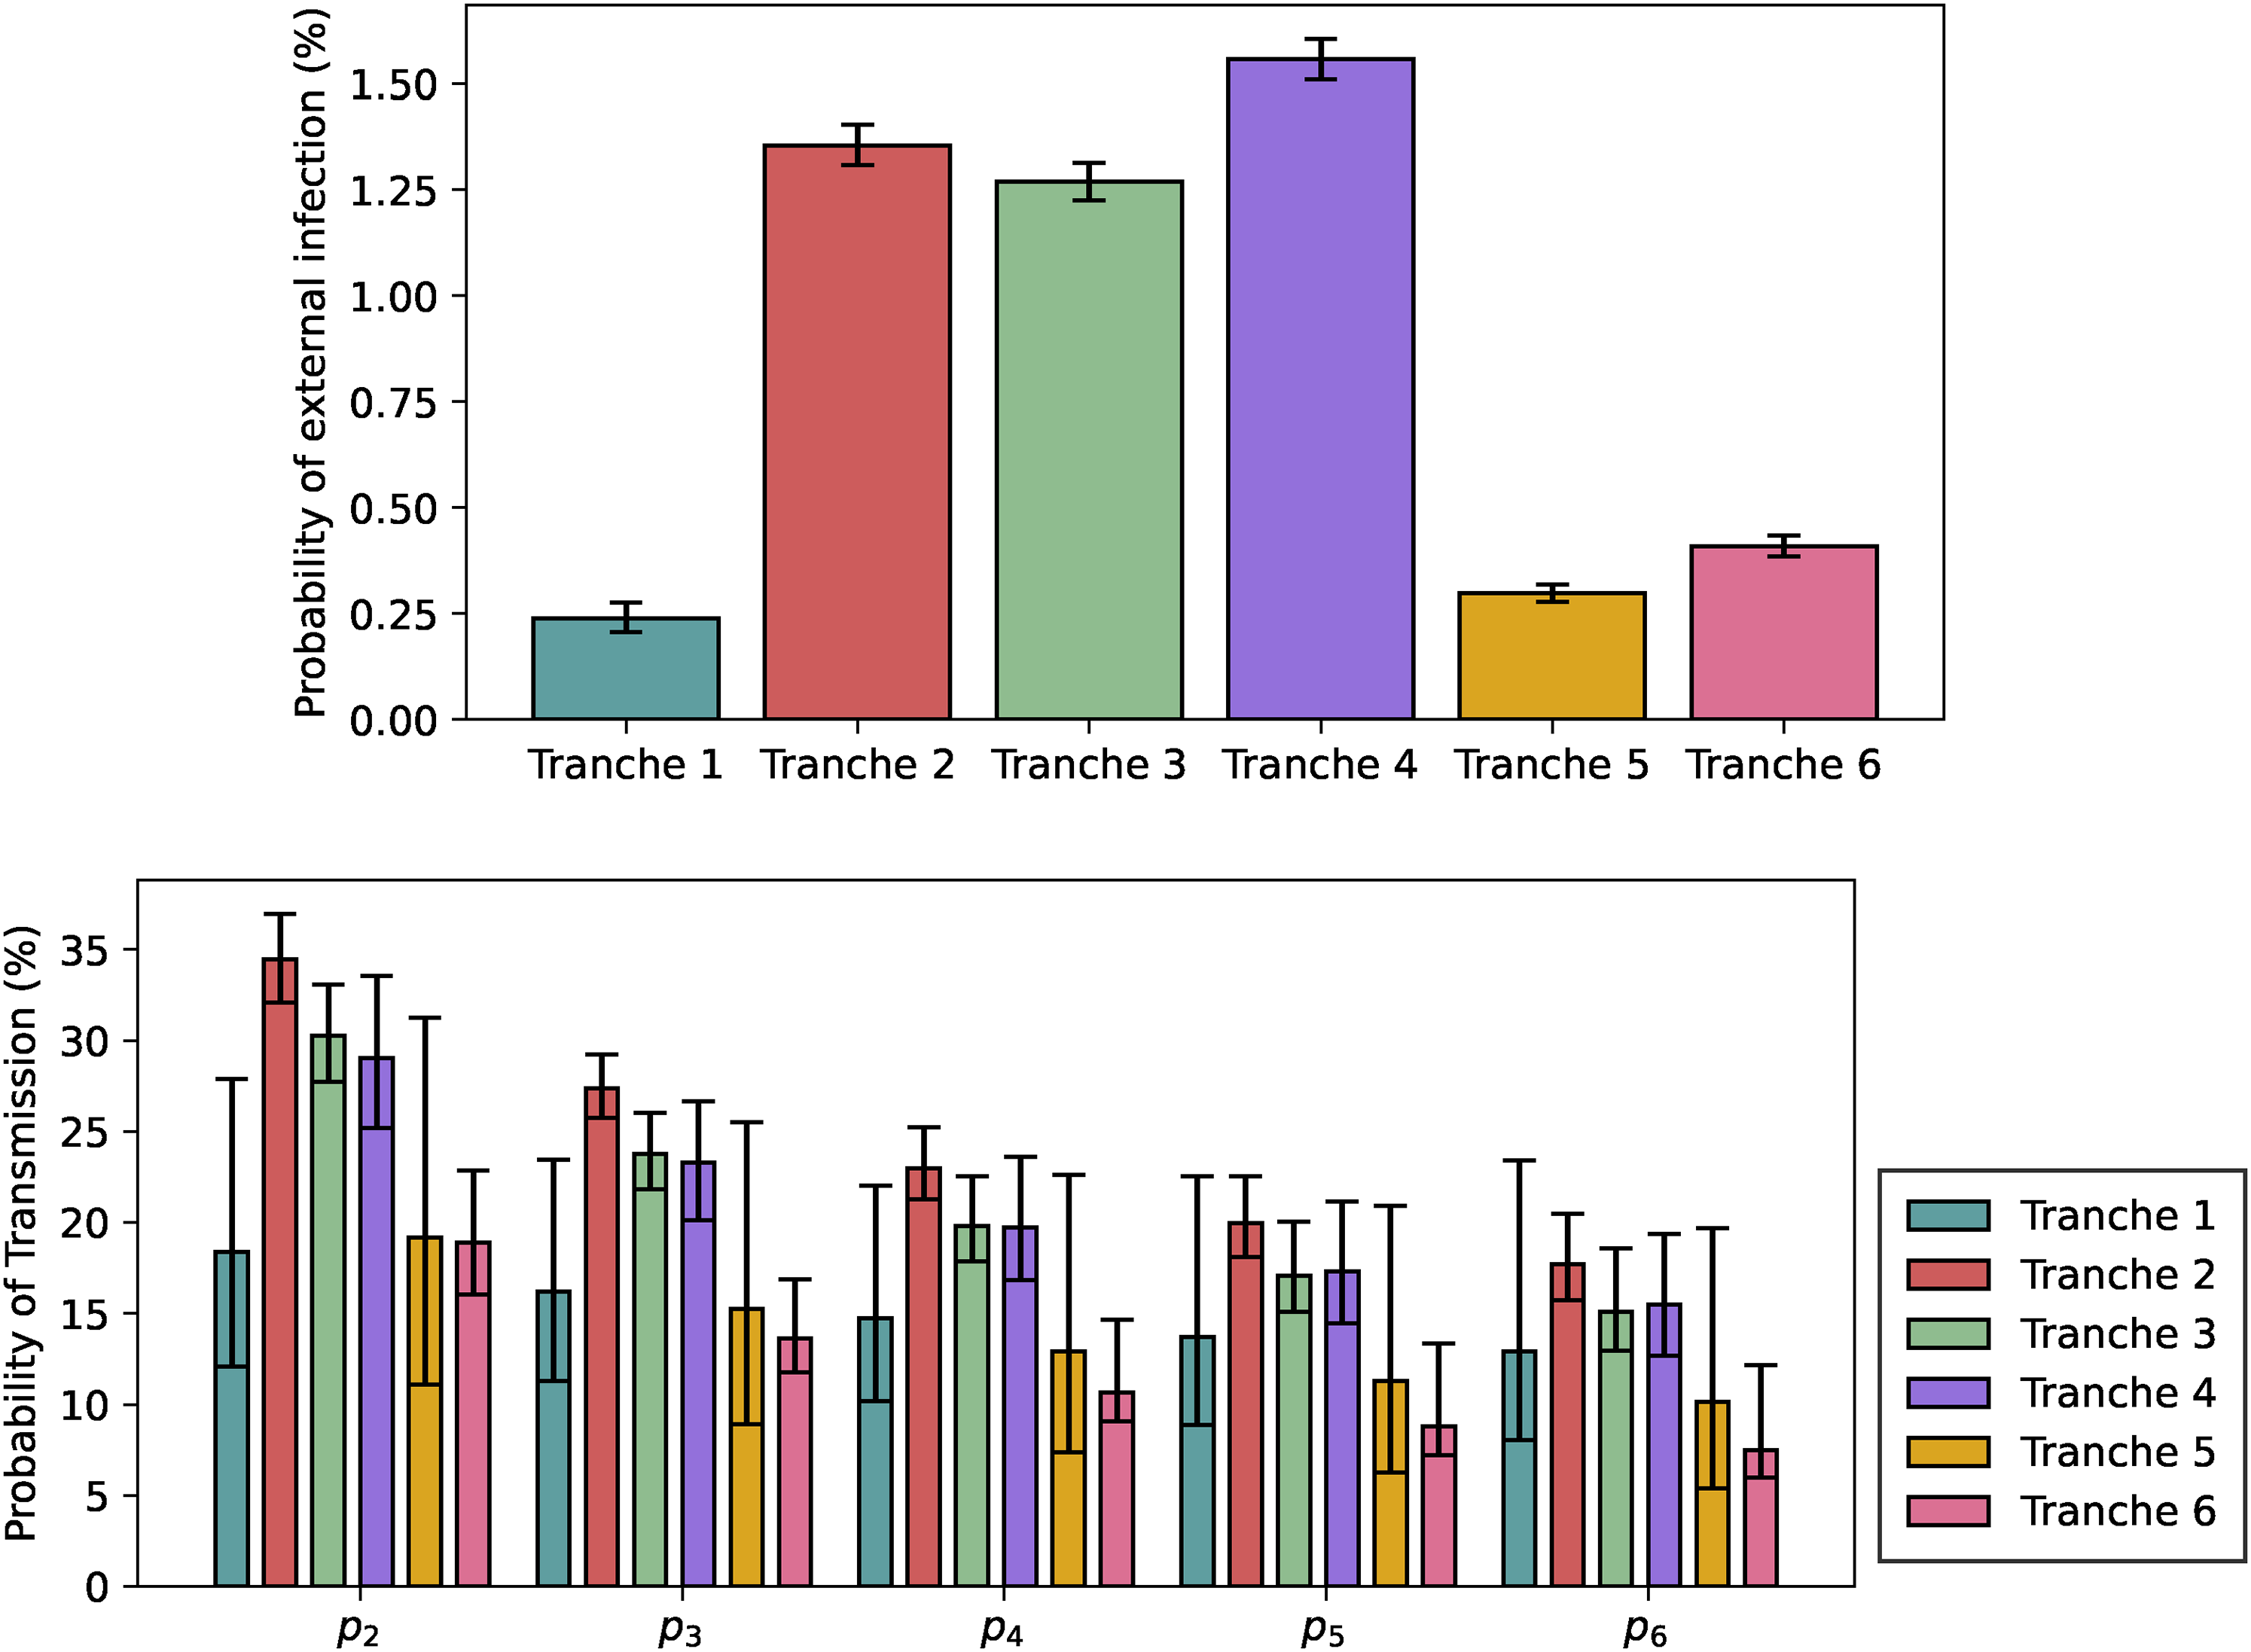
Visualisation of the fitted model. Top: Baseline probability of infection from outside. Bottom: Per-pair baseline probabilities of secondary transmission within the household, not including tertiary transmission effects.
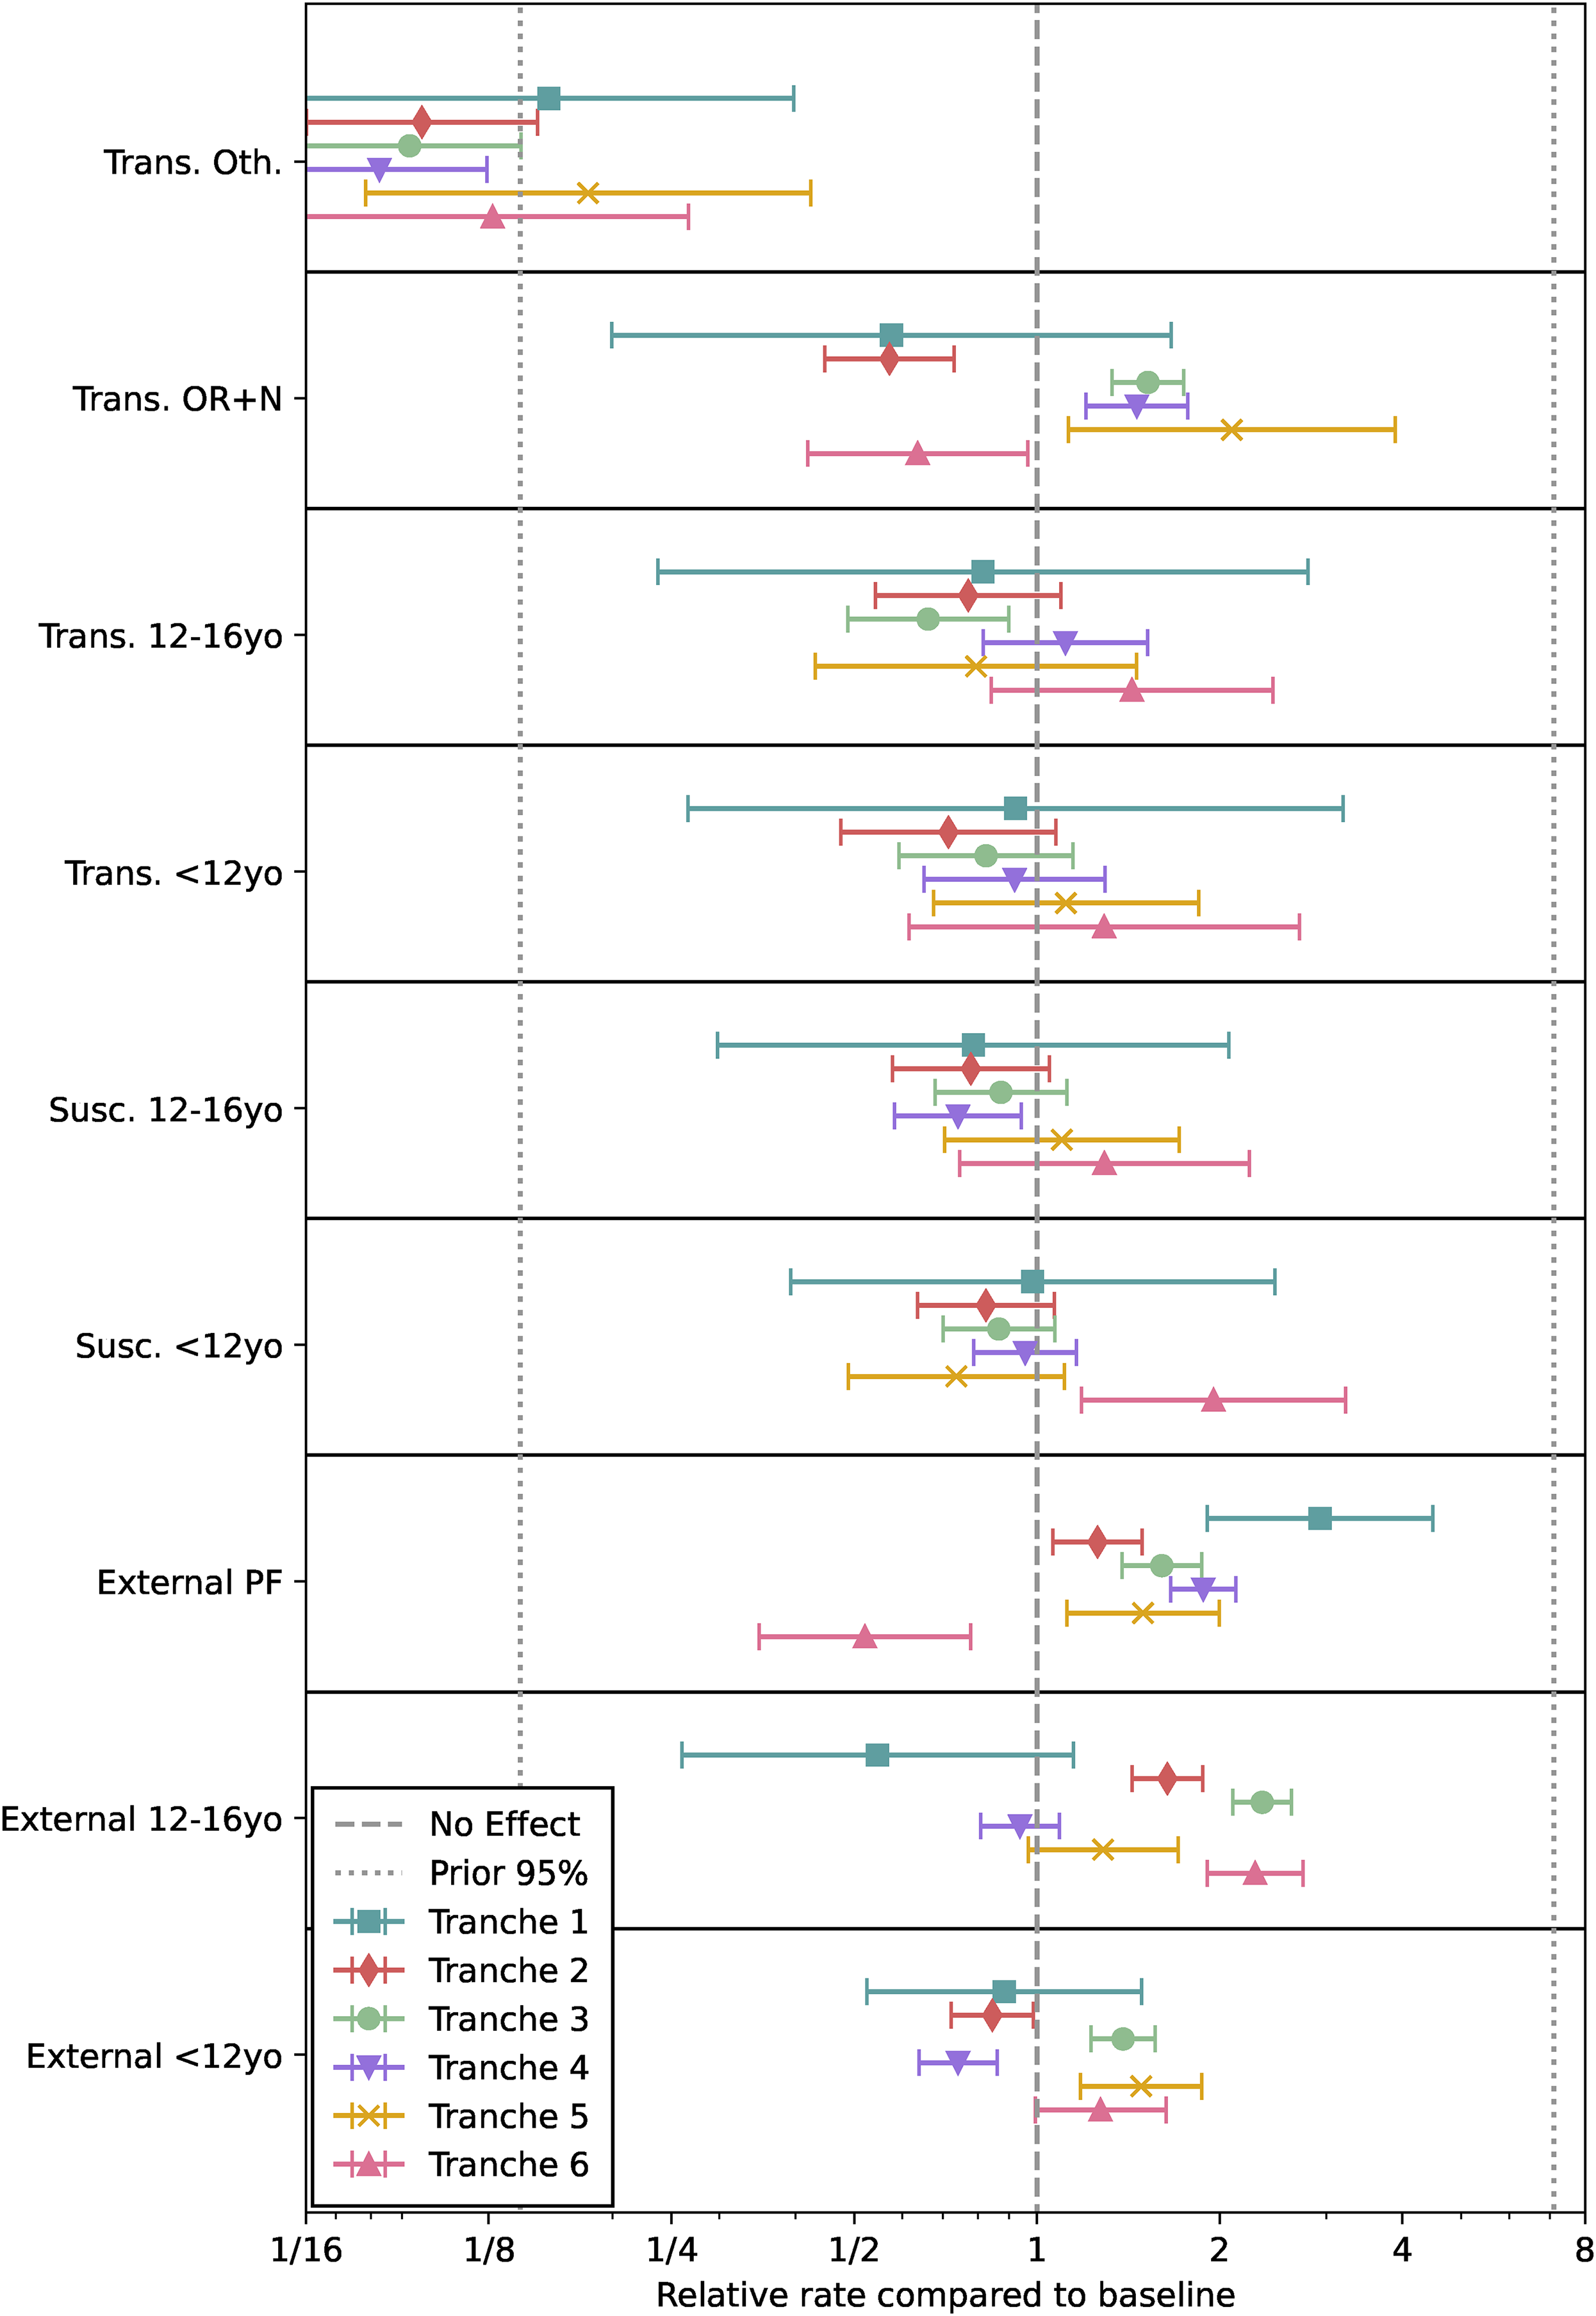
Visualisation of the fitted model. Relative effects on transmission, susceptibility and external exposure compared to baseline of an adult not working in a patient-facing role with OR
The parameter point estimates and CIs.
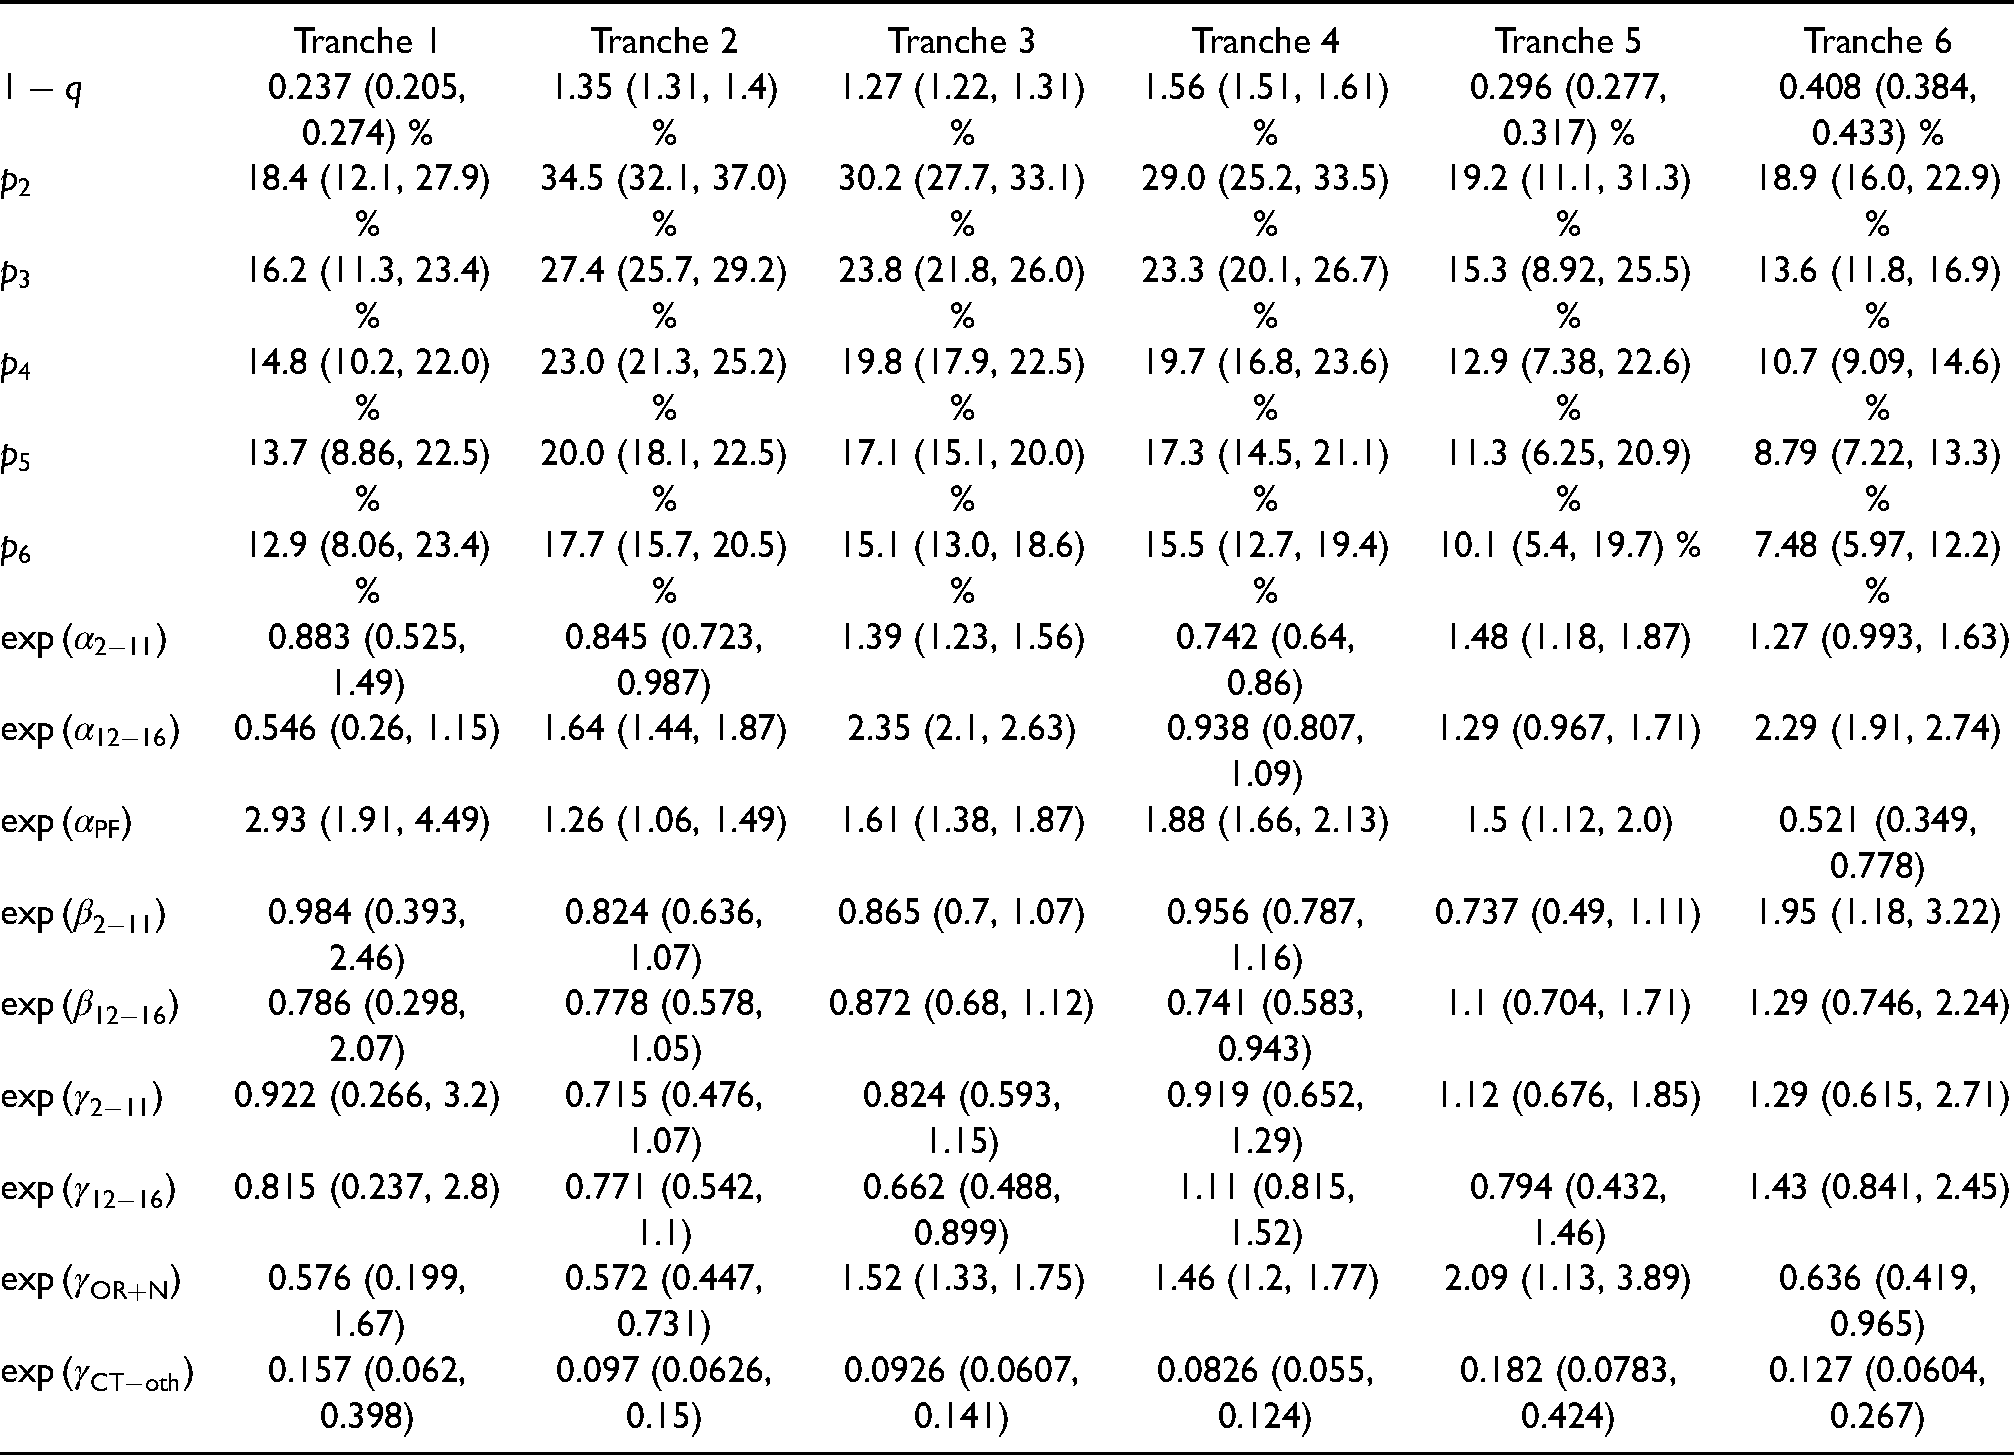
The baseline external probabilities of infection shown in the top plot of Figure 6 follow the rough pattern that would be expected from community prevalence and Tranche duration, with the notable exception of Tranche 6, when it is likely that vaccination significantly reduced the infection risk despite high prevalence. In terms of the baseline probabilities of within-household transmission in the bottom plot of Figure 6, these are largely consistent in terms of overlapping credible intervals for Tranches 2 to 4, with Tranche 6 noticeably lower and with credible intervals that do not overlap with those for Tranches 2 to 4, likely due to the impact of vaccination (and despite the emergence of the Delta variant). The low-prevalence Tranches 1 and 5 have large credible intervals, so are hard to distinguish statistically from the other tranches, despite having lower point estimates. It is worth noting that for periods of low prevalence following periods of high prevalence, we expect lower viral loads on average as noted by Hay et al., 46 and this might impact on overall transmissibility estimates.
Turning to Figure 7, we see that ‘other’ patterns of gene positivity (besides OR
In terms of child susceptibility and transmissibility, there is no strong evidence for an effect. While it is plausible that non-vaccination of children would lead to increasing their relative susceptibility at later times, this is consistent with the Tranche 6 results but not strongly evidenced by them.
For patient-facing staff, external risk of infection has been consistently high until reduced in Tranche 6, most likely due to the impact of vaccination. For children, external risk of infection is generally raised compared to baseline when schools are open, with the exception of primary school aged children before the emergence of Alpha. Whether this change in association is due to some causal factor not accounted for here, or is related to the new variants spreading more efficiently amongst young children than wildtype, requires further investigation.
Limitations and directions for future work
While we have taken many steps to ensure that the results presented here are as robust as possible, there are key limitations to the analysis that need to be borne in mind. The main one of these is failures in ascertainment of positives and other missingness in the longitudinal design in question. The most likely consequence of this will be to depress susceptible-infectious transmission probability estimates. One theoretical approach to deal with this would be imputation of the transmission tree as suggested by Demiris and O’Neill, 11 but this is likely to be too computationally intensive to be practical in the current context. Another would be analytical work to include failure of ascertainment into the likelihood function as in House et al., 15 however it is unclear how to model ascertainment probabilistically in a tractable manner. A data-driven approach would be to try to include positives from other sources such as Test and Trace case data or self-reported episodes of illness. There is also a harder to quantify potential bias of non-participation in the study, particularly if this is with respect to some factor that is not measured.
Another important limitation is the possibility that other features, for example the geographical region that households are in, more detailed information about viral load and symptoms, or information about the physical structure of the household, might play an important explanatory role in the associations observed. Finally, there are possible refinements of the work: trends in external infection over time could be modelled as a flexible functional form (e.g. a spline as in 24 ); extra features could be added, and features selected using formal criteria, including relaxing of the Cauchemez assumption to allow transmission probabilities to depend in a general manner on household size, and explicit correction to attack rates due to shrinking and growing epidemics could be made as proposed by Ball and Shaw 48 and Shaw 49 ; model parameters – for example, baseline transmission probabilities – could be shared across tranches; the work could be extended to Wales, Scotland and Northern Ireland; more formal analysis of causal pathways could be performed; and improvements could be made in implementation data processing, model evaluation through improved linear algebra, and fitting algorithm. These and other directions should be the subject of future studies.
Footnotes
Acknowledgements
All Authors would like to thank the ONS CIS team. TH and LP would like to thank Frank Ball for extremely valuable comments on the work. TH, HR and LP would like to thank members of the JUNIPER consortium for helpful comments on the work. The views expressed are those of the authors and not necessarily those of their employers, funders, the National Health Service, NIHR, Department of Health, UKHSA, Office for National Statistics, or ONS Data Science Campus.
Declaration of conflicting interests
The authors declared no potential conflicts of interest with respect to the research, authorship and/or publication of this article.
Funding
The ONS CIS is funded by the Department of Health and Social Care with in-kind support from the Welsh Government, the Department of Health on behalf of the Northern Ireland Government and the Scottish Government. TH is supported by the Royal Society (grant number INF/R2/180067). LP is supported by the Wellcome Trust and the Royal Society (grant number 202562/Z/16/Z). TH, HR and LP are supported by the UK Research and Innovation COVID-19 rolling scheme (grant number EP/V027468/1). TH and LR are supported the JUNIPER consortium (grant number MR/V038613/1) as well as the Alan Turing Institute for Data Science and Artificial Intelligence. SB is supported by the Wellcome Trust, the Medical Research Council and UK Research and Innovation. KBP and ASW are supported by the National Institute for Health Research Health Protection Research Unit (NIHR HPRU) in Healthcare Associated Infections and Antimicrobial Resistance at the University of Oxford in partnership with Public Health England (PHE) (NIHR200916). KBP is also supported by the Huo Family Foundation. ASW is also supported by the NIHR Oxford Biomedical Research Centre, by core support from the Medical Research Council UK to the MRC Clinical Trials Unit (MC_UU_12023/22) and is an NIHR Senior Investigator. RE is funded by HDR UK (grant number MR/S003975/1), the MRC (grant number MC_PC 19065) and the NIHR (grant number NIHR200908).