
Abstract
When comparing the risk of a post-infection binary outcome, for example, hospitalisation, for two variants of an infectious pathogen, it is important to adjust for calendar time of infection. Typically, the infection time is unknown and positive test time used as a proxy for it. Positive test time may also be used when assessing how risk of the outcome changes over calendar time. We show that if time from infection to positive test is correlated with the outcome, the risk conditional on positive test time is a function of the trajectory of infection incidence. Hence, a risk ratio adjusted for positive test time can be quite different from the risk ratio adjusted for infection time. We propose a simple sensitivity analysis that indicates how risk ratios adjusted for positive test time and infection time may differ. This involves adjusting for a shifted positive test time, shifted to make the difference between it and infection time uncorrelated with the outcome. We illustrate this method by reanalysing published results on the relative risk of hospitalisation following infection with the Alpha versus pre-existing variants of SARS-CoV-2. Results indicate the relative risk adjusted for infection time may be lower than that adjusted for positive test time.
1 Introduction
Consider the problem of estimating the distribution of time between a first event (e.g. becoming infected with SARS-CoV-2) and a second event (e.g. testing positive for the virus) in the population of individuals who ultimately experience the second event. We shall call this time the ‘inter-event time’ or ‘delay’. Estimating this distribution may be complicated by the first event time not being observed and/or the available data being right-truncated on the second event time, due to only sampling individuals who experience the second event by a particular calendar time.
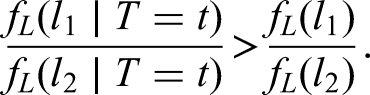
It has long been known that the inter-event times in the population of individuals who have experienced the second event before a given calendar time tend to be shorter than in the population of all individuals (who eventually experience the second event).1–3More precisely, the conditional probability that the inter-event time is less than
It has also been noted that the conditional distribution of inter-event time given the actual calendar time of the second event depends on the marginal distribution of the first event time.4–6 In particular, if the first event is generated by a Poisson process whose rate is increasing with calendar time, then the conditional distribution of the inter-event time given the calendar time of the second event is shifted towards zero compared to the unconditional distribution. On the other hand, if the rate is decreasing, the conditional distribution of the inter-event time is shifted away from zero compared to the unconditional distribution. This means that in the context of an infectious disease the time from infection (first event) to positive test (second event) in those who test positive at a given calendar time tends to be shorter than average when the incidence of infection is rising, and longer than average when the incidence is falling.
Now consider a third variable, which is measured at, or after, the time of the second event and is correlated with the inter-event time. Just as the distribution of inter-event time is affected by conditioning on the calendar time of the second event, so might the distribution of this variable. For example, an infected individual’s viral load at time of positive test is a function of time since infection. Rydevik et al. 5 observed that this relation could be used to estimate an individual’s infection time from that individual’s viral load at the time of testing positive. Hay et al. 6 used this same idea to estimate the pattern of incidence of infection in the population from data on the distribution of viral load (measured as the cycle threshold) in a random sample of individuals who tested positive on a given day. If the mean viral load is high, this suggests most of the sampled individuals were infected recently, which is consistent with a rising incidence of infection. Conversely, if the mean viral load is low, this suggests less recent infection, and so a falling incidence. Hay et al. 7 investigated using such data to estimate simultaneously the pattern of incidence of infection and the dependence of the viral load on the time since infection. Similar work had previously been done in the field of HIV/AIDS (e.g. Authors in8–10).
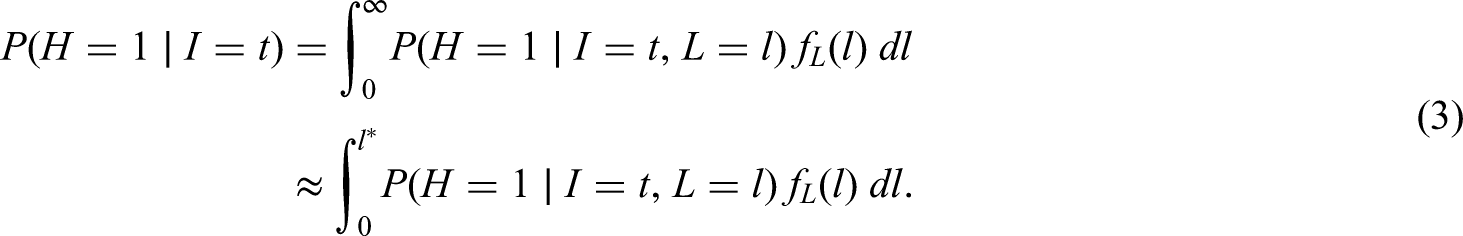
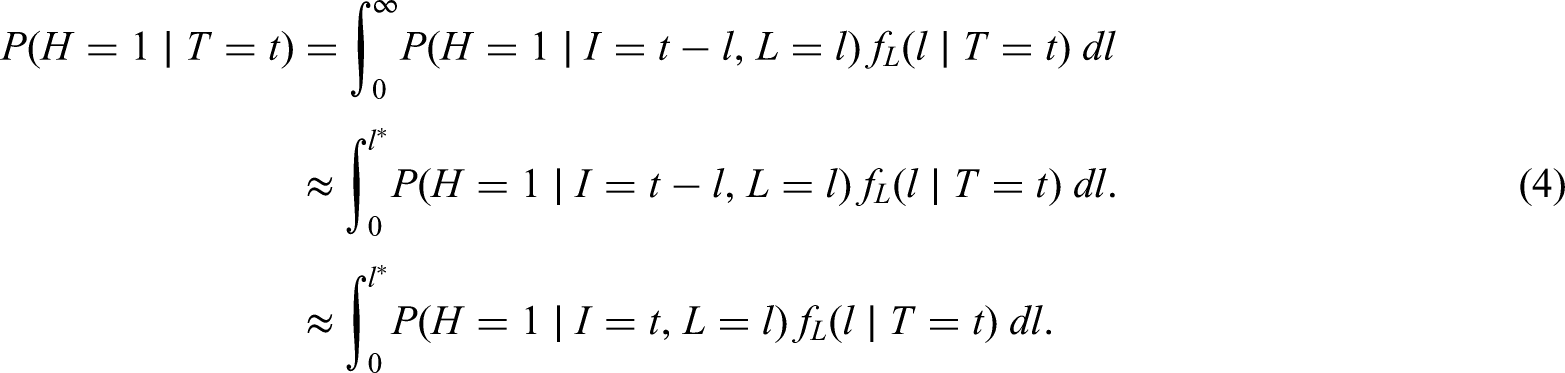
In the present article, we consider the estimation of the distribution of a third variable where this variable is a binary outcome of interest. An association between this binary outcome and the inter-event time could arise due to factors that determine both. We take the first and second events to be infection and positive test, respectively, and the binary outcome to be hospitalisation within 14 days of the positive test, although what follows would apply to any other binary outcome, for example, death within 28 days of a positive test. Individuals with more severe infections may tend to experience symptom onset sooner after infection – and consequently be tested earlier – than average and also be more likely to become hospitalised. In this situation, the hospitalisation risk (i.e. the proportion ultimately hospitalised) in individuals who test positive before a particular calendar time would be higher than the risk in all individuals who eventually test positive. More importantly for this article, the hospitalisation risk in individuals who test positive at a particular calendar time will differ from the risk in all individuals who eventually test positive (unless the incidence of infection is constant over time). If the incidence of infection is rising, the former risk will be higher than the latter; if incidence is falling, it will be lower.
This dependence of the hospitalisation risk on the trajectory of incidence of infection is particularly relevant for any investigation of how the risk is changing over calendar time. Ideally, such an investigation might involve comparing the risks for individuals with different calendar times of infection. If, as is likely, infection times are unknown, it would be natural to instead compare the risks for individuals with different calendar times of positive test. The difficulty with interpreting this latter comparison is that, as noted above, even if the risk does not vary by calendar time of infection, it will depend on calendar time of positive test.
Another situation where one might condition on calendar time of positive test is when comparing the risks associated with two variants of a given pathogen, in this case SARS-CoV-2. Here, controlling for (i.e. conditioning on) time of infection would be important, because the ‘exposure’ (i.e. a binary variable for the variant) and the outcome (hospitalisation) may both depend on calendar time. The exposure would depend on calendar time if the ratio of the incidence rates of infection with the two variants varied over time. That would be the case if, for example, one variant emerged earlier but the other variant later became dominant. The hospitalisation outcome would depend on calendar time if measures designed to reduce the need for hospitalisation and/or policies on hospital admission changed over time. Failure to control for infection time when comparing the risks of hospitalisation for the two variants would mean comparing the risk in individuals infected with one variant, whose infection times may have been predominantly when pre-hospital treatments were less effective and/or hospital admission more encouraged, with the risk in individuals infected with the other variant, whose infection times were mostly when pre-hospital treatments were better or hospital admission more restricted. If infection times are unknown, it would be natural to control instead for the time of positive test as a proxy for infection time. The difficulty with this approach is that, even if the hospitalisation risk is the same for both variants and does not depend on the time of infection, once we condition on calendar time of positive test a variant that has increasing incidence of infection will appear to have a higher risk than a variant that has a decreasing incidence.
Numerous studies have compared the risks of hospitalisation, intensive care unit admission and/or death in individuals infected with two variants of SARS-Cov-2 (either Alpha vs. pre-existing non-Alpha or Delta vs. Alpha), adjusting for calendar time of positive test, for example, the authors in.11–22 In all these studies, the incidence of one variant has been rising while the incidence of the other has been falling or has been rising at a slower rate.
In this article, we describe in detail why and how the conditional risk of hospitalisation given time of positive test depends on the trajectory of incidence of infection, even when the conditional risk given time of infection does not. We also propose an easily implemented method that provides an indication of how much an estimate of the risk conditional on the positive test time might differ from the estimate one would have obtained if it had been possible to condition on the infection time. This method involves calculating the risk conditional on a shifted positive test time. For each individual who is not ultimately hospitalised, this shifted test time is the same as the actual positive test time, that is, there is no shift. However, for each individual who is ultimately hospitalised, the shifted time equals the actual positive test time plus the difference between the mean time from infection to positive test in individuals who do not become hospitalised and the mean time in individuals who do become hospitalised. This ensures that the shifted time from infection to positive test is uncorrelated with the hospitalisation outcome. Because this difference between mean times is unknown, our method requires the user to specify a range of plausible values for it.
The structure of the article is as follows. Section 2 defines our notation. Section 3 describes why and how the distribution of the delay conditional on the calendar time of positive test depends on the incidence of infection. Section 4 goes on to explain how this dependence affects the conditional risk of hospitalisation given calendar time of positive test. We introduce our proposed method in Section 5, and its performance is studied in Section 6. Practical application of the method is detailed in Section 7, and Section 8 illustrates its use on COVID-19 data from England. We conclude with a discussion in Section 9.
2 Notation
We shall consider the population to be everyone who is at risk of infection from some calendar time zero. Time can be measured discretely or continuously. Suppose for now that all infections result in positive tests. In Section 9, we shall discuss the consequences of violation of this assumption. If an individual has two or more separate episodes of infection, we only consider the first episode.
For each individual in the population, let
3 Delay distribution conditional on test time
In this section and Section 4, we shall assume, for simplicity, that


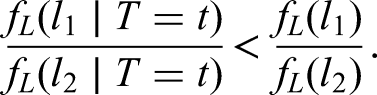
Conversely, if the incidence of infection is decreasing,
Suppose half of infected individuals test positive on the day after they are infected and the other half test positive two days after they are infected. That is,
Illustration of Example 1. Crosses show numbers of infections. Black and white circles represent cases with delays of 1 and 2 days, respectively. In left-hand graph, infection incidence is increasing. A total of 100 individuals are infected on day 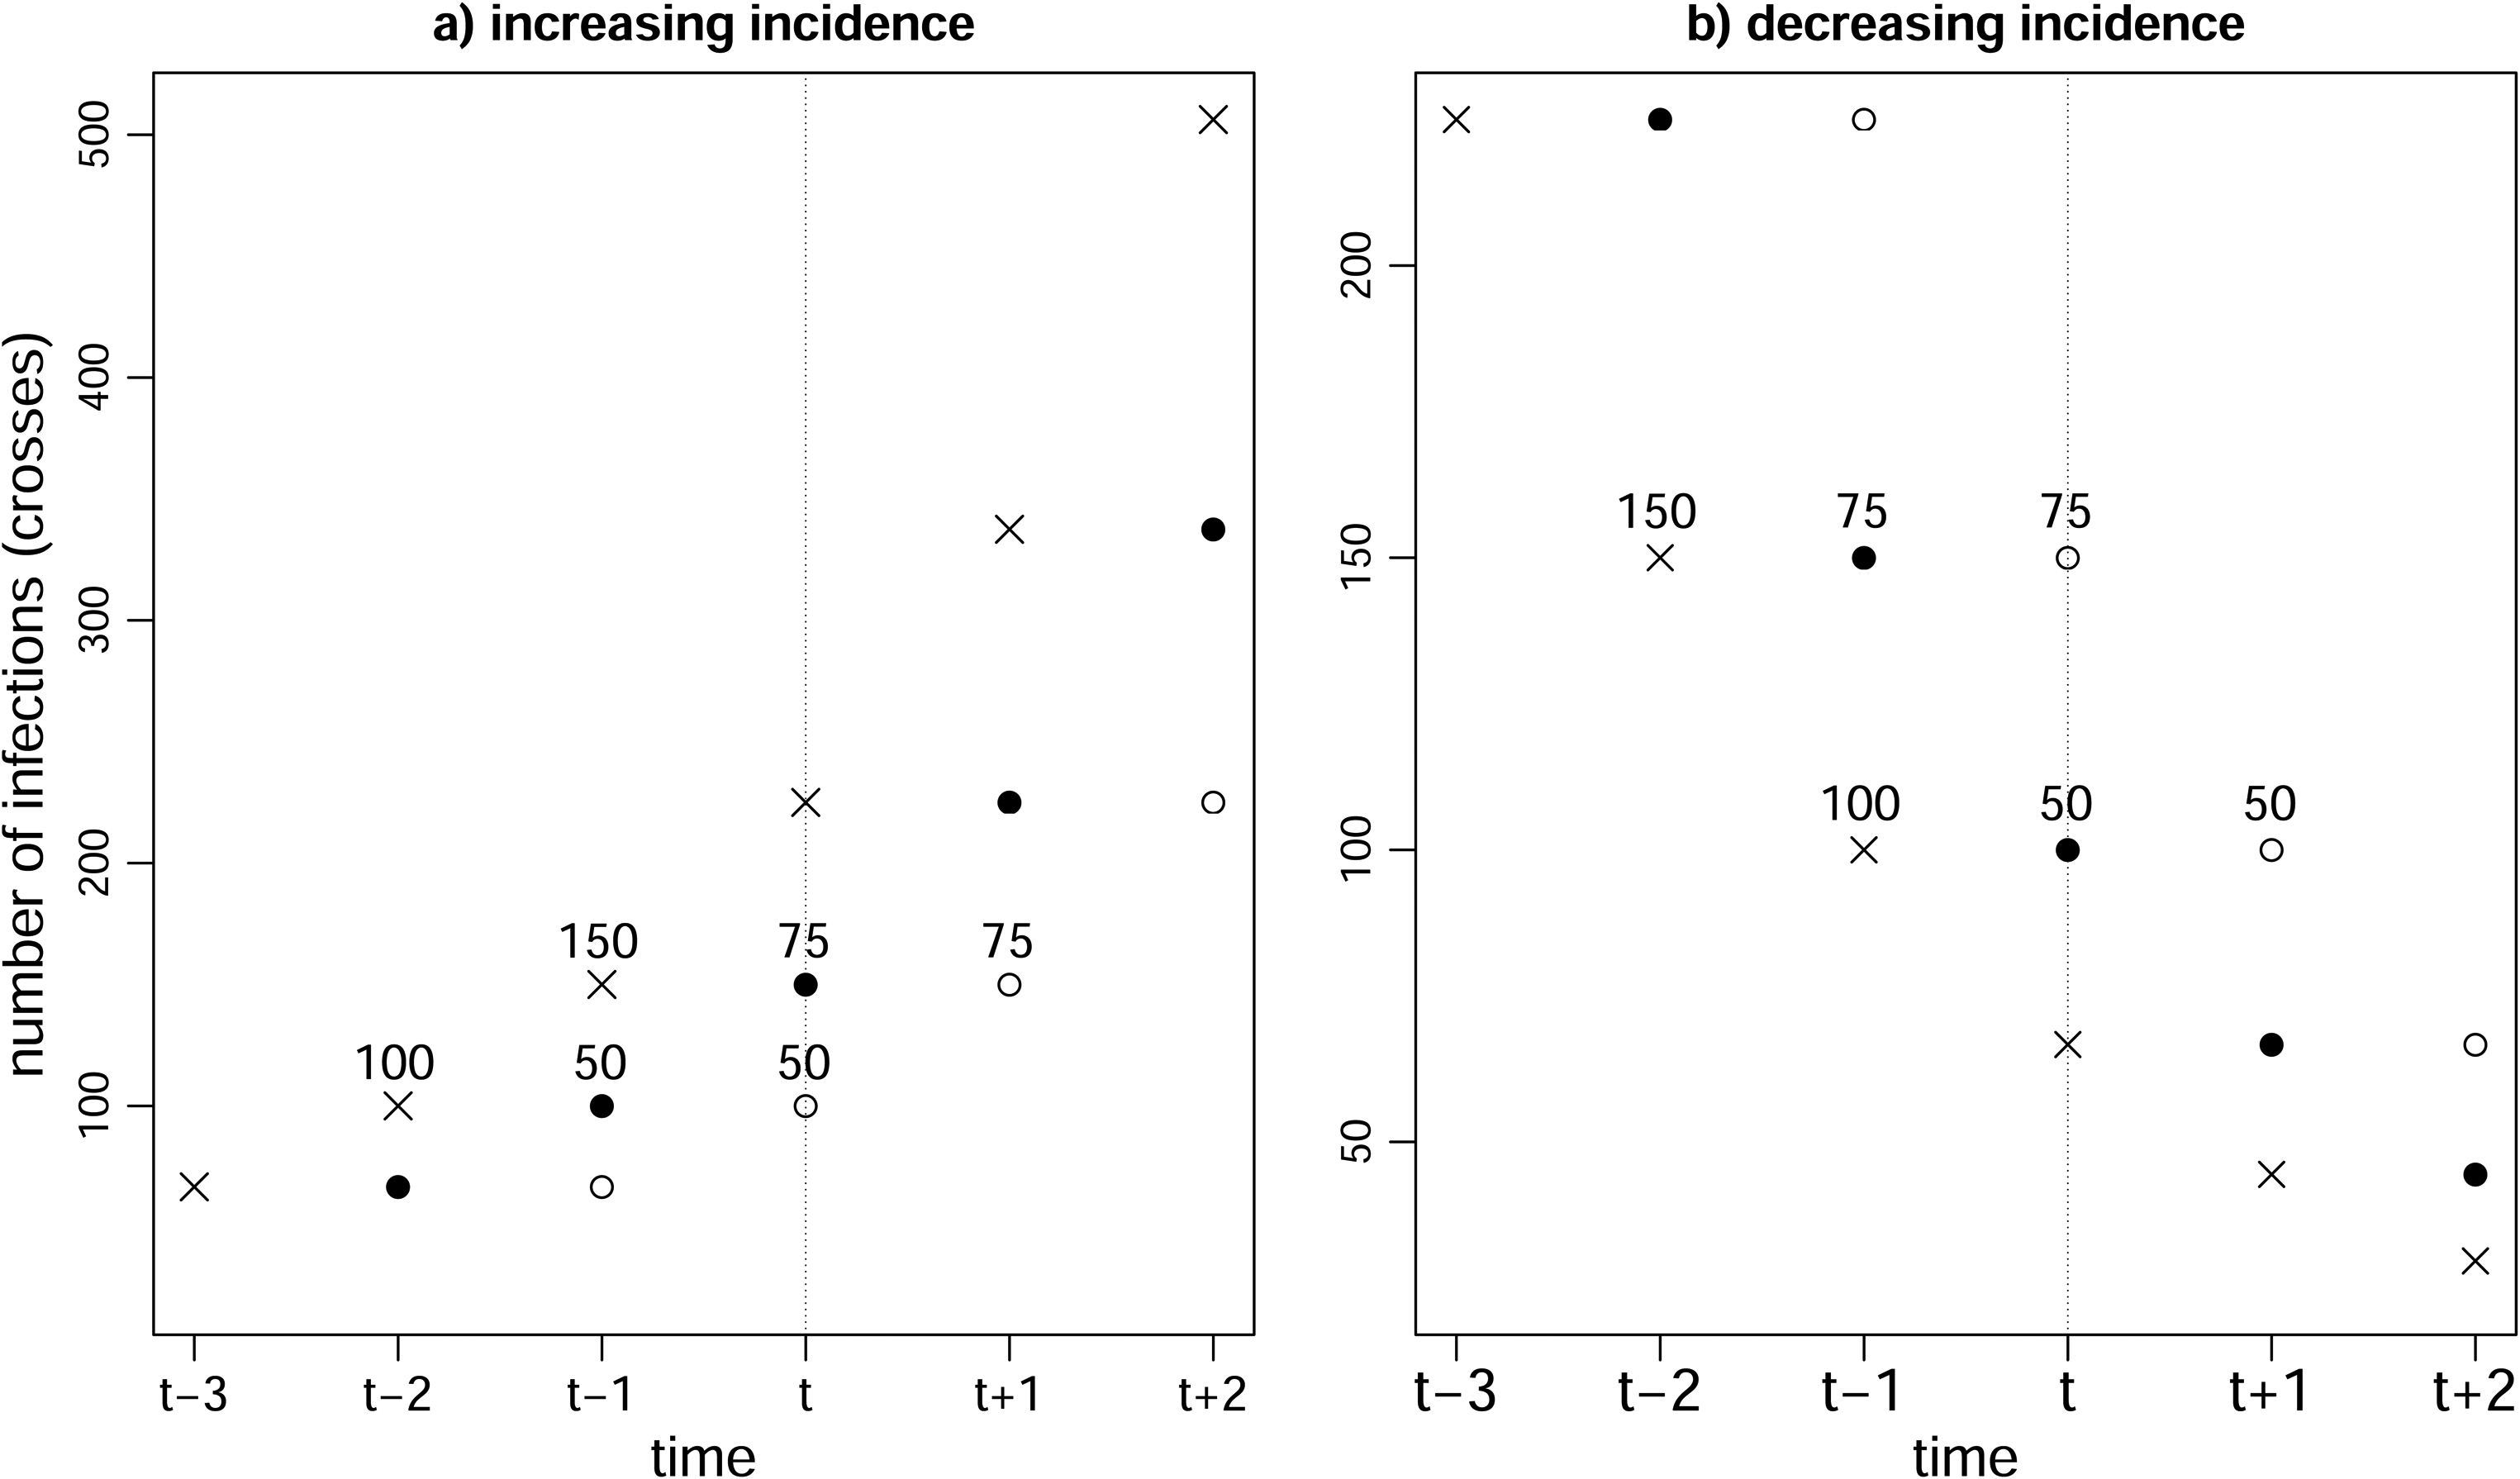
Verity et al.
23
(see also Seaman et al.
3
) showed that if infections are generated by a Poisson process with rate at time
Figure 2 shows how the hospitalisation risk conditional on positive test time varies according to positive test time in a scenario where the incidence of infection first rises then falls, then rises and falls again. Here, the hospitalisation risk conditional on infection time is 5% irrespective of the infection time, and the mean time from infection to positive test is shorter in individuals who are ultimately hospitalised than in those who are not.
Hospitalisation risk conditional on positive test time (solid black line) when risk conditional on infection time is 0.05 (green line). Incidence of infection is shown (dotted line). Time from infection to positive test is assumed to have a gamma distribution with mean 4 and variance 8 for the ultimately hospitalised individuals and a gamma distribution with mean 7 and variance 14 for the ultimately non-hospitalised individuals.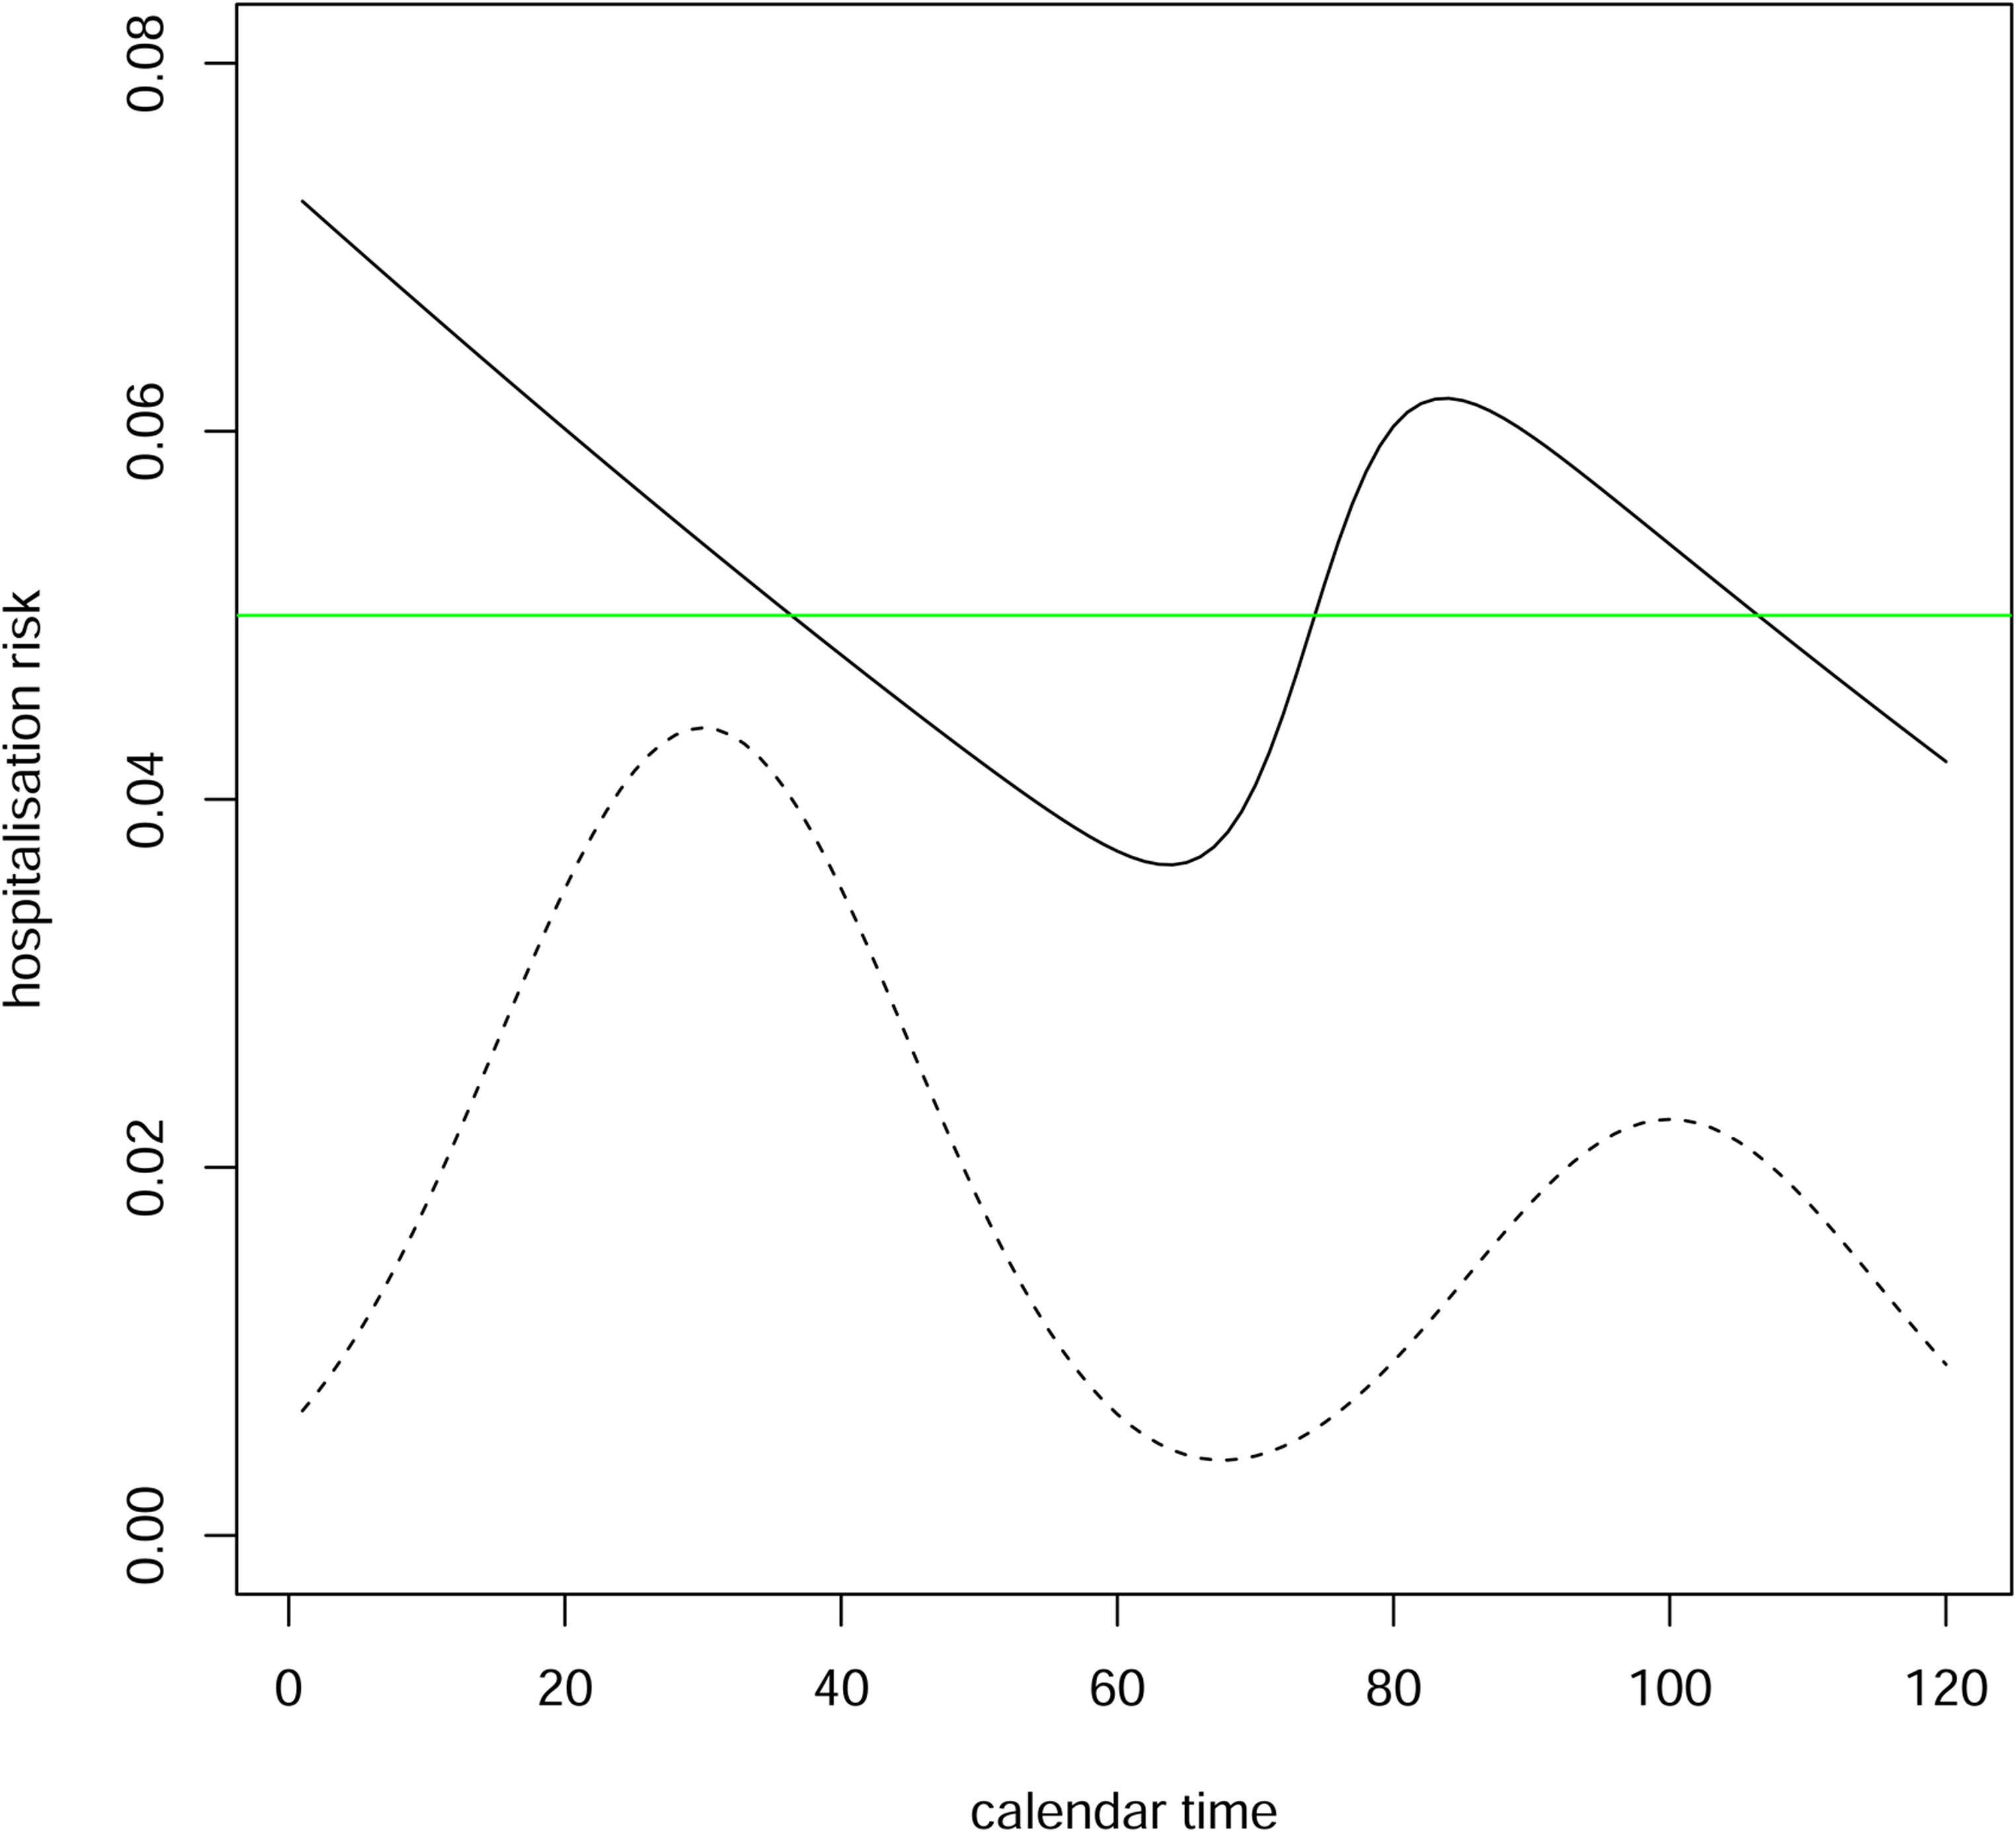
4 Hospitalisation risk conditional on test time
As we have seen, conditioning on the positive test time changes the distribution of the delay in circumstances where the delay is independent of the time of infection. If hospitalisation is more common in individuals with shorter delays than in those with longer delays, that is,
Suppose that almost all delays are at most
Example 1 continued: Suppose
5 Hospitalisation risk conditional on infection time plus random delay
Now suppose we had a different proxy of infection time such that the difference between this proxy and the actual infection time were (unlike the difference between positive test time and infection time) not associated with the hospitalisation outcome. If we conditioned on this proxy, we might achieve the goal of approximately adjusting for time of infection without creating a measure of hospitalisation risk that depends on the trajectory of the infection incidence. We now describe such a proxy.
Suppose, hypothetically, that each individual who becomes infected at time
We cannot actually carry out this assignment in practice, because we do not observe

Assumption 1 means that the distribution of time from infection to positive test (conditional on time of infection) in ultimately hospitalised individuals equals the corresponding distribution in ultimately non-hospitalised individuals shifted by
If Assumption 1 holds, then (see the Appendix for proof)

The hospitalisation risk conditional on
In practice, it is unlikely that we shall know the true value of
Assumption 1 states that the distribution of delay in hospitalised individuals equals the distribution of delay in non-hospitalised individuals shifted by some number (
6 Investigation of proposed method
Suppose the incidence of infection at time
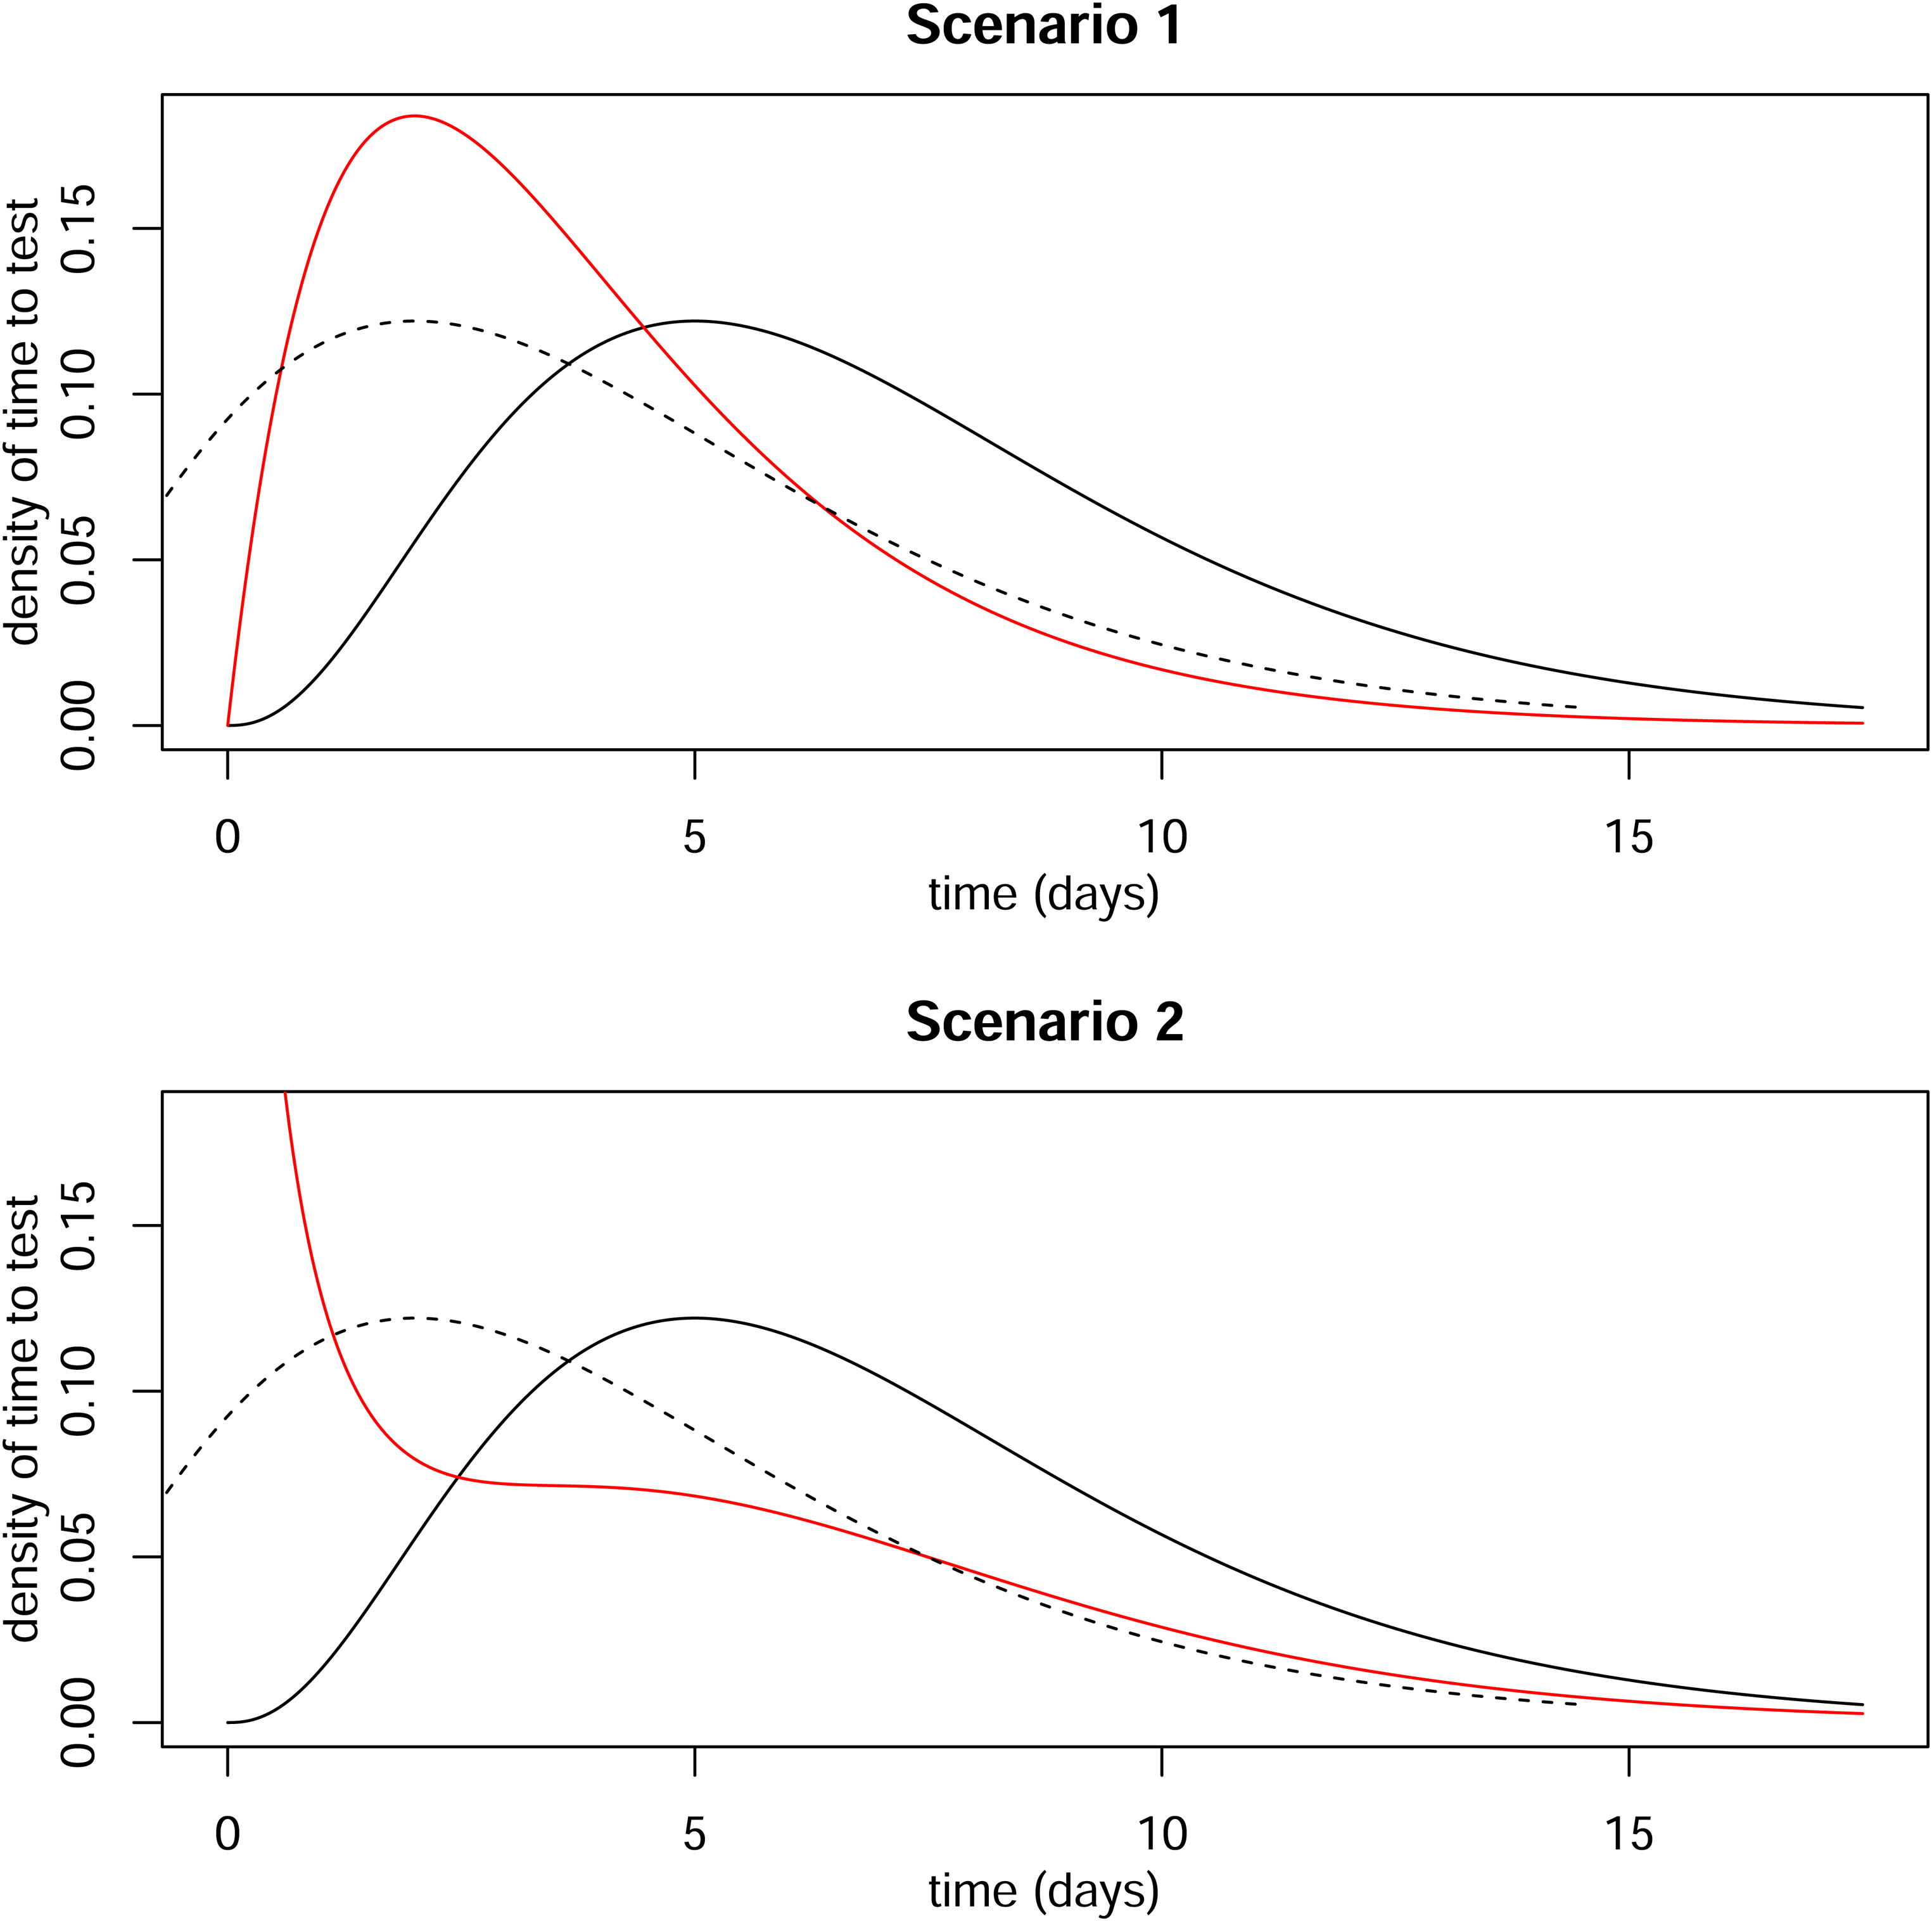
Distributions of time from infection to positive test. Solid black line is distribution for ultimately non-hospitalised individuals. Dotted line is same distribution shifted by three days. Red line is distribution for ultimately hospitalised individuals.
The number of non-hospitalised individuals who test positive at time
Similarly, the number of hospitalised individuals who test positive at time
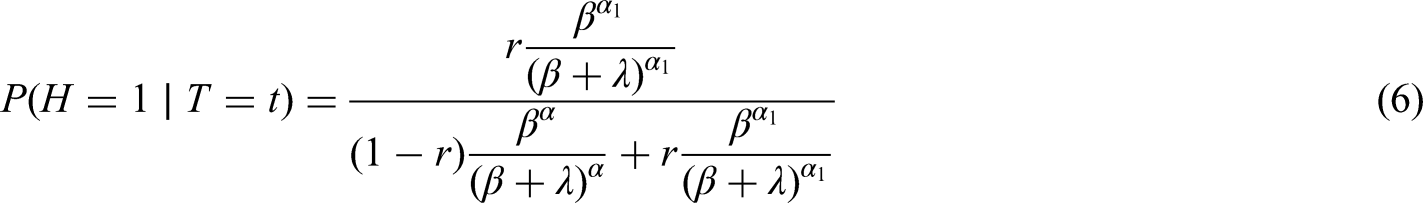
So, the risk when we condition on time of positive test
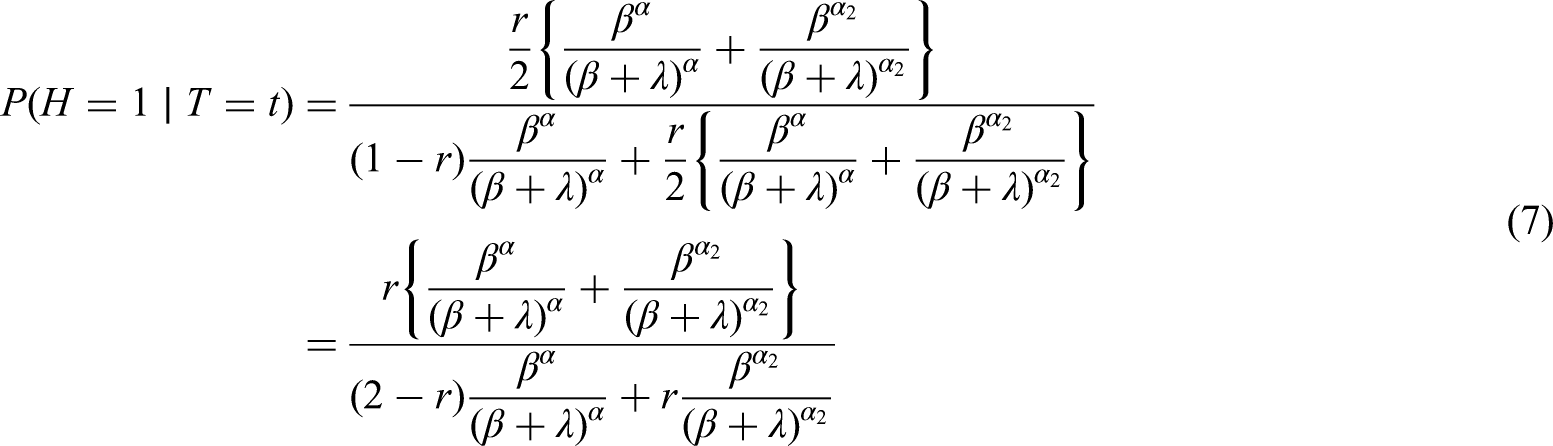
If we condition on
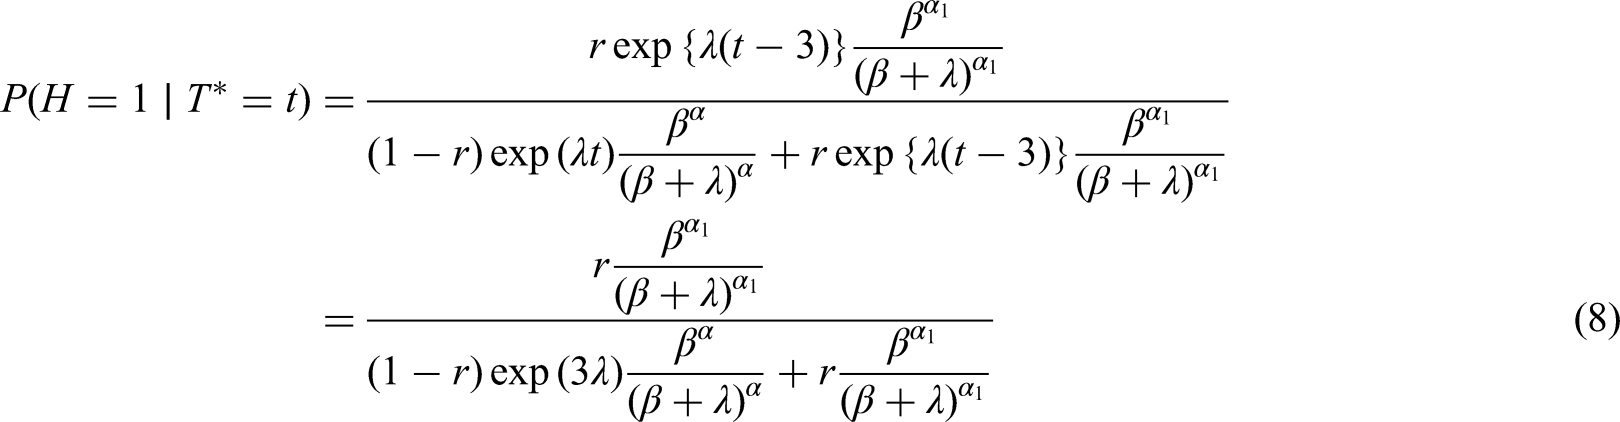
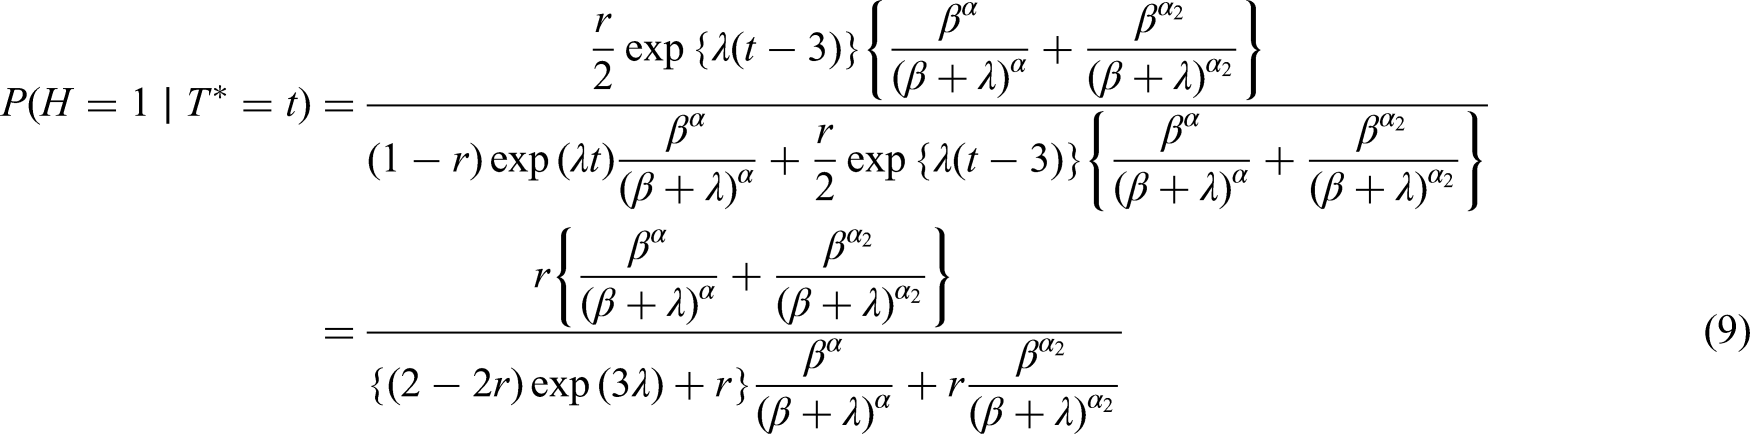
Table 1 shows the results of applying equations (6) to (9) in Scenarios 1 and 2, when
Risks when adjusted for
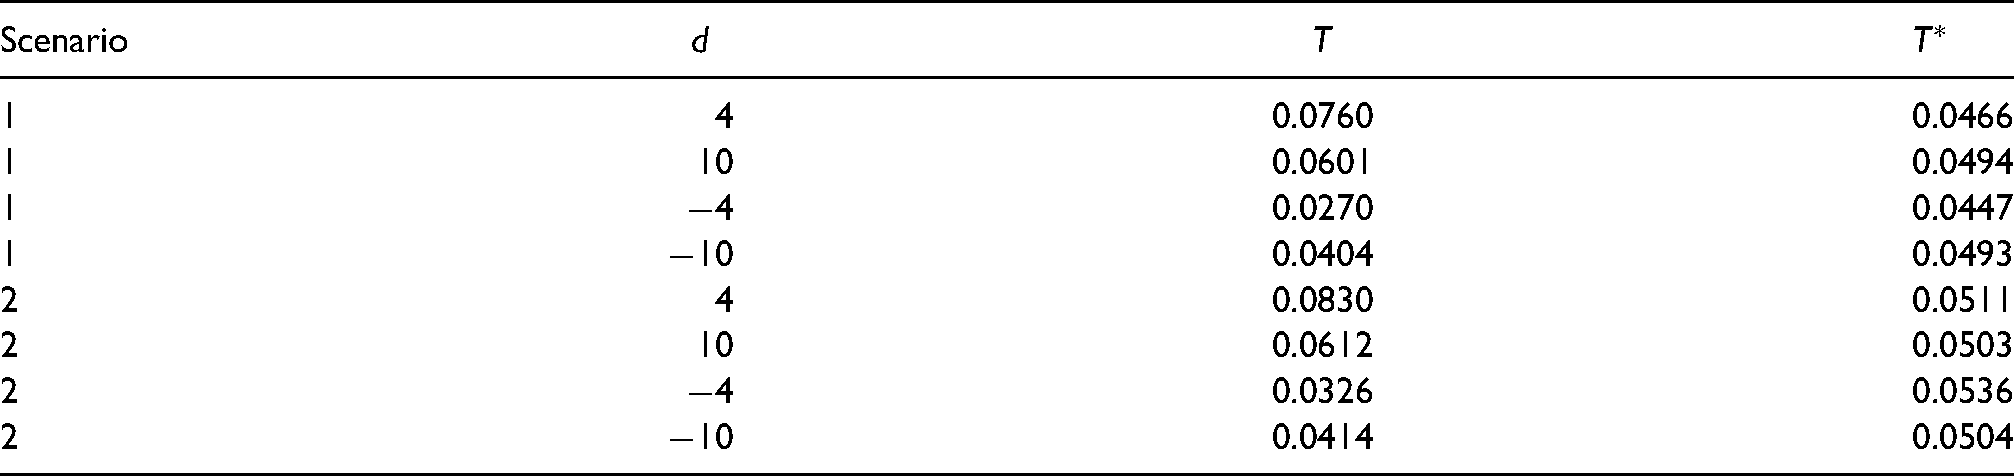
It also shows the results when
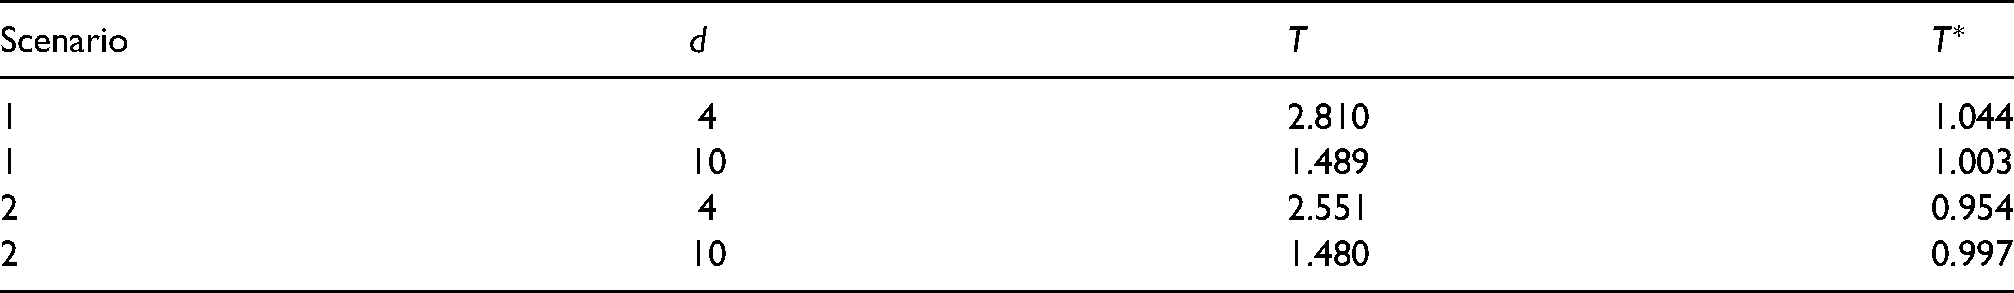
Finally, Table 2 shows the risk ratios that Table 1 implies when comparing two variants both of which have the same risk
Risk ratios when adjusted for
7 Practical implementation when comparing risks of two variants
In practice, when comparing the risks of hospitalisation (or other post-infection outcome, like death) associated with two variants, researchers may adjust not only for positive test time but also for variables like age and ethnicity. In this section, we detail how researchers can apply our proposed sensitivity analysis in this situation. We shall begin by assuming that the researchers are using logistic regression (as did, e.g. the authors in15,16,22), and then go on to address the slightly more complicated situation where there is administrative censoring of the outcome and the researchers are using Cox regression or parametric survival regression (as did, e.g. the authors in14,17–21).
Let
To apply our method, assume that 
So far, we have assumed that the binary outcome
Figure 4 summarises this procedure for carrying out the sensitivity analysis.
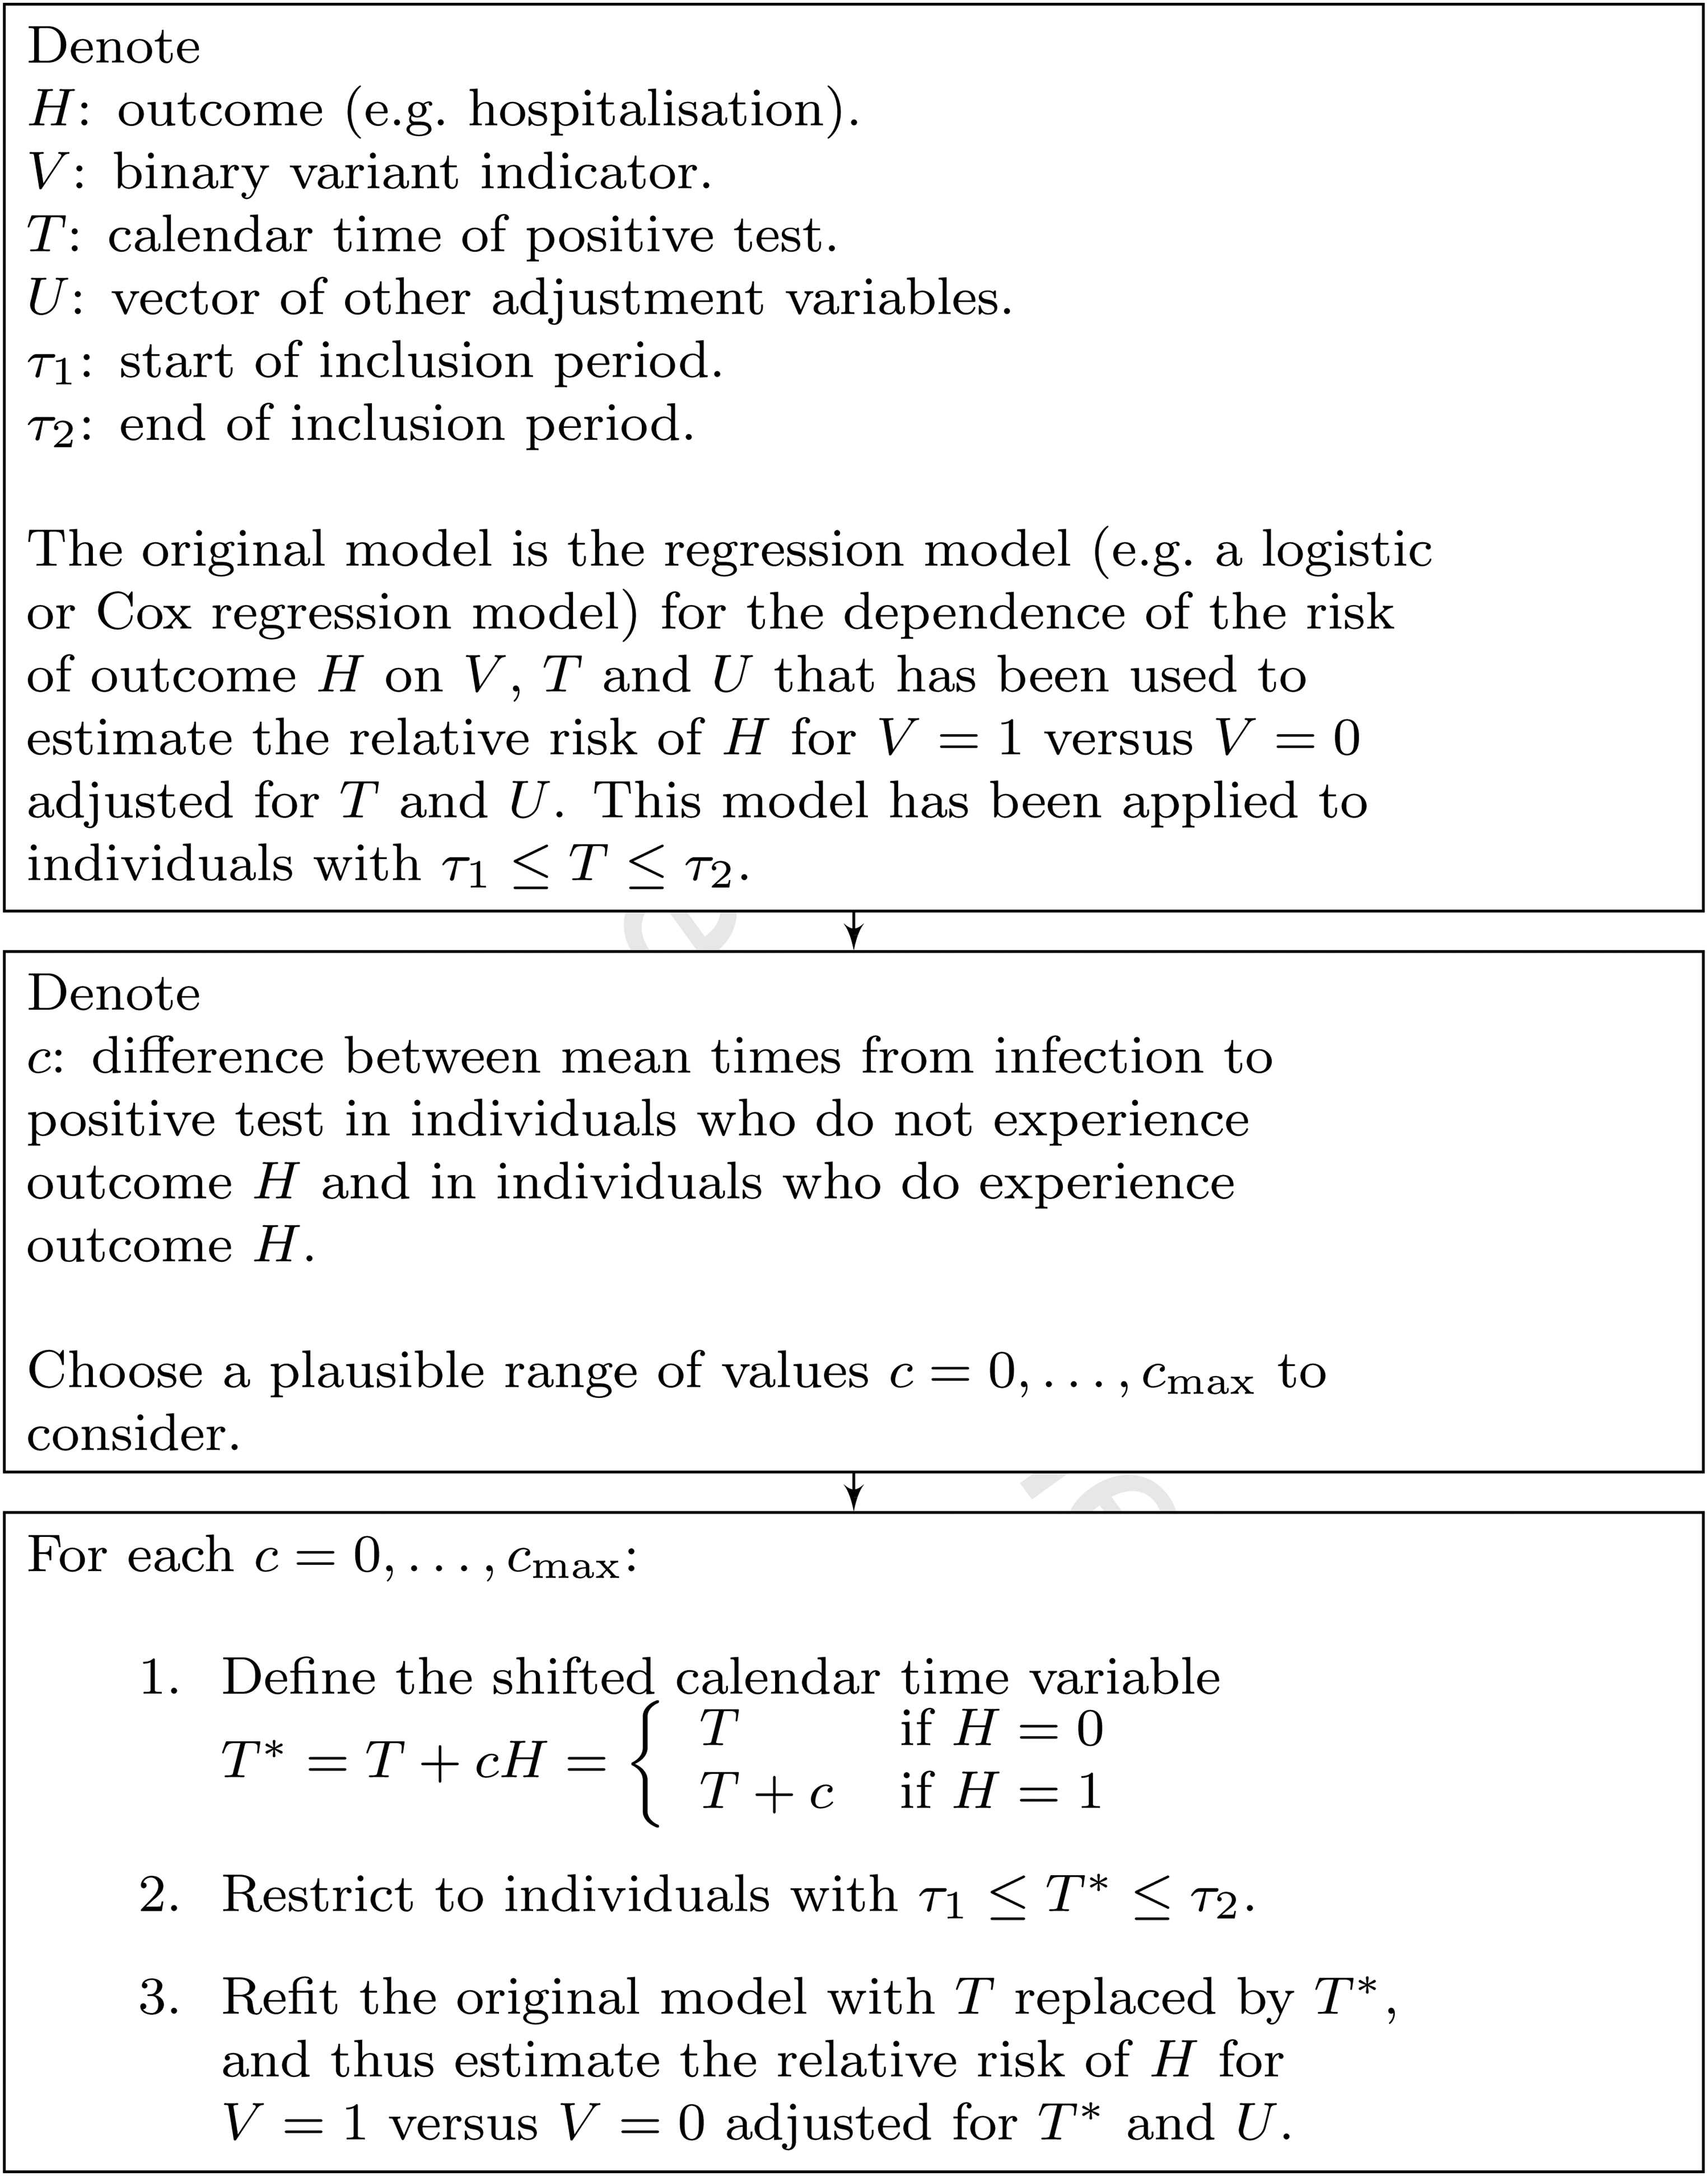
Summary of implementation of proposed sensitivity analysis.
8 Application to COVID-19 hospitalisation and mortality data
8.1 Hazard ratio conditional on
and
Based on record linkage of routine healthcare data in England, Nyberg et al. (2021) recently reported a higher risk of hospital admission and mortality in COVID-19 cases infected with the Alpha variant (B.1.1.7) than in cases infected with pre-existing non-Alpha variants.
18
The study included data on 839,278 cases who had their first positive tests between 23 November 2020 and 31 January 2021 and whose positive test sample had been assessed for S gene target failure (SGTF). SGTF was used as a proxy test for the Alpha variant, and had positive and negative predictive values
The Alpha variant was first detected in England in November 2020. During the study period the prevalence of the Alpha variant among newly test-positive cases, as determined by SGTF, increased from 16% in the week commencing 23 November 2020 to 94% in the week commencing 25 January 2021, and the prevalence of the pre-existing variants decreased accordingly.
25
During this period, the number of cases of the Alpha variant had a considerably higher growth rate than the number of cases of non-Alpha variants.
26
So, the aforementioned HR of 1.52 conditional on the positive test time
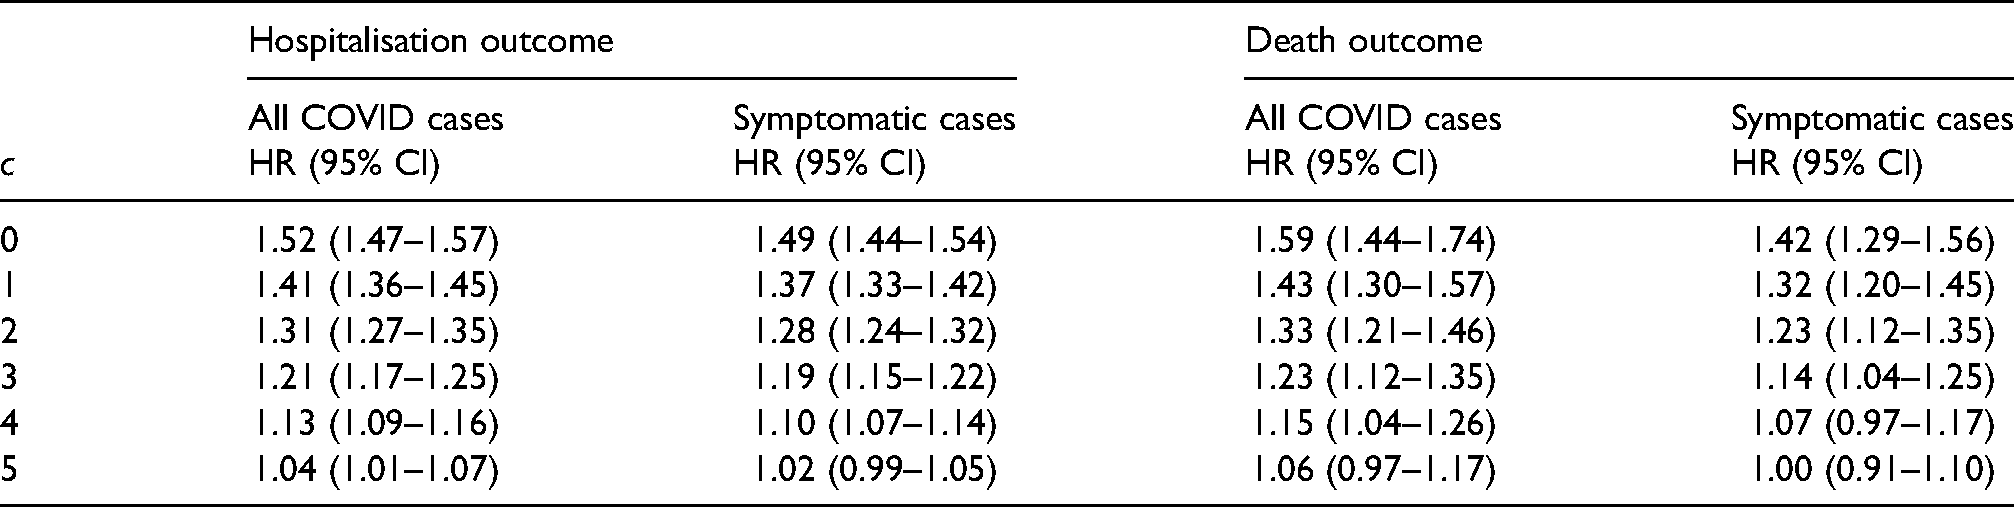
We reanalysed the study dataset to estimate the HRs conditional on
Hazard ratios for the two outcomes hospital admission and death (and 95% confidence intervals) conditional on
8.2 Plausible upper bound for c
We now consider what might be a plausible upper bound for
It has been estimated that the mean incubation time (i.e. time from infection to symptom onset) in cases who eventually experience symptoms is 5.74 days. 27 Since most of the cases in the data set were not (ultimately) hospitalised, this can be regarded as the mean incubation time in non-hospitalised cases who eventually experience symptoms. We assume that the mean incubation time in hospitalised cases (all of whom must have been symptomatic or pre-symptomatic at time of positive test) is less than or equal to the mean time in non-hospitalised cases who eventually have symptoms, but is not less than two days.
We shall assume that the mean time from infection to positive test in the 14.6% of (ultimately) non-hospitalised cases who were asymptomatic at time of positive test is not more than 12 days. This choice of 12 days is somewhat arbitrary, but does not seem unreasonable given that some of these cases will have been pre-symptomatic at time of positive test. It now follows that the mean time from infection to positive test in the non-hospitalised cases is not more than 8.8 days (i.e. mean incubation 5.74 days plus mean time from symptoms to test 2.5 days for the 85.4% of symptomatic cases, and 12 days for the 14.6% of asymptomatic cases). Assuming that the mean time from infection to positive test in the hospitalised cases is at least 4.5 days (i.e. mean incubation 2 days plus mean time from symptoms to test 2.5 days), it follows that a plausible upper bound for
8.3 Analysis of symptomatic cases
The analysis described above includes a proportion (14.5%) of cases who were asymptomatic prior to their positive test. We now consider a modified analysis that focuses on symptomatic cases. It is the same as the analysis above, except that we now exclude cases who were both asymptomatic prior to positive test and not (ultimately) hospitalised.
A total of 4.3% (36,233/839,278) of the cases were hospitalised. After excluding the 117,494 non-hospitalised cases who were asymptomatic at time of positive test, 5.0% (36,233/721,784) of the remaining cases were hospitalised. Column 3 of Table 3 shows the results from analysing this subgroup consisting of symptomatic and/or hospitalised pillar-two cases (henceforth referred to as ‘symptomatic cases’). Consistent with the results using the full dataset, the HR point estimates were
Using the same logic as described above, the mean time from infection to positive test in the symptomatic non-hospitalised cases is not more than 8.2 days (i.e. mean incubation 5.74 days plus mean time from symptoms to test 2.5 days). Assuming again that the mean time from infection to positive test in the hospitalised cases is at least 4.5 days, a plausible upper bound for
8.4 Mortality
Using the same stratified Cox regression approach, Nyberg et al. (2021) also considered mortality as a secondary outcome, and reported an adjusted HR of death within 28 days of 1.59 (95% CI 1.44–1.74) for Alpha versus non-Alpha. Columns 4 and 5 of Table 3 show the original (
9 Discussion
In this article, we have highlighted the difference between the risk of a binary post-infection outcome (which, in this paper, is hospitalisation) conditional on the time of infection
As with other sensitivity analysis approaches, for example, for addressing unmeasured confounding
28
and missing data,29,30 ours does not yield a single estimate of the risk. It does, however, provide an indication of how sensitive the estimated risk is to the epidemic phase. If the incidence of infection is constant over calendar time, the estimated risk will not change as
The proposed method is likely to be most useful when a range of plausible values can be specified for
The true value of
It would be straightforward in theory to allow
We have focused on an observed binary outcome
We have assumed that all infections result in a positive test. This is obviously not true in reality. However, this issue affects all studies of risks of post-infection outcomes in samples of individuals who have tested positive, and is not specific to this article. There is not a problem if those individuals who test positive are representative of all infected individuals. Otherwise, the estimated risks must be interpreted as risks conditional on eventually testing positive.
We have focused on a setting where most delays are measured in days or a small number of weeks. Here, researchers may view time of positive test as a good proxy for time of infection. In a setting where the mean delay is much larger or where there is a long tail in the delay distribution, both the actual positive test time
Finally, if additional information is available on the incidence of infection with each variant over time, it may be possible to estimate the hospitalisation risk without using data on positive test times. This could be done using deconvolution techniques, such as those developed in the 1980s and 1990s for back-calculation in the context of the HIV/AIDS epidemic. There the purpose was to estimate the distribution of HIV infection times from the observed distribution of AIDS onset times and an assumed-known distribution of time from infection to AIDS onset. For example, Rosenberg and Gail 31 described how to do this using software for Poisson regression with identity link function. In the context of the present article, the purpose would be to estimate, for each variant, the distribution of time from infection to hospitalisation from the observed distribution of hospitalisation times and an assumed-known distribution of infection times. It may be possible to do this by applying, for example, an adaptation of the Poisson regression method of Rosenberg and Gail with an additional offset term for the total number of infections observed so far.
Supplemental Material
sj-pdf-1-smm-10.1177_09622802221107105 - Supplemental material for Adjusting for time of infection or positive test when estimating the risk of a post-infection outcome in an epidemic
Supplemental material, sj-pdf-1-smm-10.1177_09622802221107105 for Adjusting for time of infection or positive test when estimating the risk of a post-infection outcome in an epidemic by Shaun R Seaman, Tommy Nyberg, Christopher E Overton, David J Pascall, Anne M Presanis and Daniela De Angelis in Statistical Methods in Medical Research
Supplemental Material
sj-R-2-smm-10.1177_09622802221107105 - Supplemental material for Adjusting for time of infection or positive test when estimating the risk of a post-infection outcome in an epidemic
Supplemental material, sj-R-2-smm-10.1177_09622802221107105 for Adjusting for time of infection or positive test when estimating the risk of a post-infection outcome in an epidemic by Shaun R Seaman, Tommy Nyberg, Christopher E Overton, David J Pascall, Anne M Presanis and Daniela De Angelis in Statistical Methods in Medical Research
Footnotes
Acknowledgements
We acknowledge the support of the UK Health Security Agency (UKHSA) Epidemiology and Modelling Cells in providing and discussing the data used. The authors received no financial support for the research, authorship and/or publication of this article.
Data availability
Declaration of conflicting interests
The authors declared no potential conflicts of interest with respect to the research, authorship and/or publication of this article.
Funding
This work was funded by UKRI Medical Research Council: core Unit funding (Seaman: MC UU 00002/10; De Angelis, Presanis: MC UU 00002/11), JUNIPER consortium (Overton, Pascall: MR/V038613/1), MRC UKRI / DHSC NIHR COVID-19 rapid response call (Presanis, De Angelis, Nyberg: MC PC 19074); by the Wellcome Trust and Royal Society (Overton, 202562/Z/16/Z); by the NIHR Health Protection Unit in Behavioural Science and Evaluation (De Angelis); and was supported by the NIHR Cambridge Biomedical Research Centre (BRC-1215-20014). The views expressed are those of the authors and not necessarily those of UKHSA, the NHS, the NIHR or the Department of Health and Social Care.
Supplemental material
Supplemental material for this article is available online.
Notes
Appendix: Proof of equations ( 5 ) and ( 10 )
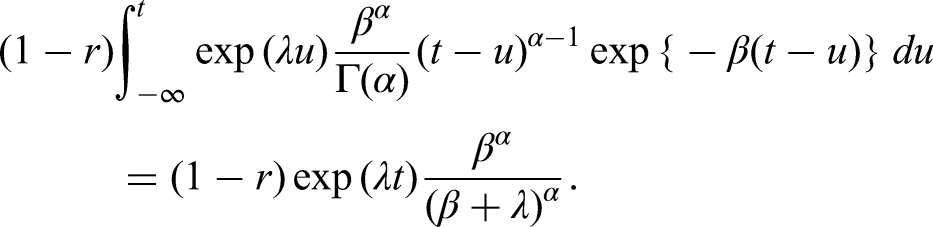
Since equation (5) is a special case of equation (10), it suffices to prove that the latter is implied by the equation
The probability distribution function of the observed data
References
Supplementary Material
Please find the following supplemental material available below.
For Open Access articles published under a Creative Commons License, all supplemental material carries the same license as the article it is associated with.
For non-Open Access articles published, all supplemental material carries a non-exclusive license, and permission requests for re-use of supplemental material or any part of supplemental material shall be sent directly to the copyright owner as specified in the copyright notice associated with the article.