
Abstract
Clinical trials often evaluate multiple outcome variables to form a comprehensive picture of the effects of a new treatment. The resulting multidimensional insight contributes to clinically relevant and efficient decision-making about treatment superiority. Common statistical procedures to make these superiority decisions with multiple outcomes have two important shortcomings, however: (1) Outcome variables are often modeled individually, and consequently fail to consider the relation between outcomes; and (2) superiority is often defined as a relevant difference on a single, on any, or on all outcome(s); and lacks a compensatory mechanism that allows large positive effects on one or multiple outcome(s) to outweigh small negative effects on other outcomes. To address these shortcomings, this paper proposes (1) a Bayesian model for the analysis of correlated binary outcomes based on the multivariate Bernoulli distribution; and (2) a flexible decision criterion with a compensatory mechanism that captures the relative importance of the outcomes. A simulation study demonstrates that efficient and unbiased decisions can be made while Type I error rates are properly controlled. The performance of the framework is illustrated for (1) fixed, group sequential, and adaptive designs; and (2) non-informative and informative prior distributions.
Keywords
1 Introduction
Clinical trials often aim to compare the effects of two treatments. To ensure clinical relevance of these comparisons, trials are typically designed to form a comprehensive picture of the treatments by including multiple outcome variables. Collected data about efficacy (e.g. reduction of disease symptoms), safety (e.g. side effects), and other relevant aspects of new treatments are combined into a single, coherent decision regarding treatment superiority. An example of a trial with multiple outcomes is the CAR-B (Cognitive Outcome after WBRT or SRS in Patients with Brain Metastases) study, which investigated an experimental treatment for cancer patients with multiple metastatic brain tumors. 1 Historically, these patients have been treated with radiation of the whole brain (Whole Brain Radiation Therapy; WBRT). This treatment is known to damage healthy brain tissue and to increase the risk of (cognitive) side effects. More recently, local radiation of the individual metastases (stereotactic surgery; SRS) has been proposed as a promising alternative that saves healthy brain tissue and could therefore reduce side effects. The CAR-B study compared these two treatments based on cognitive functioning, fatigue, and several other outcome variables. 1
Statistical procedures to arrive at a superiority decision have two components: (1) A statistical model for the collected data; and (2) a decision rule to evaluate the treatment in terms of superiority based on the modelled data. Ideally, the combination of these components forms a decision procedure that satisfies two criteria: Decisions should be clinically relevant and efficient. Clinical relevance ensures that the statistical decision rule corresponds to a meaningful superiority definition, given the clinical context of the treatment. Commonly used decision rules define superiority as one or multiple treatment difference(s) on the most important outcome, on any of the outcomes, or on all of the outcomes.2–5 Efficiency refers to achieving acceptable error rates while minimizing the number of patients in the trial. The emphasis on efficiency is motivated by several considerations, such as small patient populations, ethical concerns, limited access to participants, and other difficulties to enroll a sufficient number of participants. 6 In the current paper, we address clinical relevance and efficiency in the context of multiple binary outcomes and propose a framework for statistical decision-making.
In trials with multiple outcomes, it is common to use a univariate modeling procedure for each individual outcome and combine these with one of the aforementioned decision rules.2,3 Such decision procedures can be inefficient since they ignore the relationships between outcomes. Incorporating these relations in the modeling procedure is crucial as they directly influence the amount of evidence for a treatment difference as well as the sample size required to achieve satisfactory error rates. A multivariate modeling procedure takes relations between outcomes into account and can therefore be a more efficient and accurate alternative when outcomes are correlated.
Another interesting feature of multivariate models is that they facilitate the use of decision rules that combine multiple outcomes in a flexible way, for example via a compensatory mechanism. Such a mechanism is characterized by the property that beneficial effects are given the opportunity to compensate adverse effects. The flexibility of compensatory decision-making is appealing, since a compensatory mechanism can be naturally extended with impact weights that explicitly take the clinical importance of individual outcome variables into account. 3 With impact weights, outcome variables of different importances can be combined into a single decision in a straightforward way.
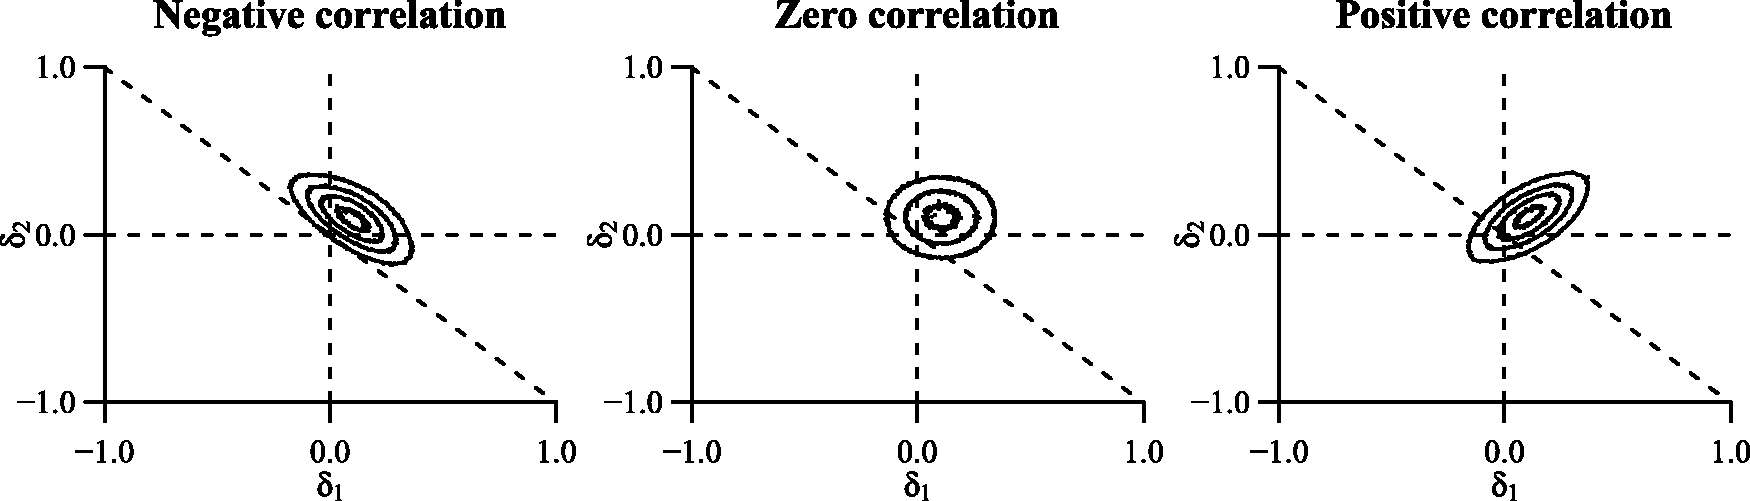
Compensatory rules do not only contribute to clinical relevance, but also have the potential to increase trial efficiency. Effects on individual outcomes may be small (and seemingly unimportant) while the combined treatment effect may be large (and important),7–9 as visualized in Figure 1 for fictive data of the CAR-B study. The two displayed bivariate distributions reflect the effects and their uncertainties on cognitive functioning and fatigue for SRS and WBRT. The univariate distributions of both outcomes overlap too much to clearly distinguish the two treatments on individual outcome variables or a combination of them. The bivariate distributions, however, clearly distinguish between the two treatments. Consequently, modeling a compensatory treatment effect with equal weights (visualized as the diagonal dashed line) would provide sufficient evidence to consider SRS superior in the presented situation.
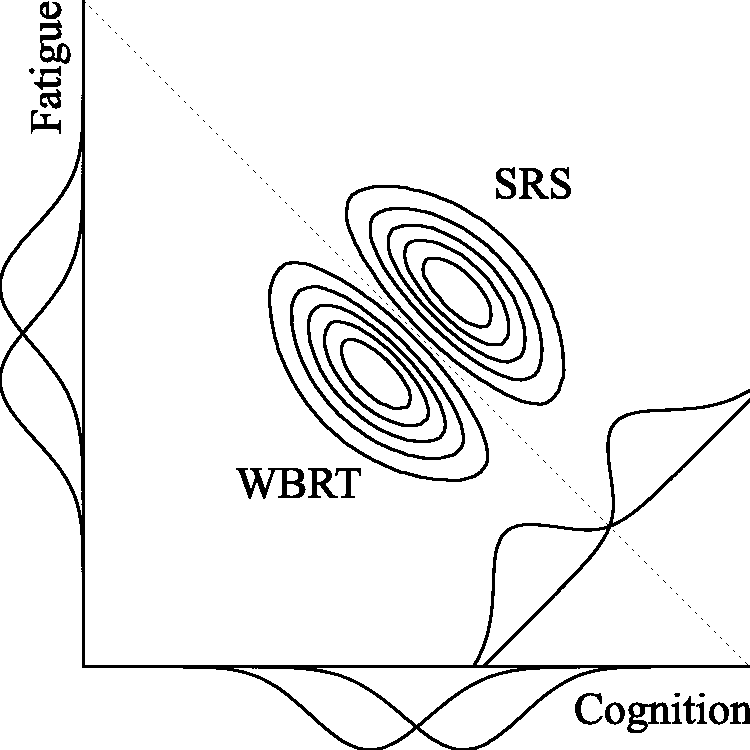
Separation of two bivariate distributions (diagonally) versus separation of their univariate distributions (horizontally/vertically) for the CAR-B study. The dashed diagonal line represents a Compensatory decision rule with equal weights. Each distribution reflects the plausibility of the treatment effects on cognitive functioning and fatigue after observing fictive data..
In the current paper, we propose a decision procedure for multivariate decision-making with multiple (correlated) binary outcomes. The procedure consists of two components. First, we model the data with a multivariate Bernoulli distribution, which is a multivariate generalization of the univariate Bernoulli distribution. The model is exact and does not rely on numerical approximations, making it appropriate for small samples. Second, we extend multivariate analysis with a compensatory decision rule to include more comprehensive and flexible definitions of superiority.
The decision procedure is based on a Bayesian multivariate Bernoulli model with a conjugate prior distribution. The motivation for this model is twofold. First, the multivariate Bernoulli model is a natural generalization of the univariate Bernoulli model, which intuitively parametrizes success probabilities per outcome variable. Second, a conjugate prior distribution can greatly facilitate computational procedures for inference. Conjugacy ensures that the form of the posterior distribution is known, making sampling from the posterior distribution straightforward.
Although Bayesian analysis is well known to allow for inclusion of information external to the trial by means of prior information, 10 researchers who wish not to include prior information can obtain results similar to frequentist analysis. The use of a non-informative prior distribution essentially results in a decision based on the likelihood of the data, such that (1) Bayesian and frequentist (point) estimates are equivalent; and (2) the frequentist p-value equals the Bayesian posterior probability of the null hypothesis in one-sided testing. 11 Since a (combined) p-value may be difficult to compute for the multivariate Bernoulli model, Bayesian computational procedures can exploit this equivalence and facilitate computations involved in Type I error control.12,13
The remainder of the paper is structured as follows. In section 2, we present a multivariate approach to the analysis of multiple binary outcomes. Subsequently, we discuss various decision rules to evaluate treatment differences on multiple outcomes in section 3. The framework is evaluated in section 4, and we discuss limitations and extensions in the section 5.
2 A model for multivariate analysis of multiple binary outcomes
2.1 Notation
We start the introduction of our framework with some notation. The joint response for patient i in treatment j on K outcomes will be denoted by
Vector
2.2 Likelihood
The likelihood of joint response
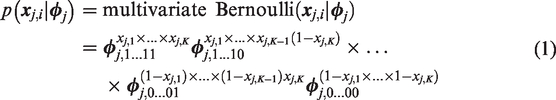
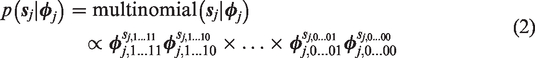
The multivariate Bernoulli distribution in equation (1) is a specific parametrization of the multinomial distribution. The likelihood of nj joint responses summarized by cell frequencies in
Conveniently, the multivariate Bernoulli distribution is consistent under marginalization. That is, marginalizing a
The pairwise correlation between variables
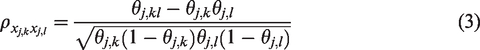
This correlation is over the full range, i.e.
2.3 Prior and posterior distribution
A natural choice to model prior information about response probabilities
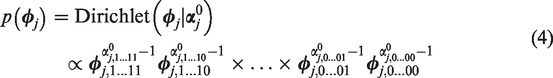
The posterior distribution of
Since prior hyperparameters
To include prior information – when available – in the decision,
The final superiority decision relies on the posterior distribution of treatment difference
3 Decision rules for multiple binary outcomes
The current section discusses how the model from the previous section can be used to make treatment superiority decisions. Treatment superiority is defined by the posterior mass in a specific subset of the multivariate parameter space of

3.1 Four different decision rules
Different partitions of the parameter space define different superiority criteria to distinguish two treatments. The following decision rules conclude superiority when there is sufficient evidence that:
Single rule: an a priori specified primary outcome k has a treatment difference larger than zero. The superiority region is denoted by

Superiority is concluded when
2. Any rule: at least one of the outcomes has a treatment difference larger than zero. The superiority region is a combination of K superiority regions of the Single rule


Superiority is concluded when
3. All rule: all outcomes have a treatment difference larger than zero. Similar to the Any rule, the superiority region is a combination of K superiority regions of the Single rule: The superiority region is denoted by


Superiority is concluded when

Next to facilitating these common decision rules, our framework allows for a Compensatory decision rule:
4. Compensatory rule: the weighted sum of treatment differences is larger than zero. The superiority region is denoted by

where
Superiority is then concluded when

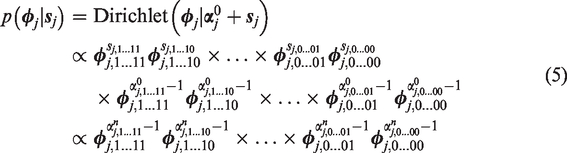
Figure 2 visualizes these four decision rules.
Superiority regions of various decision rules for two outcome variables (K = 2). The Any rule is a combination of the two Single rules. The Compensatory rule reflects
From our discussion of the different decision rules, a number of relationships between them can be identified. First, mathematically the Single rule can be considered a special case of the Compensatory rule with weight wk = 1 for primary outcome k and wl = 0 for all other outcomes. Second, the superiority region of the All rule is a subset of the superiority regions of the other rules, i.e.

The Single rule is in turn a subset of the superiority region of the Any rule, such that

These properties can be observed in Figure 2 and translate directly to the amount of evidence provided by data

The ordering of the posterior probabilities of different decision rules (equation (15) implies that superiority decisions are most conservative under the All rule and most liberal under the Any rule. In practice, this difference has two consequences. First, to properly control Type I error probabilities for these different decision rules, one needs to set a larger decision threshold pcut for the Any rule than for the All rule. Second, the All rule typically requires the largest sample size to obtain sufficient evidence for a superiority decision.
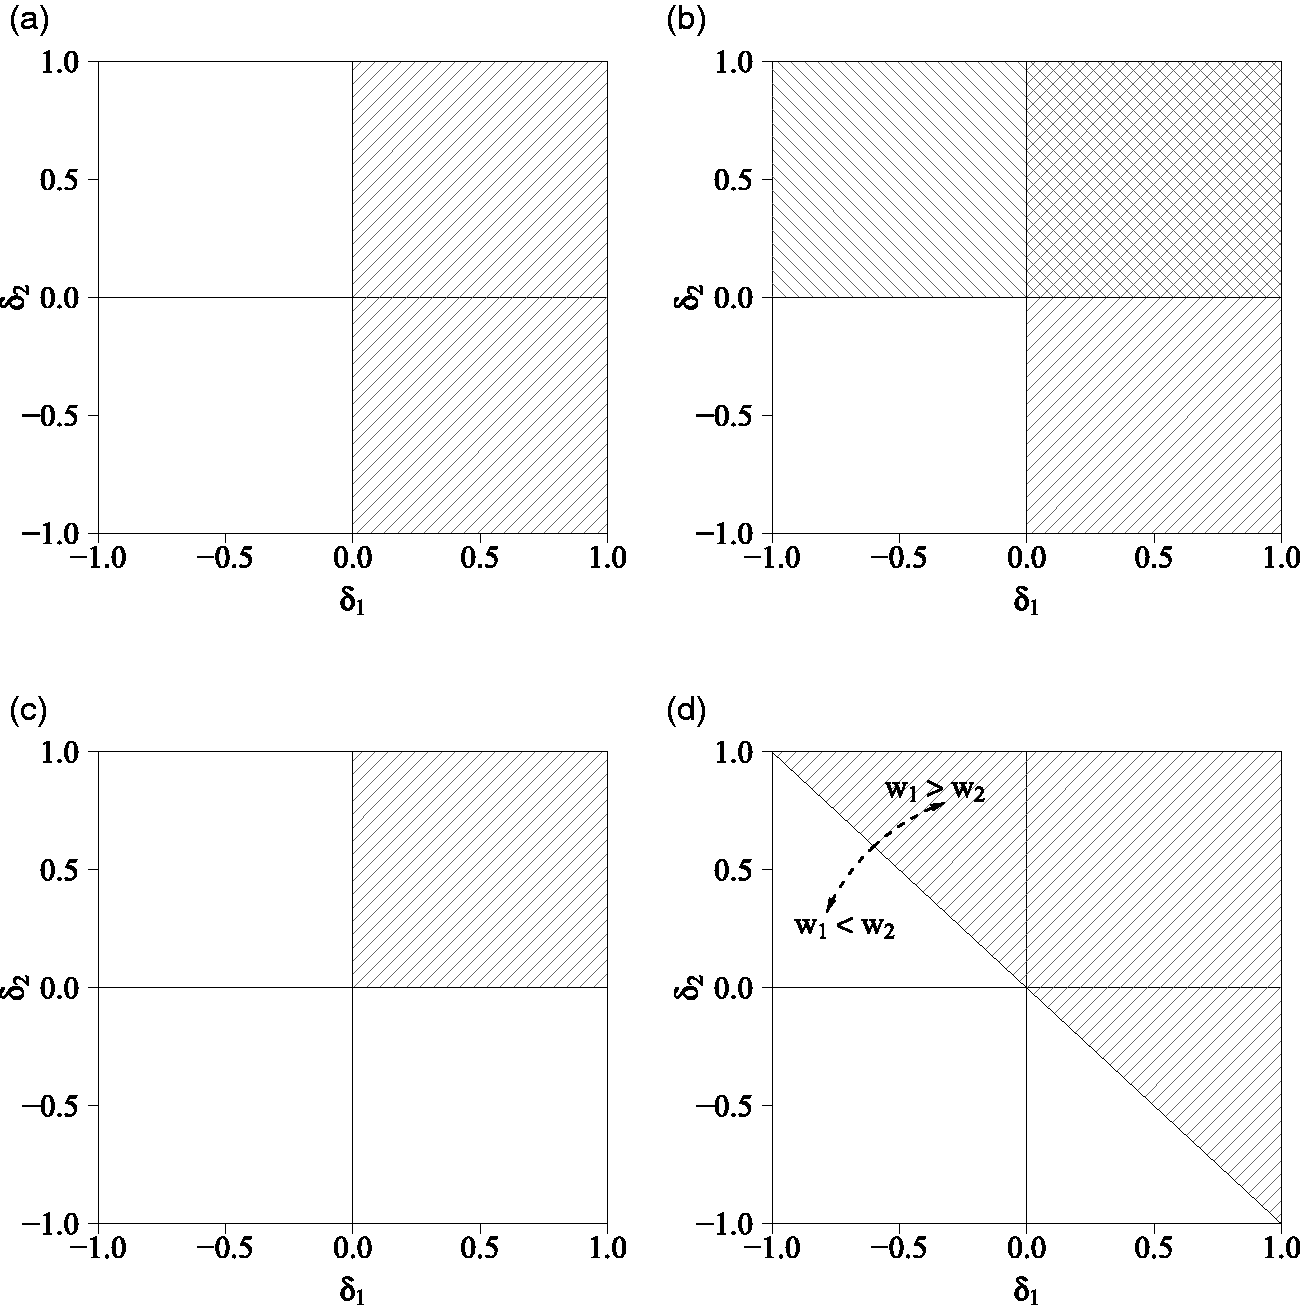
Additionally, the correlation between treatment differences,
Influence of the correlation between two treatment differences on the proportion of overlap between the bivariate distribution of treatment differences
3.2 Specification of weights of the Compensatory decision rule
To utilize the flexibility of the Compensatory rule, researchers may wish to specify weights
Specification of impact weights is guided by substantive considerations to reflect the relative importance of outcomes. When
Efficiency weights are specified with the aim of optimizing the required sample size. As the weights directly affect the amount of evidence for a treatment difference, the efficiency of the Compensatory decision rule can be optimized with values of
3.3 Implementation of the framework
The procedure to arrive at a decision using the multivariate analysis procedure proposed in the previous sections is presented in Algorithm 1 for a design with fixed sample size nj of treatment j. We present the algorithm for designs with interim analyses in Algorithm 2 in Supplementary Appendix Implementation of the framework in group sequential and adaptive designs.
a Choose decision rule
b Choose prior hyperparameters
c Choose Type I error rate α and power
d Determine decision threshold pcut
e Determine sample size nj based on anticipated treatment differences
a Collect nj joint responses
b Compute joint response frequencies
c Compute posterior parameters
d Sample L posterior draws,
e Sum draws
f Transform draws
g Compute posterior probability of treatment superiority
4 Numerical evaluation
The current section evaluates the performance of the presented multivariate decision framework by means of simulation in the context of two outcomes (K = 2). We seek to demonstrate (1) how often the decision procedure results in an (in)correct superiority conclusion to learn about decision error rates; (2) how many observations are required to conclude superiority with satisfactory error rates to investigate the efficiency of different decision rules, and (3) how well the average estimated treatment difference corresponds to the true treatment difference to examine bias. The current section is structured as follows. We first introduce the simulation conditions, the procedure to compute sample sizes for each of these conditions, and the procedure to generate and evaluate data. We then discuss the results of the simulation.
4.1 Conditions
The performance of the framework is examined as a function of the following factors:
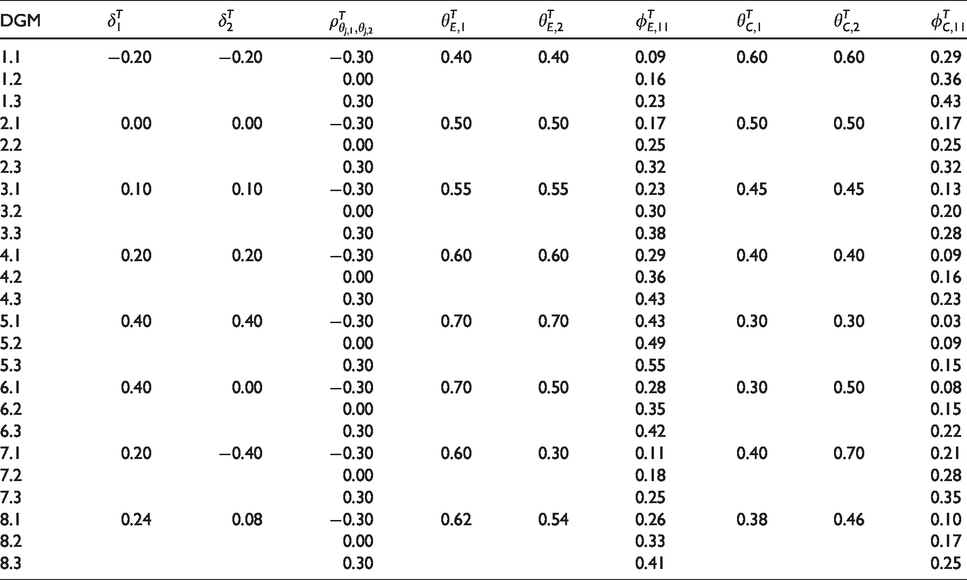
Data generating mechanisms: We generated data of eight treatment difference combinations Decision rules: The generated data were evaluated with six different decision rules. We used the Single (for outcome k = 1), Any, and All rules, as well as three different Compensatory rules: One with equal weights
4.2 Sample size computations
To properly control Type I error and power, each of the 24 × 6 conditions requires a specific sample size. These sample sizes nj are based on anticipated treatment differences For the Single rule, we used a two-proportion Following Sozu et al.,5,16 we used multivariate normal approximations of correlated binary outcomes for the All and Any rules. For the Compensatory rule, we used a continuous normal approximation with mean
Data generating mechanisms (DGM) used in numerical evaluation of the framework.
The computed sample sizes are presented in Table 3. Conditions that should not result in superiority were evaluated at sample size
4.3 Data generation and evaluation
Of each data generating mechanism presented in Table 1, we generated 5000 samples of size
The proportion of samples that concluded superiority reflects Type I error rates (when false) and power (when correct). We assessed the Type I error rate under the data generating mechanism with the least favorable population values of
4.4 Results
The proportion of samples that concluded superiority and the required sample size are presented in Tables 2 and 3, respectively. Type I error rates were properly controlled around
P(Conclude superiority) for different data generating mechanisms (DGM) and decision rules.
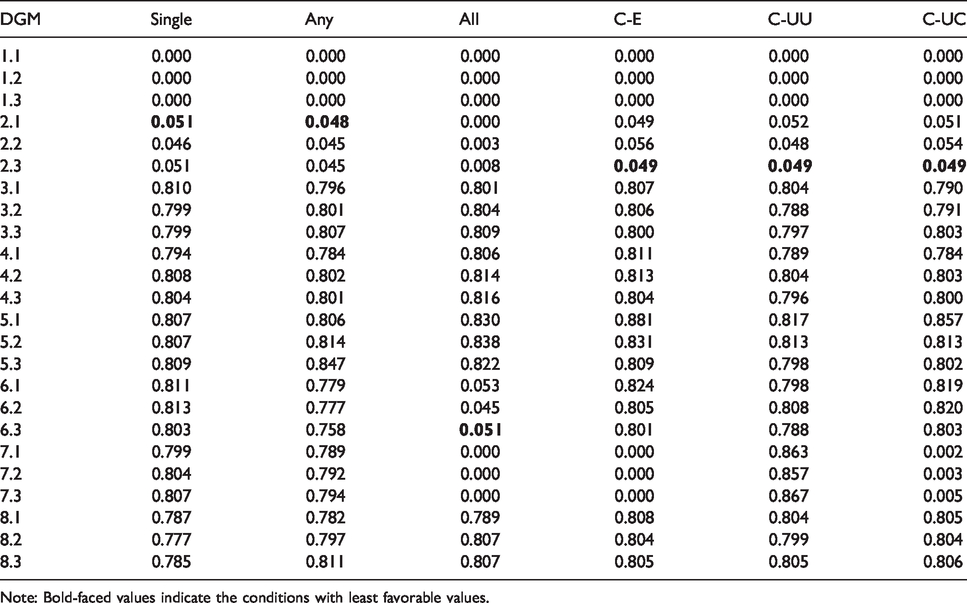
Note: Bold-faced values indicate the conditions with least favorable values.
Average sample size to correctly conclude superiority for different data generating mechanisms (DGM) and decision rules.
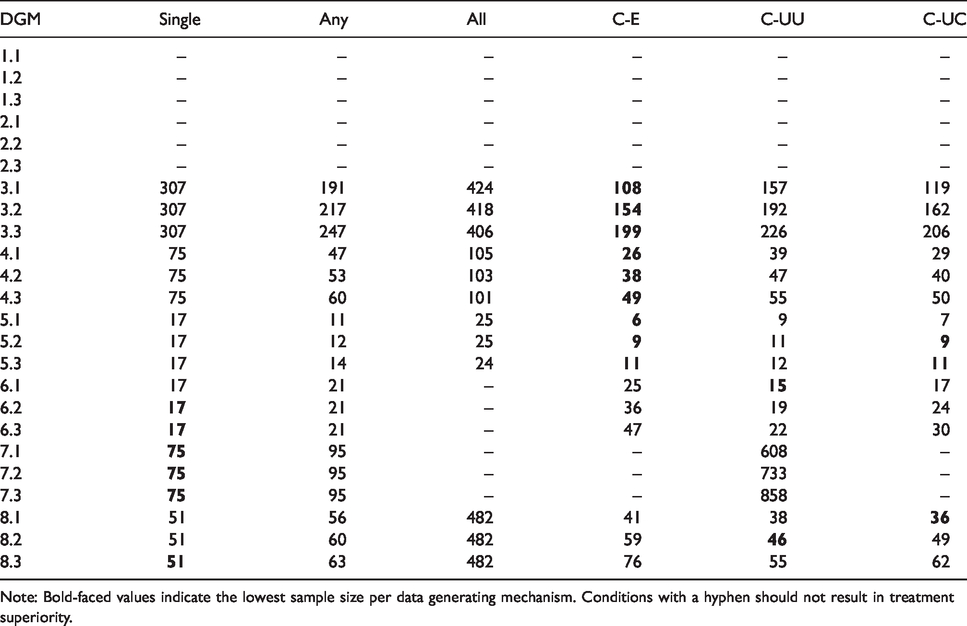
Note: Bold-faced values indicate the lowest sample size per data generating mechanism. Conditions with a hyphen should not result in treatment superiority.
Given these satisfactory error rates, a comparison of sample sizes provides insight in the efficiency of the approach. We remark here that a comparison of sample sizes is only relevant when the decision rules under consideration have a meaningful definition of superiority. Further, in this discussion of results we primarily focus on the newly introduced Compensatory rule in comparison to the other decision rules. The results demonstrate that the Compensatory rule consistently requires fewer observations than the All rule, and often – in particular when treatment differences are equal (i.e. treatment differences
The influence of the relation between outcomes is also apparent: Negative correlations require fewer observations than positive correlations. The variation due to the correlation is considerable: The average sample size almost doubles in scenarios with equal treatment differences (e.g. data generating mechanisms 3.1 vs. 3.3 and 4.1 vs. 4.3).
Comparison of the three different Compensatory rules further highlights the influence of weights
Note that in practice it may be difficult to accurately estimate treatment differences and correlations in advance. This uncertainty may result in inaccurate sample size estimates, as demonstrated in Supplementary Appendix Numerical evaluation: Comparison of trial designs. The simulations in this appendix also show that the approach can be implemented in designs with interim analyses as well, which is particularly useful under uncertainty about anticipated treatment differences. Specifically, we demonstrate that (1) both Type I and Type II error rates increase, while efficiency decreases in a fixed design when the anticipated treatment difference does not correspond to the true treatment difference; and (2) designs with interim analyses could compensate for this uncertainty in terms of error rates and efficiency, albeit at the expense of upward bias.
Further, Supplementary Appendix Numerical evaluation: Comparison of prior specifications shows how prior information influences the properties of decision-making. Informative priors support efficient decision-making when the prior treatment difference corresponds to the treatment difference in the data. In contrast, evidence is influenced by dissimilarity between prior hyperparameters and data, and may either increase or decrease (1) the required sample size; and (2) the average posterior treatment effect, depending on the nature of the non-correspondence.
5 Discussion
The current paper presented a Bayesian framework to efficiently combine multiple binary outcomes into a clinically relevant superiority decision. We highlight two characteristics of the approach.
First, the multivariate Bernoulli model has shown to capture relations properly and support multivariate decision-making. The influence of the correlation between outcomes on the amount of evidence in favor of a specific treatment highlights the urgency to carefully consider these relations in trial design and analysis in practice.
Second, multivariate analysis facilitates comprehensive decision rules such as the Compensatory rule. More specific criteria for superiority can be defined to ensure clinical relevance, while relaxing conditions that are not strictly needed for clinical relevance lowers the sample size required for error control; a fact that researchers may take advantage of in practice where sample size limitations are common. 6
Several other modeling procedures have been proposed for the multivariate analysis of multiple binary outcomes. The majority of these alternatives assume a (latent) normally distributed continuous variable. When these models rely on large sample approximations for decision-making (such as methods presented by Whitehead et al., 17 Sozu et al.,5,16 and Su et al. 18 ; see for an exception Murray et al. 3 ), their applicability is limited, since the validity of z-tests for small samples may be inaccurate. A second class of alternatives uses copula models, which is a flexible approach to model dependencies between multiple univariate marginal distributions. The use of copula structures in discrete data can be challenging, however. 19 Future research might provide insight in the applicability of copula models for multivariate decision-making in clinical trials.
Two additional remarks concerning the number of outcomes should be made. First, the modeling procedure becomes more complex when the number of outcomes increases, since the number of cells increases exponentially. Second, the proposed Compensatory rule has a linear compensatory mechanism. With two outcomes, the outcomes compensate each other directly and the size of a negative effect is maximized by the size of the positive effect. A decision based on more than two outcomes might have the – potentially undesirable – consequence of compensating a single large negative effect by two or more positive effects. Researchers are encouraged to carefully think about a suitable superiority definition and might consider additional restrictions to the Compensatory rule, such as a maximum size of individual negative effects.
Supplemental Material
sj-pdf-1-smm-10.1177_0962280220922256 - Supplemental material for Decision-making with multiple correlated binary outcomes in clinical trials
Supplemental material, sj-pdf-1-smm-10.1177_0962280220922256 for Decision-making with multiple correlated binary outcomes in clinical trials by Xynthia Kavelaars, Joris Mulder and Maurits Kaptein in Statistical Methods in Medical Research
Footnotes
Acknowledgements
We thank two anonymous reviewers for their helpful comments that greatly improved the presentation of the main ideas in this manuscript.
Declaration of conflicting interests
The author(s) declared no potential conflicts of interest with respect to the research, authorship, and/or publication of this article.
Funding
The author(s) disclosed receipt of the following financial support for the research, authorship, and/or publication of this article: This work was supported by the Dutch Research Council (NWO) [grant no. 406.18.505].
References
Supplementary Material
Please find the following supplemental material available below.
For Open Access articles published under a Creative Commons License, all supplemental material carries the same license as the article it is associated with.
For non-Open Access articles published, all supplemental material carries a non-exclusive license, and permission requests for re-use of supplemental material or any part of supplemental material shall be sent directly to the copyright owner as specified in the copyright notice associated with the article.