
Abstract
With group randomized trials complete groups of subject are randomized to treatment conditions. Such grouping also occurs in individually randomized trials where treatment is administered in groups. Outcomes may be measured at the level of the subject, but also at the level of the group. The optimal design determines the number of groups and the number of subjects per group in the intervention and control conditions. It is found by taking a budgetary constraint into account, where costs are associated with implementing the intervention and control, and with taking measurements on subject and groups. The optimal design is found such that the effect of treatment is estimated with highest efficiency, and the total costs do not exceed the budget that is available. The design that is optimal for the outcome at the subject level is not necessarily optimal for the outcome at the group level. Multiple-objective optimal designs consider both outcomes simultaneously. Their aim is to find a design that has high efficiencies for both outcome measures. An Internet application for finding the multiple-objective optimal design is demonstrated on the basis of an example from smoking prevention in primary education, and another example on consultation time in primary care.
1 Introduction
With group randomized trials, complete groups, such as school classes, general practices or even neighborhoods are randomized to treatment conditions and all subjects within the same group receive the same treatment. Such designs are often chosen over individual randomization for political, administrative and financial reasons, and to avoid the risk of contamination. 1 This trial design is very common in the health and behavioral sciences, which is emphasized by textbooks2–6 and special issues of statistical journals that have been devoted to it.7–9 It also goes under the names cluster randomized trial, community intervention trial and place-based trial in other fields of science.
An important question in the design phase of such a trial is how many groups and how many subjects per group should be enrolled. This question has been addressed in many publications over the past two decades; most of these sought the optimal sample sizes to maximize the efficiency of the treatment effect estimator while taking into account the costs at the group and subject level. Such optimal designs are referred to as single-objective optimal designs since they consider one objective (i.e. maximum efficiency for a single outcome measure). The first publications focused on equal costs and variances over treatment conditions and derived balanced designs with equal number of groups and equal group sizes over the treatments.10–12 The more realistic scenario with varying group level costs across treatment conditions was considered for trials with a fixed and common group size by Liu 13 and Candel and van Breukelen, 14 where the latter also considered heterogeneous variances. The most generic approach does not fix group sizes a priori and takes heterogeneous costs and variances into account. 15
The focus of these papers is on a single outcome measure at the subject level; while in group randomized trials outcomes may also be measured at the group level, or at both.16,17 For instance, in a cognitive behavioral intervention for disruptive classrooms, outcomes were not only measured at the level of the child (e.g. self-esteem, depressed mood and prosocial behavior) but also at the level of the classroom (classroom climate).18,19 A study in primary care focused on the effect of treatments to improve asthma care. Asthma symptom days per year and the need for oral steroid bursts were measured at the subject level and medication use at the practice level.20,21
The optimal number of groups per treatment in the case of a group level outcome follows from Schouten. 22 The optimal design for a group level outcome does not spend any part of the budget on measuring outcomes at the level of the subject; hence the whole budget can be spent on implementing the treatments and taking measurements on group level outcomes. This implies that the optimal design for a group level outcome includes more groups than the optimal design for a subject level outcome. The aim of this paper is to illustrate the use of multiple-objective optimal designs 23 for group randomized trials to take into account outcomes at the subject and group level simultaneously. Two objectives are considered: the efficiencies of the treatment effect estimator for the subject and for the group level outcome. The multiple-objective optimal design provides the optimal number of groups and group sizes in each treatment condition such that the efficiency for the most important outcome is at a user-specified level and the efficiency for the other outcome is maximized. 24 The multiple-objective optimal design is derived analytically and is implemented in a free web application. The focus is on studies that compare two treatments: an intervention and a control, where the latter can be an old treatment or no treatment at all.
The methodology of this paper does not only apply to group randomized trials but also to individually randomized trials where treatment is offered in peer pressure or focus groups.25–28 The group sizes in such group administered trials are often fixed in advance because such groups need to be small to promote dialogue among participants. 29 Hence, for such trials, the multiple-objective optimal design seeks the optimal number of groups per treatment condition, given fixed group sizes. Furthermore, the methodology can also be applied to trials where multiple subjects are treated by the same health professional;30–33 here the number of clients that can be treated by a professional is often small and fixed a priori.
The contents of this paper are as follows. The next section specifies the regression models for the analysis of subject and group level outcomes, as well as the cost function that is used as a constraint for finding the optimal design. Section 3 describes two group randomized trials that are used to illustrate the optimal design methodology in the succeeding two sections. The focus of section 4 is on trials in which group sizes are fixed a priori. A summary of single-objective optimal designs from the literature is given and the multiple-objective optimal design is derived. Section 5 extents to trials in which group sizes are not fixed a priori. Conclusions and a discussion are given in the final section.
2 Specification of regression models and cost function
The first focus is on the model for a subject level outcome. Subjects are nested within groups and the dependency of outcomes within the same group must be taken into account while analyzing the data. A suitable model is the linear mixed model, which takes into account a fixed treatment effect and random effects for groups and subjects. The model that relates a quantitative outcome

Treatment condition is a binary group level predictor and takes on the value
Outcomes may also be measured at the level of the group. The quantitative group level outcome

Note that this model includes just one level, namely the group level j, so the subject level identifier i does not appear in the subscripts. Again, treatment condition is coded
The experimental designs that are derived in the next two sections allow for different sample sizes across treatment conditions.

This constraint allows for different subject and group level costs across treatments:
3 Illustrative examples
3.1 School-based smoking prevention intervention
A school-based smoking prevention intervention was conducted to study the effects of an in-school and tailored out-of-school intervention and their interaction that targeted elementary school children in eight grade 34 in the Netherlands.
Suppose a researcher wishes to evaluate the effects of the in-school intervention in his or her country. This program consists of a school-based social influence program that is offered in seven lessons in the classroom setting. It may be obvious that all pupils within a given class should be involved in the program. It is not feasible from a practical and ethical point of view to offer the program to only part of the pupils within a class and to refrain it from others. Furthermore, the aim of the intervention will be to influence the norms within the class, which is hard to achieve when only part of it receives the intervention.
This is an illustration of an intervention where group sizes are fixed a priori. Although classes may somewhat vary with respect to their size, we assume a common class size of
As will be shown in the next section, the single- and multiple-objective optimal design depend on the total variance and intraclass correlation coefficients in both treatments, and prior estimates must be specified. The pupil level outcome in this illustration is the attitude towards the disadvantages of smoking, which is the sum score of 11 items that are measured on a five-point scale (range 11–55). Estimates are
Although the original study did not include an outcome measure at the level of the class, the researcher plans to measure class climate with respect to tobacco use. Such a variable could take into account social norms and peer pressure with respect to smoking. Let us assume this variable is standardized to have variance equal to 1 in the control (
3.2 Consultation time in primary care
The average consultation time in primary care in the Netherlands is 10 min. 35 Such a short amount of time may not only result in incorrect diagnoses and unnecessary referrals to second line care, but also in patient low satisfaction and physician burnout. In 2017–2018 a pilot was conducted to evaluate the effects of longer consultation time. The seven general practices that participated were requested to plan fewer consults, which could then be 15–30 min. The pilot was funded by health insurance companies. 36
Suppose the effects of longer consultation time are to be further studied in a large-scale group randomized trial. There would be two conditions: a control group that consists of general practices that use the standard consultation time of 10 min, and an intervention group of general practices that get incentives to allow for longer consultation time. Outcomes may be measured at the level of the patient, such as quality of the communication with the physician, trust and confidence in the physician, and satisfaction. 37 Outcomes at the level of the physician may be satisfaction, work pressure, stress and burnout.
In this study it is not necessary to measure all clients within a general practice, and optimal design methodology can be used to determine the optimal size of the sample that should be taken from each practice. In this illustration, the two outcomes are satisfaction at the level of the patient and stress at the level of the physician. Suppose both are a sum score with a range 0–100. The intervention is expected to reduce the physicians' mean stress level by five points. The anticipated variances at the level of the physician are
The costs to measure satisfaction (and other outcomes) on one patient are independent of treatment condition:
4 Group sizes fixed a priori
In this section, the group sizes
The single- and multiple-objective optimal designs can be found on the basis of a free web application at https://utrecht-university.shinyapps.io/CRT_fixed_cluster_sizes/.
4.1 Single-objective optimal designs
The treatment effect for the group level outcome is estimated by taking the difference in mean group level outcomes of the two conditions:

This variance depends on the number of groups in both conditions, that is, it depends on the design ξ. The objective
The optimal design is available in the literature
22
and is usually expressed as a ratio of sample sizes

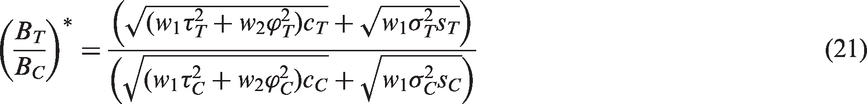
This ratio does not depend on the total budget B. The optimal design has a clear interpretation: one would allocate more groups to the intervention condition (at the expense of allocating groups to the control) when the outcome variance in the intervention increases and/or when the costs on the control increase.
The performance of any alternative design ξ as compared to that of the optimal design
The optimal design has efficiency equal to 1 and the efficiencies of all other designs are lower. High efficiencies of 0.8 or 0.9 are generally desired.
The optimal design for the subject level outcome is derived in a similar way. Again, the effect of treatment is estimated by taking the mean difference in outcomes of the two treatments:

The objective

4.2 An example: school-based smoking prevention intervention
The a priori estimates of the variances and intraclass correlation coefficients from Section 3 are used, as well as the cost specification in that section. The single-objective optimal design for the class level outcome is given by the optimal ratio Optimal designs for trials with a fixed group size. Top panels: efficiency plots for single-objective optimal designs for a group level outcome (panel A) and a subject level outcome (panel B). Bottom panels: multiple-objective optimal designs (Panel C: optimal allocation; panel D: efficiency plot).
The single-objective optimal design for the pupil level outcome is
4.3 Multiple-objective optimal designs
The single-objective optimal designs for the pupil and class level outcomes in the example are different from each other. A multiple-objective optimal design can be constructed to take both objectives into account simultaneously. Let us assume objective

This is a so-called constrained optimal design and it is most often difficult to find. As an alternative, one may construct a compound optimal design to minimize

The weight
Under convexity and differentiability, the constrained and compound optimal designs are equivalent.
24
Thus, the desired constrained optimal design may be found by first forming a compound optimal design as a function of the weight λ. Then, an efficiency plot is drawn in which the relation between both efficiencies
The two objectives

This can be rewritten (see Appendix 1) as

The optimal design is further derived in Appendix 1 and is equal to

Again, we note the optimal design does not depend on the total budget B.
4.4 Example (continued)
The two plots at the bottom of Figure 1 visualize the multiple-objective optimal design. Panel C shows the optimal proportion of classes in the intervention as a function of
For
In this example, the two objectives are compatible, which means high efficiencies can be achieved for both of them simultaneously. When this is not the case, the objectives are competitive.
5 Group sizes not fixed a priori
The focus of this section is on the case where group sizes
5.1 Single-objective optimal designs
The total budget B can be split into two components:
The optimality criterion for the group level outcome is given by equation (4) and as is obvious

It should be understood that the constraint
This equation follows from equation (5) by setting

This ratio does not depend on the total budget B. A higher part of the budget should be assigned to the intervention when the variance in the intervention and/or costs in the intervention increase.
The derivation of the optimal design for the subject level outcome is more complicated because not only the number of groups in both conditions needs to be derived but also the optimal group sizes.
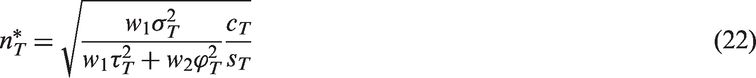
Given budget

These optimal sample sizes are found by expressing
It is obvious that the optimal group size increases when the within-group variability becomes higher and/or when the group level cost increase. The optimal group size does not depend on the budget

Equations (17) and (18) also hold for the control condition when the subscript T is replaced by C.
The optimal design question is how large
Again the budget assigned to the intervention condition increases with the variance and costs in the intervention.
Substitution of equation (19) into the equation

5.2 An example: consultation time in primary care
For the outcome at the practice level, the optimal ratio of budgets is Optimal designs for trials with a non-fixed group size. Top panels: efficiency plots for single objective optimal designs for a group level outcome (panel A) and a subject level outcome (panels B and C). Bottom panels: multiple-objective optimal designs (panel D: optimal allocation of budget; panel E: optimal group size, panel F: efficiency plot).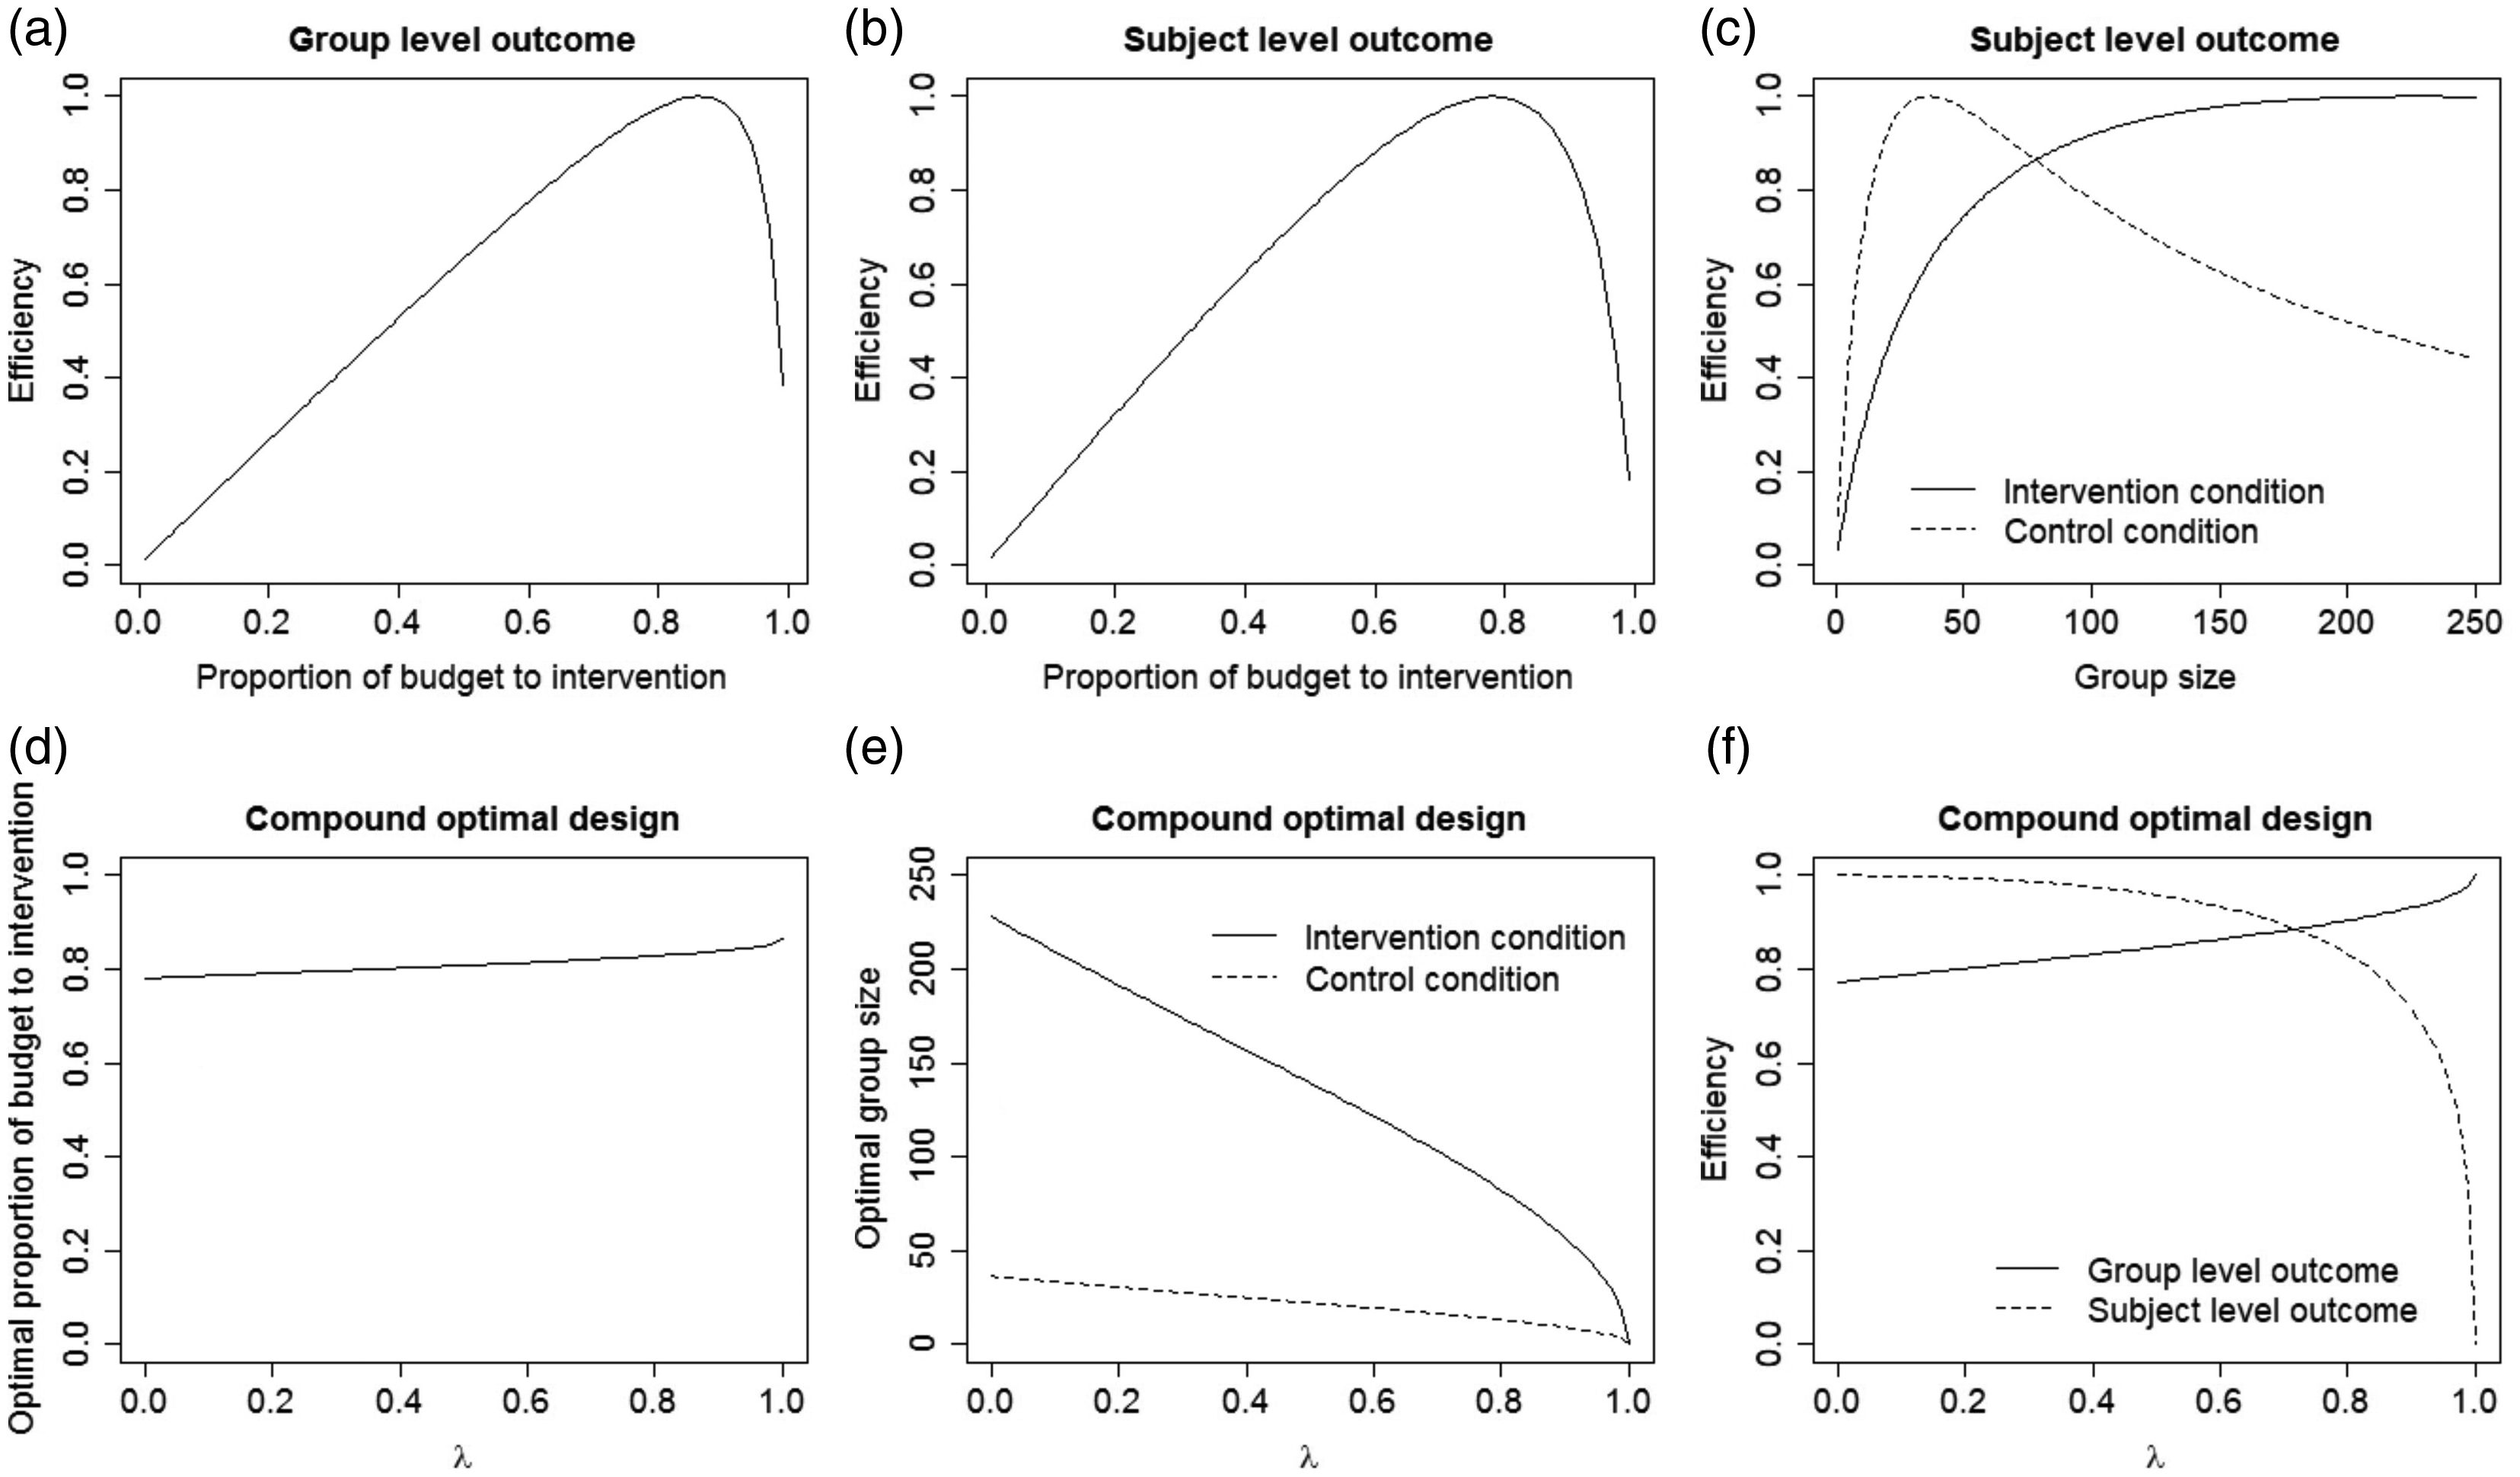
For the patient level outcome, the optimal ratio of budgets is
5.3 Multiple-objective optimal design
The optimality criterion for the multiple-objective optimal design is given by equation (12), but now group sizes are not fixed a priori. The complete derivation of the multiple-objective is given in Appendix 1.
The first part of the optimal design question is how large
The second part of the optimal design question is how large the group sizes
This simplifies to the optimal group size
As before, the efficiencies of both objectives can be drawn in an efficiency plot as a function of the weight λ. The objective is compatible if both efficiencies are above a user selected value (most often 0.8 or 0.9). Otherwise, the two objectives are competitive and the selection of λ is explained as below equation (10).
5.4 Example (continued)
Panel D of Figure 2 shows the optimal proportion of the budget that is allocated to the intervention condition as a function of λ. For
For the practice level objective
Panel F shows the efficiencies of both objectives as a function of λ. Both are related to λ and to the strongest degree for the patient level outcome. For
For
6 Discussion and conclusions
In group randomized trials, outcomes may not only be measured at the level of the subject but also at the level of the group. Thus far, the optimal design of group randomized trials with outcomes at both levels had not been studied. This paper proposed the use of multiple-objective optimal designs to take outcomes at the subject and group level into account simultaneously. The methodology was illustrated using two examples from smoking prevention and consultation time in primary care. Two free web applications were made available to find the single- and multiple-objective optimal designs and to evaluate the efficiency of all other designs. The R syntax that was used to build these web applications is available upon request.
This paper considered a general case with treatment-dependent costs and variances. The optimal design is locally optimal in the sense that it depends on the treatment-dependent variances of the outcome at the group level and treatment-dependent total variance and intraclass correlation coefficient of the subject level outcome. These model parameters are most often not known in the design phase of a group randomized trial and prior estimates may be obtained from expert knowledge or the literature. Table 11.1 in Moerbeek and Teerenstra 38 gives an overview of dozens of papers that published estimated of intraclass correlation coefficients in many research fields with various types of groups. Of course, there is no guarantee that estimates from the literature will hold in another year, country or setting. It is therefore suggested to use the free web applications to do a robustness analysis. The optimal design can be derived for various plausible values of the variances and intraclass correlation coefficients and the optimal design is robust if it hardly depends on the chosen values. If the design is not robust, then it is suggested to use robust optimal designs techniques, such as internal pilots or maximin optimal designs. This will be topic of future research.
This contribution restricted to quantitative outcomes at the subject and group level. The results are also applicable to binary logistic regression models if appropriate substitutions in the equations are made. For subject level outcomes, the variances
The optimal designs allow the group sizes to vary between but not within treatments. In practice it is likely that group sizes also vary within treatments. For instance, there was some variation in the sizes of the school classes in the smoking prevention intervention example. In the example from general care, the same number of patients may be sampled from each general practice, but varying group sizes may still occur as a result of non-response. For group randomized trials with an outcome at the subject level, it has been advised to increase the number of groups by 11%. 40 Future research should verify if this is also the case with outcomes at multiple levels.
Footnotes
Declaration of conflicting interests
The author(s) declared no potential conflicts of interest with respect to the research, authorship, and/or publication of this article.
Funding
The author(s) disclosed receipt of the following financial support for the research, authorship, and/or publication of this article: This research received no specific grant from any funding agency in the public, commercial, or not‐for‐profit sectors.