
Abstract
Accurate assessment of the age-dependent disease risk conferred by germline variants in disease susceptibility genes is often hampered by the way the data are collected. Cohort-based data sets frequently contain an overrepresentation of patients (i.e. carriers of the gene variant of interest affected with the associated disease), and an underrepresentation of disease-free carriers. In order to overcome this problem, penetrance estimates can be based on family-based study designs, through the evaluation of index patients and their family members. This approach facilitates the identification of asymptomatic germline variant carriers. By adjusting for the way these family data are ascertained, an estimate for the penetrance of the pathogenic gene variant can be obtained. However, the family structure is often incomplete or missing. This complicates the estimation of the penetrance, because full adjustment of the likelihood is not possible. We present a conditional likelihood for the estimation of the penetrance of pathogenic gene variants, based on a cohort of multiple families comprising index patients, disease-free and affected non-index carriers, but with missing information on pedigree structure. The proposed estimator corrects for the ascertainment in a robust way and is shown to be more accurate than the frequently used Kaplan–Meier estimator of the penetrance function.
1 Introduction
Accurate estimates of the age-dependent disease risk (the penetrance) for carriers of germline gene variants that affect function (hereafter variants) in specific disease-susceptibility genes are important in counseling carriers and their families and in optimising cascade screening and follow-up protocols (surveillance). Especially in the case of rare genetic variants and diseases, obtaining data through a population-based cohort study design is usually not a realistic option, since a large number of individuals is needed in order to identify enough carriers of the gene variants of interest for an accurate estimation of its penetrance. Therefore, carriers of specific gene variants are often identified through a family-based study design, involving genetic cascade screening of the family of index patients (i.e. the first identified individual within a family carrying a pathogenic gene variant and expressing the associated disease phenotype). Different family-based study designs have been suggested for penetrance estimations. 1 These designs allow for unbiased estimates of the penetrance via the maximum likelihood method, provided that adequate adjustment of the likelihood is applied to the manner in which data are ascertained.2,3 For this purpose, prospective and retrospective likelihoods are often used. The prospective likelihood can only be applied if the ascertainment rules are clear, have been followed exactly, and are easy to model. Otherwise the retrospective likelihood should be used. This likelihood is applicable if the ascertainment is based on the phenotypes only.4,5 A frequently employed method for the estimation of the penetrance uses the Kaplan–Meier estimator based on data of the relatives of index patients only (the index patients themselves are left out of the analysis to correct for the ascertainment bias to prevent overestimation of the penetrance). However, this method still yields biased estimates as it does not actually correct for the way the data are ascertained. The estimation procedure ignores the fact that ascertainment is based on the phenotype of the whole pedigree and not on one particular individual in the pedigree. Moreover, leaving out the index patients from the analysis means discarding valuable information, especially in rare and low-penetrant disease.
Here we consider the situation where essential pedigree information is missing. This is frequently the case, due to a plethora of possible reasons: the patient may be unaware of the family history, the hereditary nature of the disease may not have been recognised during treatment of a single patient, or the data were initially not collected for research or cascade screening purposes. Usually, pedigree data are obtained via an index patient in a pedigree. Patients who express the disease phenotype and carry the genetic variant of interest are asked to inform their family members about their potential risk. Some of these relatives will consent to genetic counseling and DNA testing. Detected carriers of the germline variant will be followed and regularly screened for the disease. When aiming to estimate the penetrance of the disease, the follow-up data of all known carriers (the index patients and their relatives with the variant) are collected from the medical records. However, the relation between the carriers and the index patient is often lacking. This missing information hampers the correction for the way the data were ascertained. A frequently used method for penetrance calculations in this setting is the Kaplan–Meier estimator, because of its simplicity and because up to now, there was no adequate alternative. However, the Kaplan–Meier estimator is prone to ascertainment bias and discards useful information. Here we describe a novel method for the estimation of the penetrance function that is designed especially for the situation described above. The performance of this newly proposed estimator is evaluated by means of simulation studies and compared with the traditionally used Kaplan–Meier estimator.
Information on the family members at risk that do not consent to clinical surveillance or DNA testing is usually entirely missing. These data may not be missing at random, as relatives of index patients who experience similar symptoms are presumably more inclined to undergo surveillance or DNA testing than family members who do not. This problem is especially poignant in low-penetrant disease, as a relatively large number of family members who carry the gene variant of interest will be asymptomatic. As it is impossible to account for this missing data in the estimation method if there is no indication of the number of family members that are missing from the dataset, the effect of the missing data is quantified with a simulation study.
With the growing availability and accessibility of high-throughput genetic screening techniques such as whole exome sequencing and whole genome sequencing, our knowledge of the genetic determinants of hereditary disease is growing rapidly. The advent of these techniques has facilitated the identification of causative genes in rare diseases, and of gene variants that confer a relatively low disease risk. Accurate estimation of disease risk is challenging especially in these rare and low-penetrant gene variants. The need for accurate methods for estimating disease risk that address ascertainment correction will increase with the rising number of individuals known to harbour a hereditary predisposition to disease.
2 Methods
2.1 Data, model assumptions and likelihood
Here it is assumed that the disease is not lethal. At the end of Appendix 1, it is explained in what way the likelihood will change if this assumption does not hold and individuals may die from the disease.
Once an individual is diagnosed with the disease of interest and with a function-affecting gene variant that predisposes for the disease of interest, relatives are often offered genetic testing and clinical surveillance of the disease in case of identified carriership. When aiming for estimating the disease penetrance the follow-up data of the carriers is collected from the medical records.
For gene variant carriers, the following notation is used: the age at diagnosis of the disease is denoted by T with cumulative distribution F and density f, and the age at the end of the study (collection of the data), or the age at death (whichever occurs first) by C, with distribution G and density g. It is assumed that T and C are independent.
For every subject it is known whether he or she is an index patient or a relative of an index patient, but information on the family (structure) is not available. For patients (
If the estimation method is not corrected for the way the data were ascertained, this would result in overestimation or underestimation of the disease penetrance. Correction of the likelihood can be done by conditioning on the ascertainment event (see Appendix 1 for the details) and the corrected likelihood is equal to

In the likelihood, no notation is used (and necessary) to distinguish between families, because it is not known from the data which individuals are related.
2.2 Estimation
The conditional likelihood in equation (1) contains the unknown distributions F and G with densities f and g, and the sizes of the families in the data-set

An estimator for F is obtained by maximising this likelihood. To make maximisation computationally feasible within a foreseeable computing time, it is assumed that
Two methods for estimating G are considered. In the first method, it is assumed that G belongs to a class of parametric distributions. This class could be chosen based on the form of the Kaplan–Meier curve or the empirical distribution of the observed censoring times C of relatives with or without the germline variant (if data for the latter is available). Next, the estimates of the unknown parameters that determine G and θ (the unknown parameter of
A second estimate for G can be constructed as follows. For relatives who turn out to be non-carriers after genetic testing, there is no follow-up. However, if the age at the time of testing is available, the censoring times can be determined. Then, G can be estimated by the empirical distribution function of these censoring times, denoted as
If people may die from the disease, then C may be right censored by death due to the disease, and the likelihood that is derived at the end of Appendix 1 should be used in stead. However, the two-step estimation method as described in this section will yield exactly the same estimate for
R-code for computing the estimates and the confidence interval is available upon request.
3 Results
3.1 Simulation study
In this section, the results of simulation studies are evaluated to study the effect of replacing
The simulation of data is performed in five steps.
Step 1. The number of tested carriers of the genetic variant in, say, pedigree j in the data, nj, is simulated as described below. Step 2. For all nj individuals, the age at diagnosis of the disease, T, is simulated from a Weibull distribution with shape and scale parameters equal to 2.5 and 90 (motivated by the real data example below). Step 3. The age at time of censoring, C, is simulated from a uniform distribution at the interval [20, 80] (this choice for G is based on the estimate in the application, but other distributions have been considered as well). Step 4. If at least one of the individuals has an age-at-onset T with
This simulation schedule is repeated 10,000 times. The total number of individuals or pedigrees that are selected depends on the choice of the distribution for the values nj and the chosen distribution
Step 5. Independently of the simulated data so far, 1000 censoring times C are simulated from the same distribution as chosen in step 4. These are the simulated censoring times for the non-carriers in the ascertained pedigrees in step 4. Its empirical distribution function will be used for estimating G (see the settings A and B below).
In total, three simulation studies are performed. In the first simulation, nj can take the values 1, 2, or 3 with probabilities 0.5, 0.25, and 0.25. In the second simulation, these values are 1, 2, 3, 4, and 5 and they are sampled with equal probabilities (probability 1/5) and in the third study the values are 1, 2, 3, 4, 5, and 10 which are also sampled with equal probability (probability 1/6). This leads to three data-sets of approximately 3500, 5000 and almost 6000 families. Next, the model parameters are estimated as described in the previous section. Furthermore, the Kaplan–Meier estimate based on the data of all carriers except the index patients is determined. The whole procedure, simulation and estimation, is repeated 250 times.
Estimates for
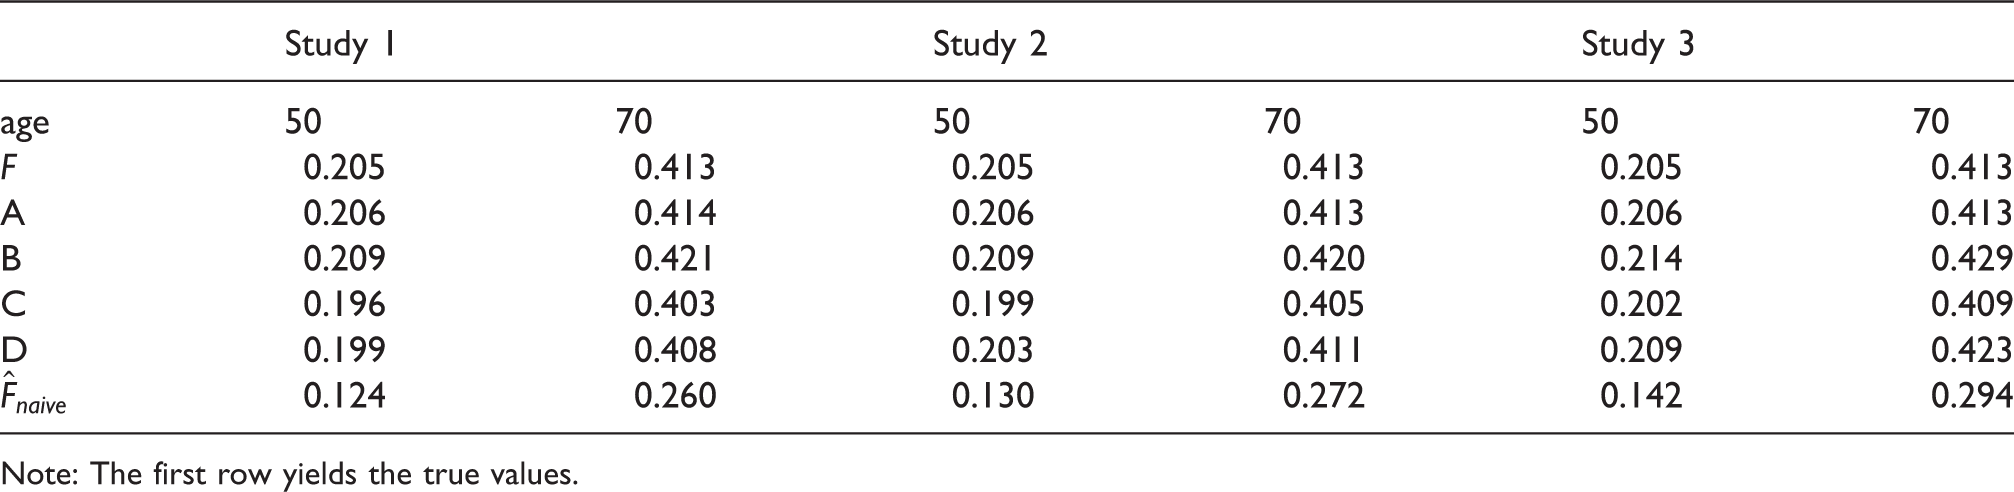
Figure 1 shows boxplots of the estimates of Boxplots for the results of the simulation studies with Median of the estimates of F at the ages 50 and 70 by the estimates in the settings A, B, C and D and in the three different studies, and the naive estimator Note: The first row yields the true values.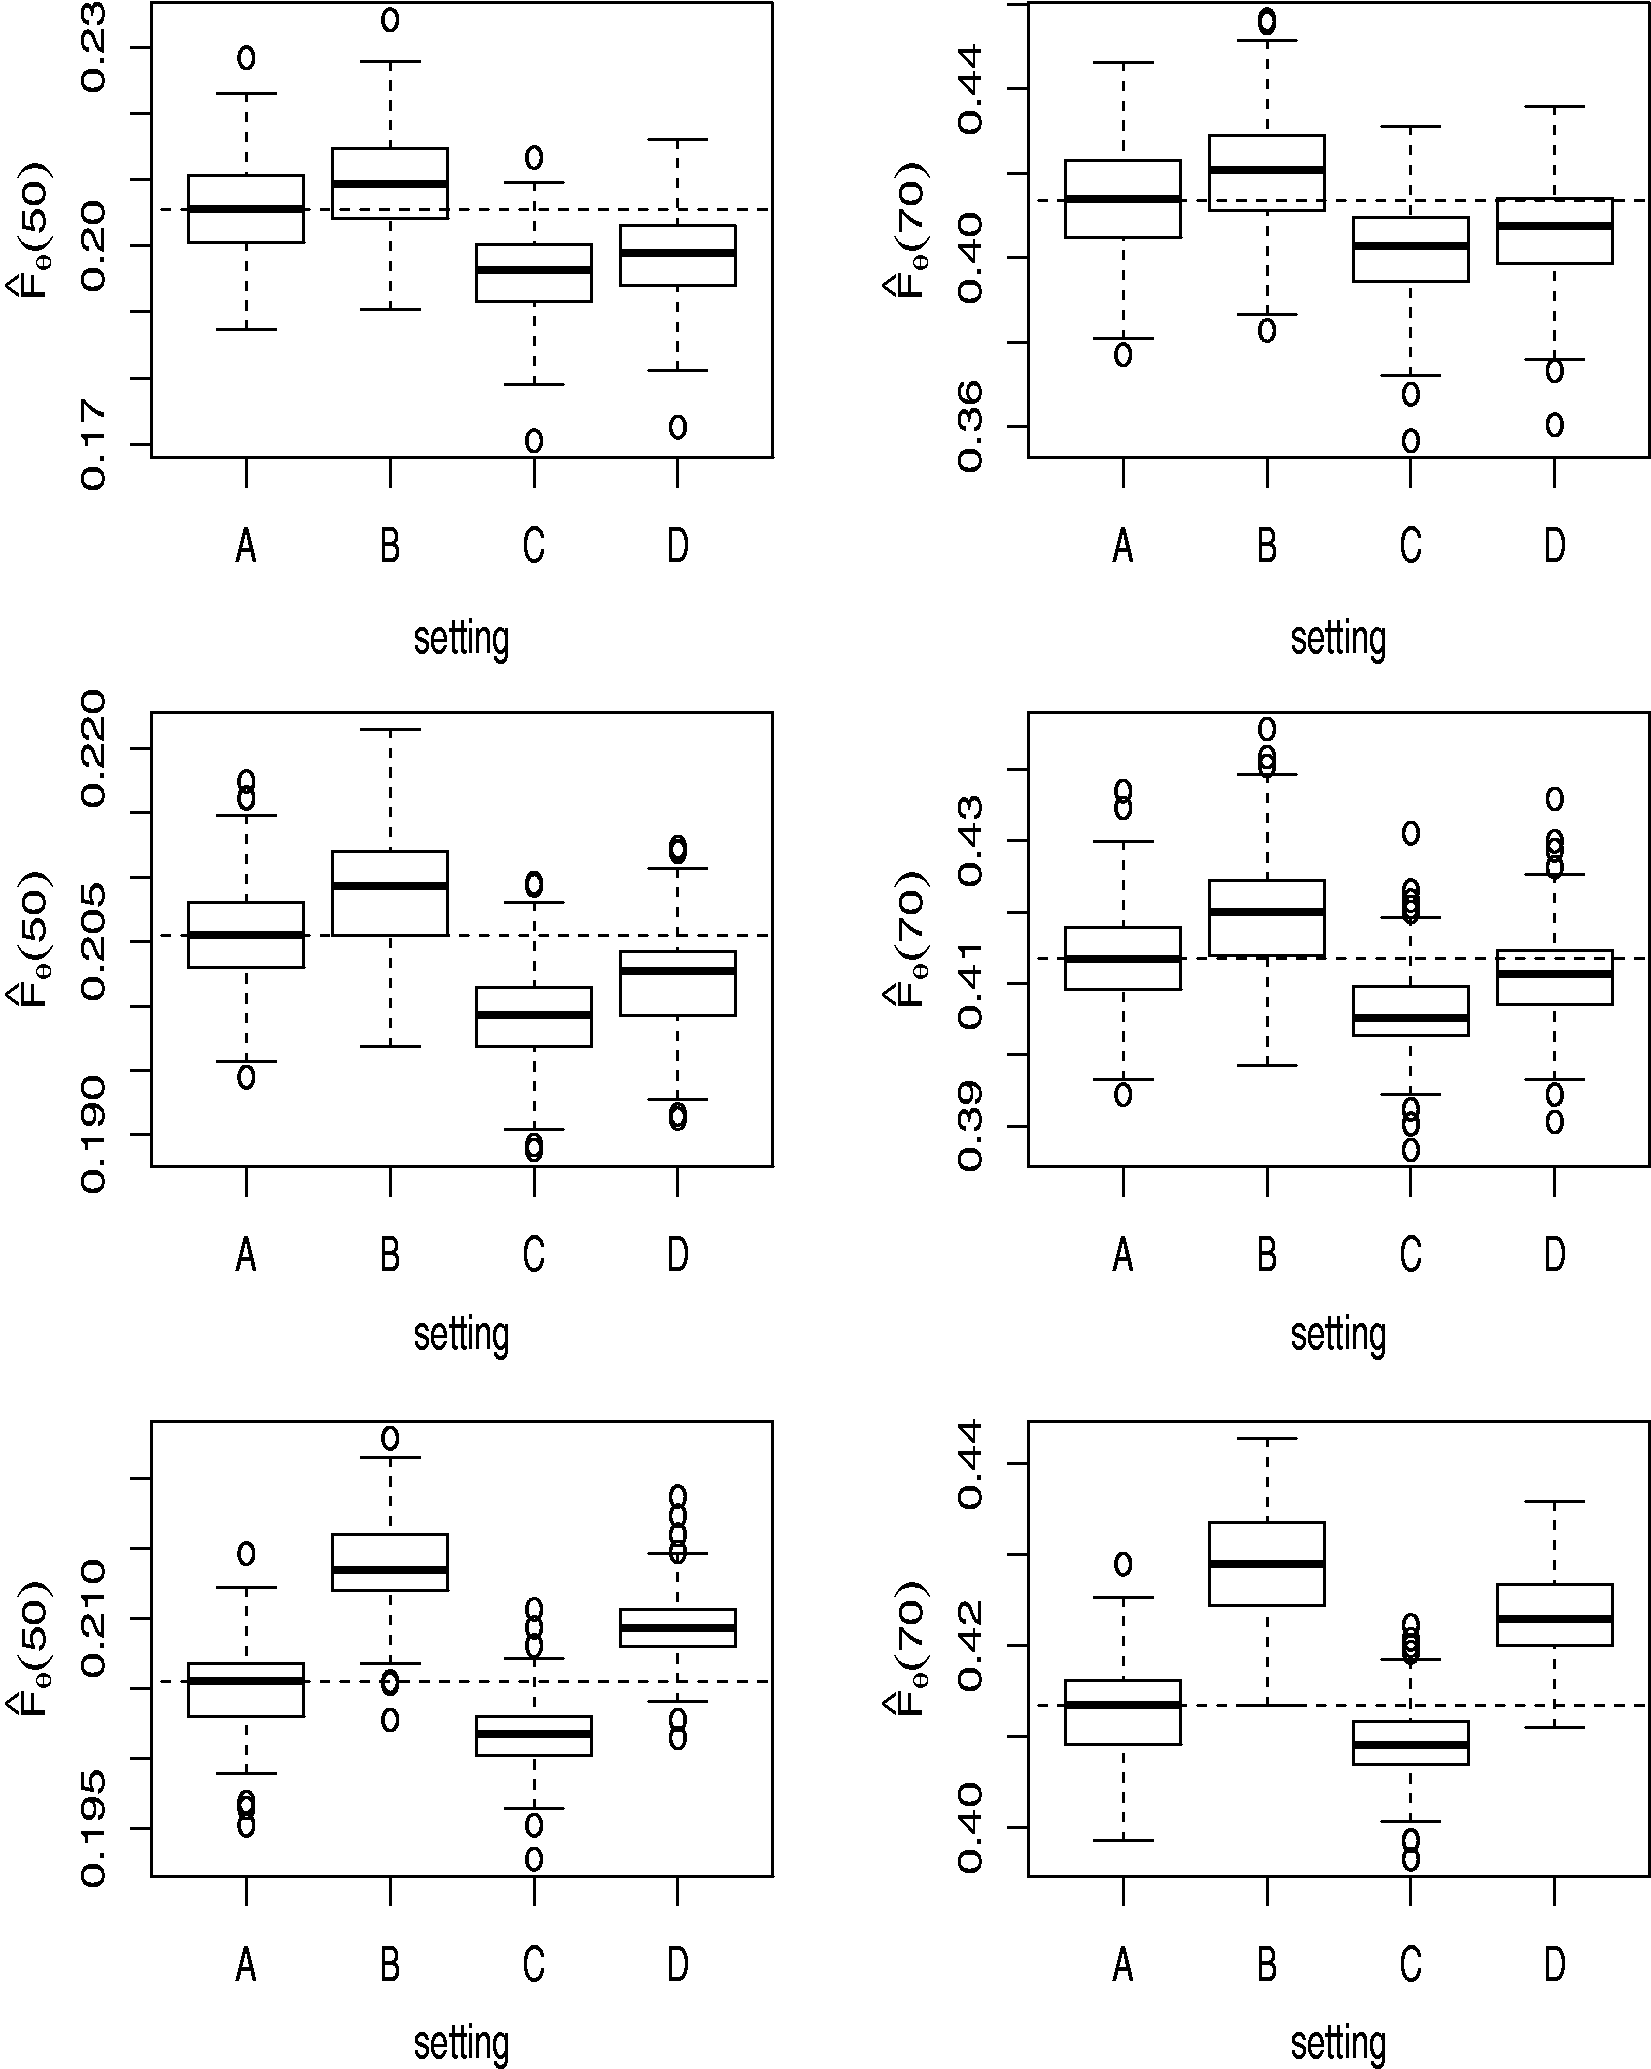
In the figure it can be seen that the penetrance function
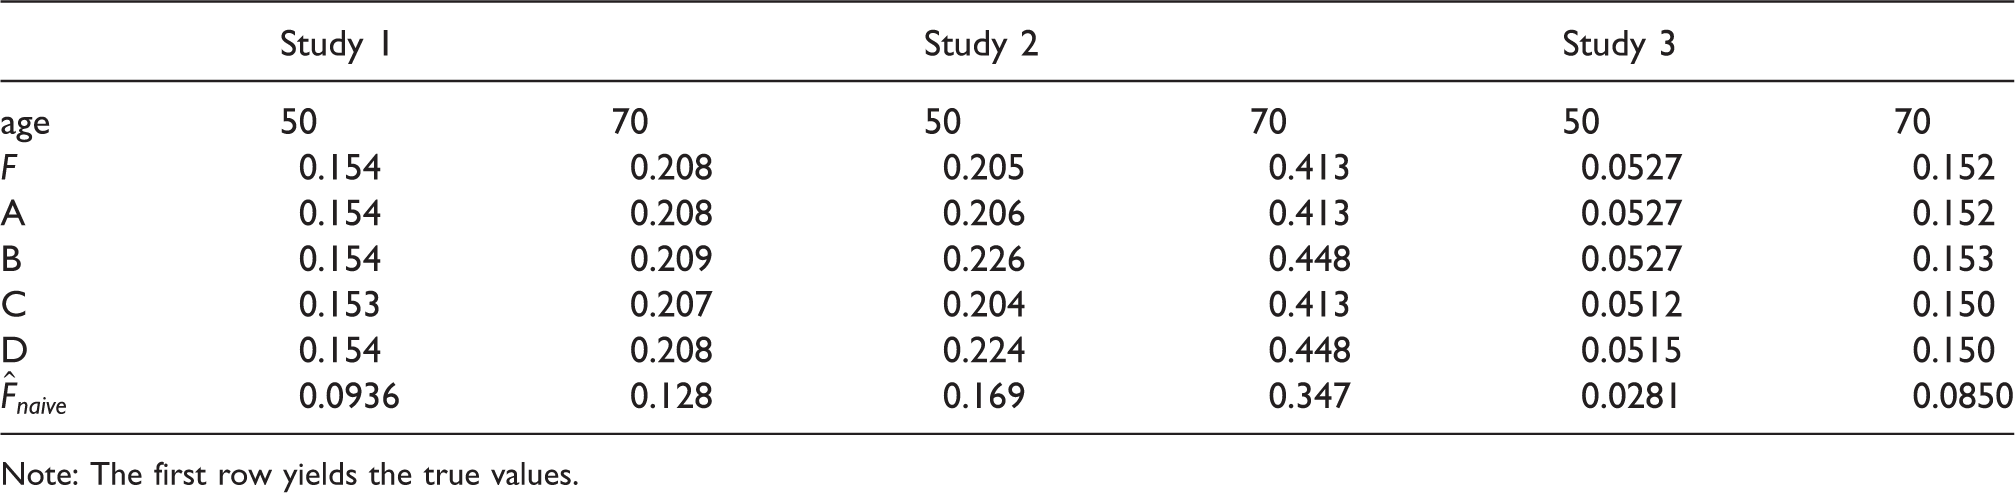
Table 1 shows the medians of the estimates for every setting as well as for the Kaplan–Meier estimate, denoted as Fnaive. It can be seen that this estimator strongly underestimates the penetrance function. The amount of bias depends on the values of nj; it decreases with increasing size nj as can be seen in Table 1. By increasing the pedigree sizes even further to nj = 50 for all families, the bias of the naive estimator decreases further:
In the application section, the maximum likelihood estimate of
Median of the estimates of F at the ages 50 and 70 by the estimates in the settings A, B, C and D and in the three different studies, and the naive estimator
Note: The first row yields the true values.
3.2 Application
The development of the method described in this paper was inspired by a study that was aimed at estimating the risk of developing a paraganglioma or pheochromocytoma (rare, usually benign neuroendocrine neoplasms) in carriers of germline SDHB gene variant. 7 The penetrance calculations were based on the age at detection of a paraganglioma/pheochromocytoma in affected carriers and the present age in unaffected living carriers or the age of death in unaffected deceased carriers, of 61 index patients and 133 relatives, 20 of which were affected with the disease at the end of the study and 113 of which were not. The study population was identified through the clinical genetics centers in The Netherlands. All individuals had consented to DNA testing, and all included individuals were identified as carriers of a SDHB gene variant predisposing to paraganglioma/pheochromocytoma. No data from familial non-carriers were available, nor from family members that did not consent to DNA testing. In the data analysis, it is assumed that all individuals without a family history of the associated disease at the time of the DNA screening are index patients; they are the first diagnosed patients in the family. Furthermore, it is assumed that those individuals with a positive family history at the time of DNA screening are relatives of an index patient.
Three different families of distributions are considered for the penetrance function
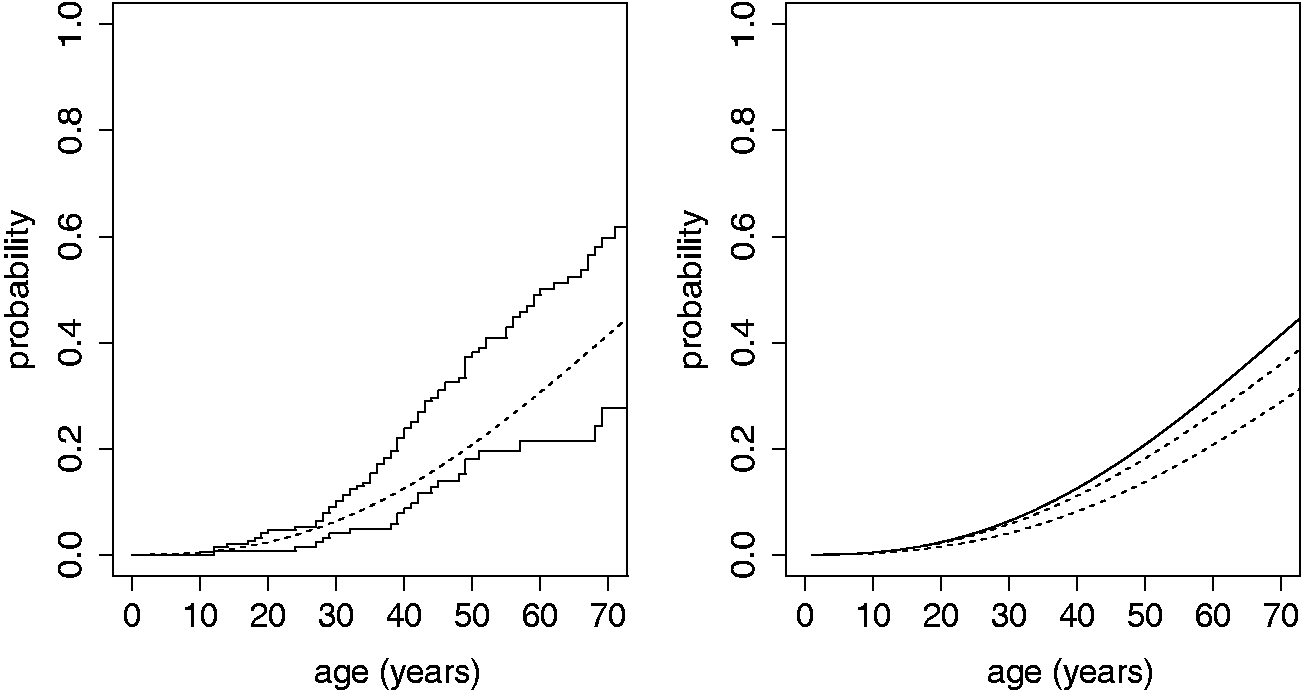
The average pedigree size in the data-set Left: Maximum likelihood estimate for Left:Kaplan–Meier estimates with (upper step-function) and without (lower step-function) index patient and the maximum likelihood estimate (continuous dashed line). Right: Maximum likelihood estimate (continuous line). The dashed lines indicate the range of possible bias due to missing of 20% individuals. Only a bias towards overestimation in the dataset is evaluated.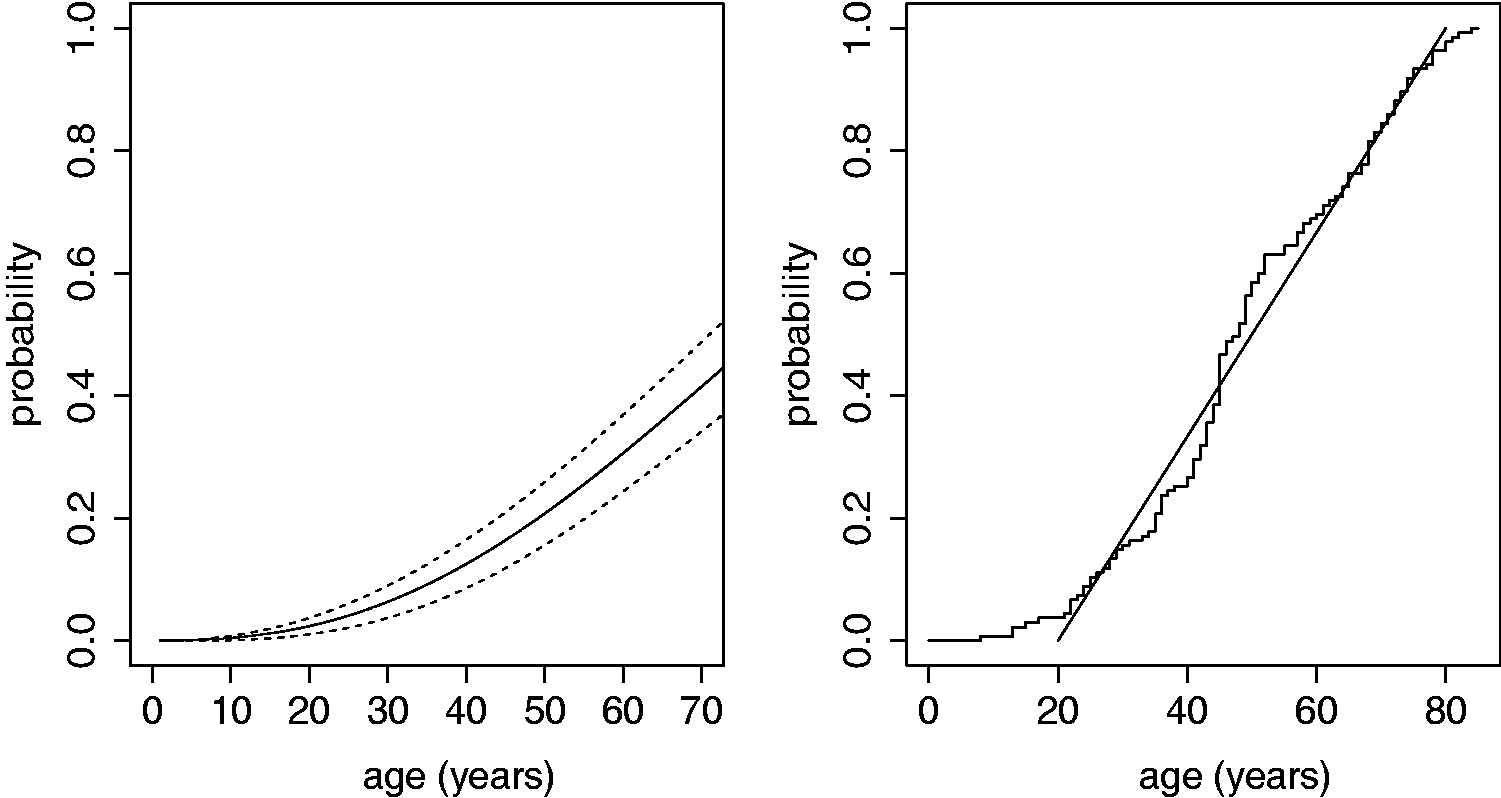
The three models (with the different families of distributions for
As demonstrated in Figure 3 (left), the Kaplan–Meier estimator based on the data including the index patients without correction for the way the data are ascertained, overestimates the penetrance function, whereas it underestimates the penetrance if data of non-index carriers is used only.
The maximum likelihood estimator is accurate if no data from relatives is missing and all carriers within a pre-specified degree have been tested. However, from the available data the number of carriers that have not been DNA-tested cannot be deduced, and since pedigree structures are not present, it is impossible to include obligate carriers in the data set manually or correct for family members with uncertain carrier status. The bias introduced by not including these individuals depends on the number of missing individuals and their genotypic and phenotypic status. It is likely that the missing family members are not entirely missing at random. It is likely that family members who experience symptoms are more inclined to consent to DNA testing than family members who are asymptomatic, which may lead to an over-representation of affected family members and thus an overestimation of the penetrance. To quantify a possible bias, we performed a simulation study for a scenario of maximal bias. We assumed that 20% of the relatives (33 individuals) are not tested and are therefore missing in the data set, and that all missing individuals are disease-free carriers (one could also assume that all missing individuals are affected carriers, but as affected family members are less likely to be missing from the data set, this possibility is not further evaluated here). From all unaffected carriers in the dataset, 33 are selected at random (with replacement) and added to the data. Next, the maximum likelihood estimate for the penetrance
4 Discussion
In this paper, we present a method for the estimation of the age-related penetrance of pathogenic gene variants in a cohort of multiple families with missing family data. A conditional likelihood is proposed, corrected for the way the data were ascertained. Since essential information is missing, full correction is not possible. Simulation studies show that the proposed estimator is only slightly biased in the simulation settings considered. Moreover, it is able to correct for the way the data are ascertained in a more accurate and robust way than conventional methods such as the Kaplan–Meier estimator based on non-index carriers.
The proposed estimator was based on a maximum likelihood method. These estimators are known to be almost always asymptotically unbiased and have a minimum variance. 8 As in any statistical analysis, some assumptions have been made: the first assumption is that the ages at onset of gene variant carriers are statistically independent. Environmental or genetic factors other than the gene variant of interest may also affect the age at onset of the disease and may be shared among family members. As it is unclear which individuals in the data-set belong to the same family and which do not, it is impossible to address these possible modifiers of disease risk and to correct for it.
For some diseases the age-at-onset distribution may depend on genetic characteristics, like the variant at the disease-susceptibility gene or the number of repeat units (for instance for the disease FSHD). To account for these genetic characteristics, the penetrance function F could be modeled by a (parametric) Cox-regression model that includes these genetic characteristics as covariates.
The estimation of the penetrance of pathogenic gene variants is ideally based on a large number of affected pedigrees, collected in a study with clear ascertainment rules, with a high uptake of DNA tests by family members and detailed descriptions of the phenotype of all variant carriers. However, many factors such as the severity and actionability of the disease, the availability of clinical or genetic information, familial relationships and dynamics, and the way the data are ascertained, may cause relevant data to be missing even after considerable effort to retrieve the information. This is especially true for rare and low-penetrant hereditary disease, as the awareness of the segregation of the hereditary trait within the family, the clinical characteristics and the perceived disease risk are generally lower in families with a limited number of affected family members, reducing the inclination to undergo DNA testing and clinical surveillance. As a consequence, penetrance estimations for rare and low-penetrant hereditary disease are usually based on cohorts comprising a limited number of affected patients and their nuclear families. To quantify the possible bias induced by the missing data as just described, simulation studies can be performed as was demonstrated in the section on the SDHB data.
With the growing insight into the genetic determinants of disease and the growing number of known carriers of a hereditary predisposition to disease, the need for accurate estimation of the disease risk of pathogenic gene variants will increase. Especially in rare and low-penetrant disease, current methods are prone to ascertaiment bias. The method described in this manuscript is aimed at providing more robust penetrance estimates when pedigree information is incomplete, a common situation in daily practice, and is shown to outperform the commonly used Kaplan–Meier estimator.
Footnotes
Declaration of conflicting interests
The author(s) declared no potential conflicts of interest with respect to the research, authorship, and/or publication of this article.
Funding
The author(s) received no financial support for the research, authorship, and/or publication of this article.