
Abstract
Marginal structural models are causal models designed to adjust for time-dependent confounders in observational studies with dynamically adjusted treatments. They are robust tools to assess causality in complex longitudinal data. In this paper, a marginal structural model is proposed with an innovative dose-delay joint-exposure model for Inverse-Probability-of-Treatment Weighted estimation of the causal effect of alterations to the therapy intensity. The model is motivated by a precise clinical question concerning the possibility of reducing dosages in a regimen. It is applied to data from a randomised trial of chemotherapy in osteosarcoma, an aggressive primary bone-tumour. Chemotherapy data are complex because their longitudinal nature encompasses many clinical details like composition and organisation of multi-drug regimens, or dynamical therapy adjustments. This manuscript focuses on the clinical dynamical process of adjusting the therapy according to the patient’s toxicity history, and the causal effect on the outcome of interest of such therapy modifications. Depending on patients’ toxicity levels, variations to therapy intensity may be achieved by physicians through the allocation of either a reduction or a delay of the next planned dose. Thus, a negative feedback is present between exposure to cytotoxic agents and toxicity levels, which acts as time-dependent confounders. The construction of the model is illustrated highlighting the high complexity and entanglement of chemotherapy data. Built to address dosage reductions, the model also shows that delays in therapy administration should be avoided. The last aspect makes sense from the cytological point of view, but it is seldom addressed in the literature.
1 Introduction
This paper presents a detailed discussion of how to analyse longitudinal chemotherapy data in order to assess the causal effect on the outcome of interest of weakening the exposure to cytotoxic agents. The outcome of interest here is Histologic Response (HRe), i.e. the improvement in the appearance of microscopic tissue specimens in a patient after chemotherapy, see Section 2. There are many a rationale behind such a choice. First, it is motivated by a precise clinical question (described below); second, it keeps the complexity of the model to a moderate level and clearly shows both complexity and entanglement of the data; last but not least, HRe is one of the strongest prognostic factors for survival in bone tumours like osteosarcoma 1 or Ewing sarcoma. 2
The analysis of longitudinal chemotherapy data is a complex task because of the presence of a negative feedback between the allocation of the exposure to chemotherapeutic drugs and the toxicities the latter provoke. Toxicities, developed by patients through a chemotherapy cycle, affect subsequent exposure by delaying the next cycle or reducing its dosage. Toxicities are hence time-dependent confounders 3 : they are at the same time risk factors a for HRe and predictors of subsequent exposure.
Marginal structural models (MSMs) were introduced by J. M. Robins in his seminal paper 6 as a class of models for estimating the causal effect of therapy modifications in presence of time-dependent confounders. MSMs are often based on Inverse-Probability-of-Treatment Weighted (IPTW) estimators,7,8 which create a pseudo-population by weighting each subject with the inverse of the probability of observing the allocation of dose delays/reductions. In this pseudo-population, toxicity history no longer predicts the next exposure, so a crude analysis estimates the causal effect of exposure modifications. A similar approach is used, for example, when fitting a Cox model in the presence of informative censoring,9,10 but in this case the method is known as inverse-probability-of-censoring weighted (IPCW) estimation.
Alternative to MSMs is the mini-trials approach, described in Klein et al. 11 [§7.4]. However, this method works well only with simple exposure-schemes like starting versus not starting an antiretroviral therapy (and keeping it indefinitely). The key idea of mini-trials is that at each time period, e.g. every month, a fictitious case-control study is started, with the control group formed by all patients that have not yet initiated the therapy. When those patients eventually begin the antiretroviral therapy, they must be artificially censored from each control group they are participating to. Since the censoring is clearly informative, IPCW methods are required to compensate the selection due to the artificial censoring.
Structural nested models (SNMs)12,13 – and structural nested failure time models (SNFTMs)14–16 in case of time-to-event data – can also be used in the presence of an exposure-confounder feedback. As the name reveals, these models are nested and require the specification of a quantile–quantile transformation that models the effect of skipping the kth treatment on the outcome of interest. Fitting a SNM is usually much more complicated than a MSM and requires g-estimation.17,18 Although there are situations where SNMs overcome limitations in the applicability of MSMs, 19 the latter are enough to address the research question stated below.
This paper presents a MSM designed to mimic a randomised trial where the reduction of the exposure intensity is no longer confounded by the toxicity. Since the intensity of the exposure can be weakened by allocating dose reductions and/or cycle delays, an innovative bivariate exposure model is proposed for the computation of the IPTW estimators. This model is then applied to preoperative data from a large study in resectable osteosarcoma,
Ethical issues make difficult to design clinical trials able to address this research question. Reducing the number of courses of MTX would greatly improve the patients’ quality of life because of the unpleasant side-effects produced by this drug at the high dosages administered in osteosarcoma. However, before actually implementing any reduction in the treatment, thorough assessments of the reduction effects are necessary not to compromise patients’ prognosis.
MSMs for bivariate exposure-models have been already partially studied in the literature. The earliest example is discussed in Hernán et al., 20 where the authors estimate the joint causal effect on survival if the start of anti-retroviral therapy and prophylaxis for Pneumocystis Carinii Pneumonia (PCP) is delayed. More recently, the joint effect on mortality of obesity and smoking status was studied in Banack and Kaufman, 21 while Howe et al. 22 address the risk of HIV acquisition due to joint exposure to alcohol and injection drugs. However, this is the first paper where, to the best of the authors’ knowledge, MSMs are applied to a class of particularly complex data such as those collected through randomised trials of chemotherapy.
Provided that longitudinal data are available from drug administrations (doses in mg/m2, treatment dates, and toxicity grades), the model presented here is appropriate to analyse chemotherapy treatments in general. This is particularly true for the treatment of paediatric cancer, where the exposure-confounder feedback is more pronounced.
2 Complexity of chemotherapy data from randomised trials
Multi-agent regimens are designed to maximise the total cell kill within the range of toxicities tolerated by the patient. 23 They also reduce the chance of developing drug-resistant recurrences, which are typical of single-agent regimens. 24 Thus, cytotoxic agents are usually combined to design protocols, which specify rules for administering each drug with respect to both dosage and schedule.
Chemotherapy protocols are very difficult to evaluate because of the large number of alternatives one can test. For example, evidence is in favour of sequential administration of single-agent treatments over multi-drug combinations in advanced breast cancer. 25 In osteosarcoma, the efficacy of combination-chemotherapy is not debated. Nevertheless, adding one more agent to a two-drug protocol significantly improves survival, but the addition of a fourth drug does not. 26 Drug-administration plans, and their organisation in chemotherapy cycles, are another aspect that must be taken into account. The compression of conventional schedules is thought to achieve greater efficacy by minimising regrowth of tumour cells between treatment cycles. 27
The situation is further complicated by the dynamical adjustment of the treatment on patients’ clinical picture. Exposure to chemotherapy is likely to produce multi-systemic side effects, e.g. organ toxicity or myelosuppression. These side effects are a threat to patient’s life and must be controlled by allocating either dose reductions/discontinuations or delays in the administration of the next course. Toxic side effects are often recorded using the Common Terminology Criteria for Adverse Events (CTCAE) grades
28
from 0 to 5. Many different toxicities are recorded in both randomised and non-randomised controlled trials (usually more than 20), and
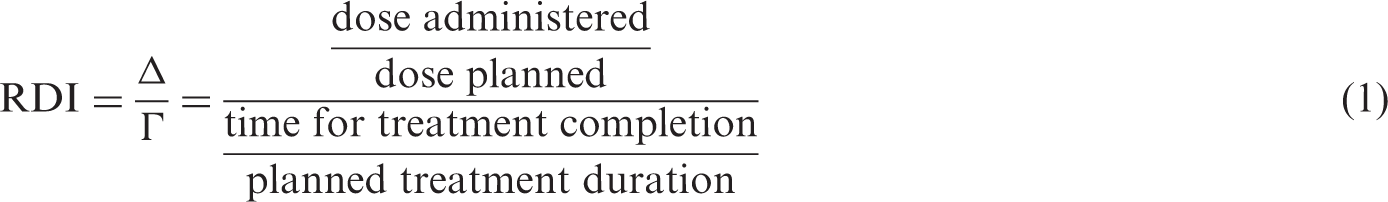
Both dose reductions/discontinuations or delays have the effect of reducing the intensity of subsequent exposure. This is typically measured by the so-called Received Dose Intensity
b
(RDI)
Another difficulty lies in the therapy variations that may be permitted by a flexible protocol. For example, the
Finally, one has to deal with the way chemotherapy data were collected. In the
3 Materials and methods
This manuscript analyses preoperative data from Illustration of the 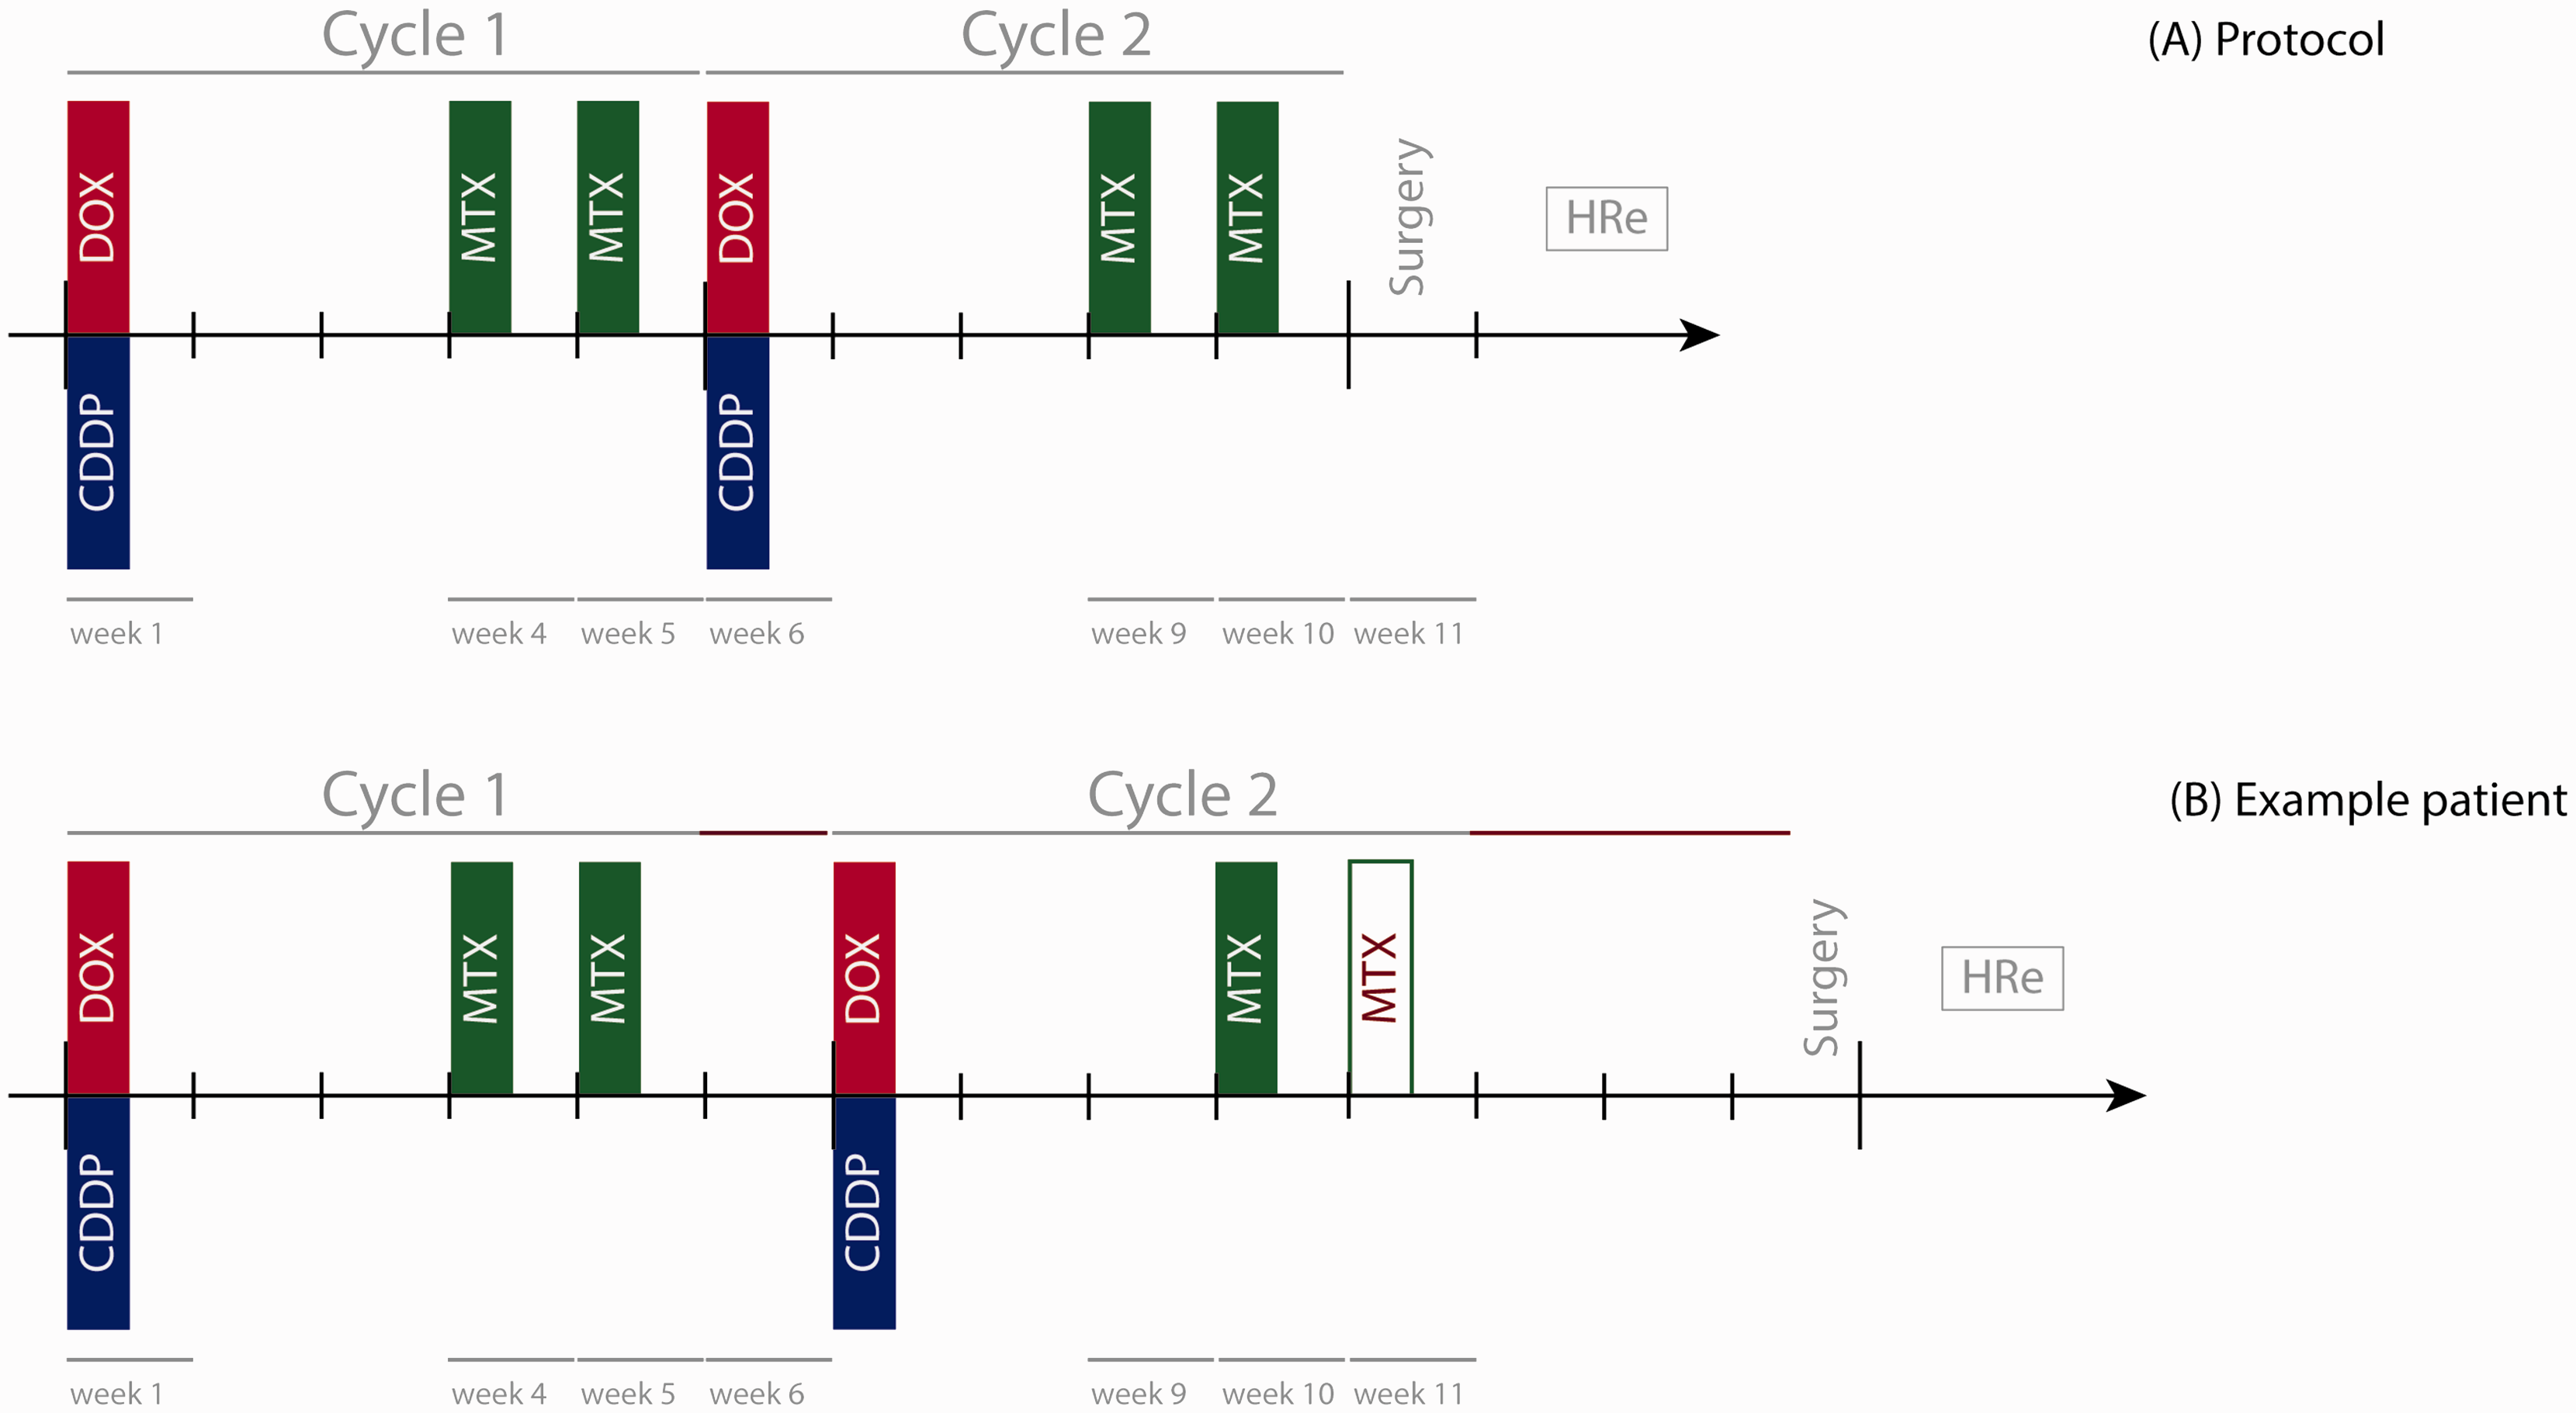
At clinicians’ discretion, one or two extra courses of MTX could have been administered between the end of cycle 2 and surgery to adjust the preoperative exposure to MTX. Depending on the HRe, after surgery subjects were randomised to post-operative treatments having nominal duration of 28 weeks.
HRe is a strong prognostic factor for both overall and event-free survival.
1
Although the main results on survival in
3.1 Dataset description
The initial dataset included 457 patients enrolled between 2005 and 2011 in the branch of
Filtering patients that met the criteria for this analysis gave 364 patients, of which 58% were males and 42% were females. Age in the sample ranged from 4 to 40 following a distribution that is in line with the clinical literature of osteosarcoma. Figure 2 illustrates the patients’ selection through a CONSORT-like diagram.
CONSORT-like diagram illustrating selection of patients.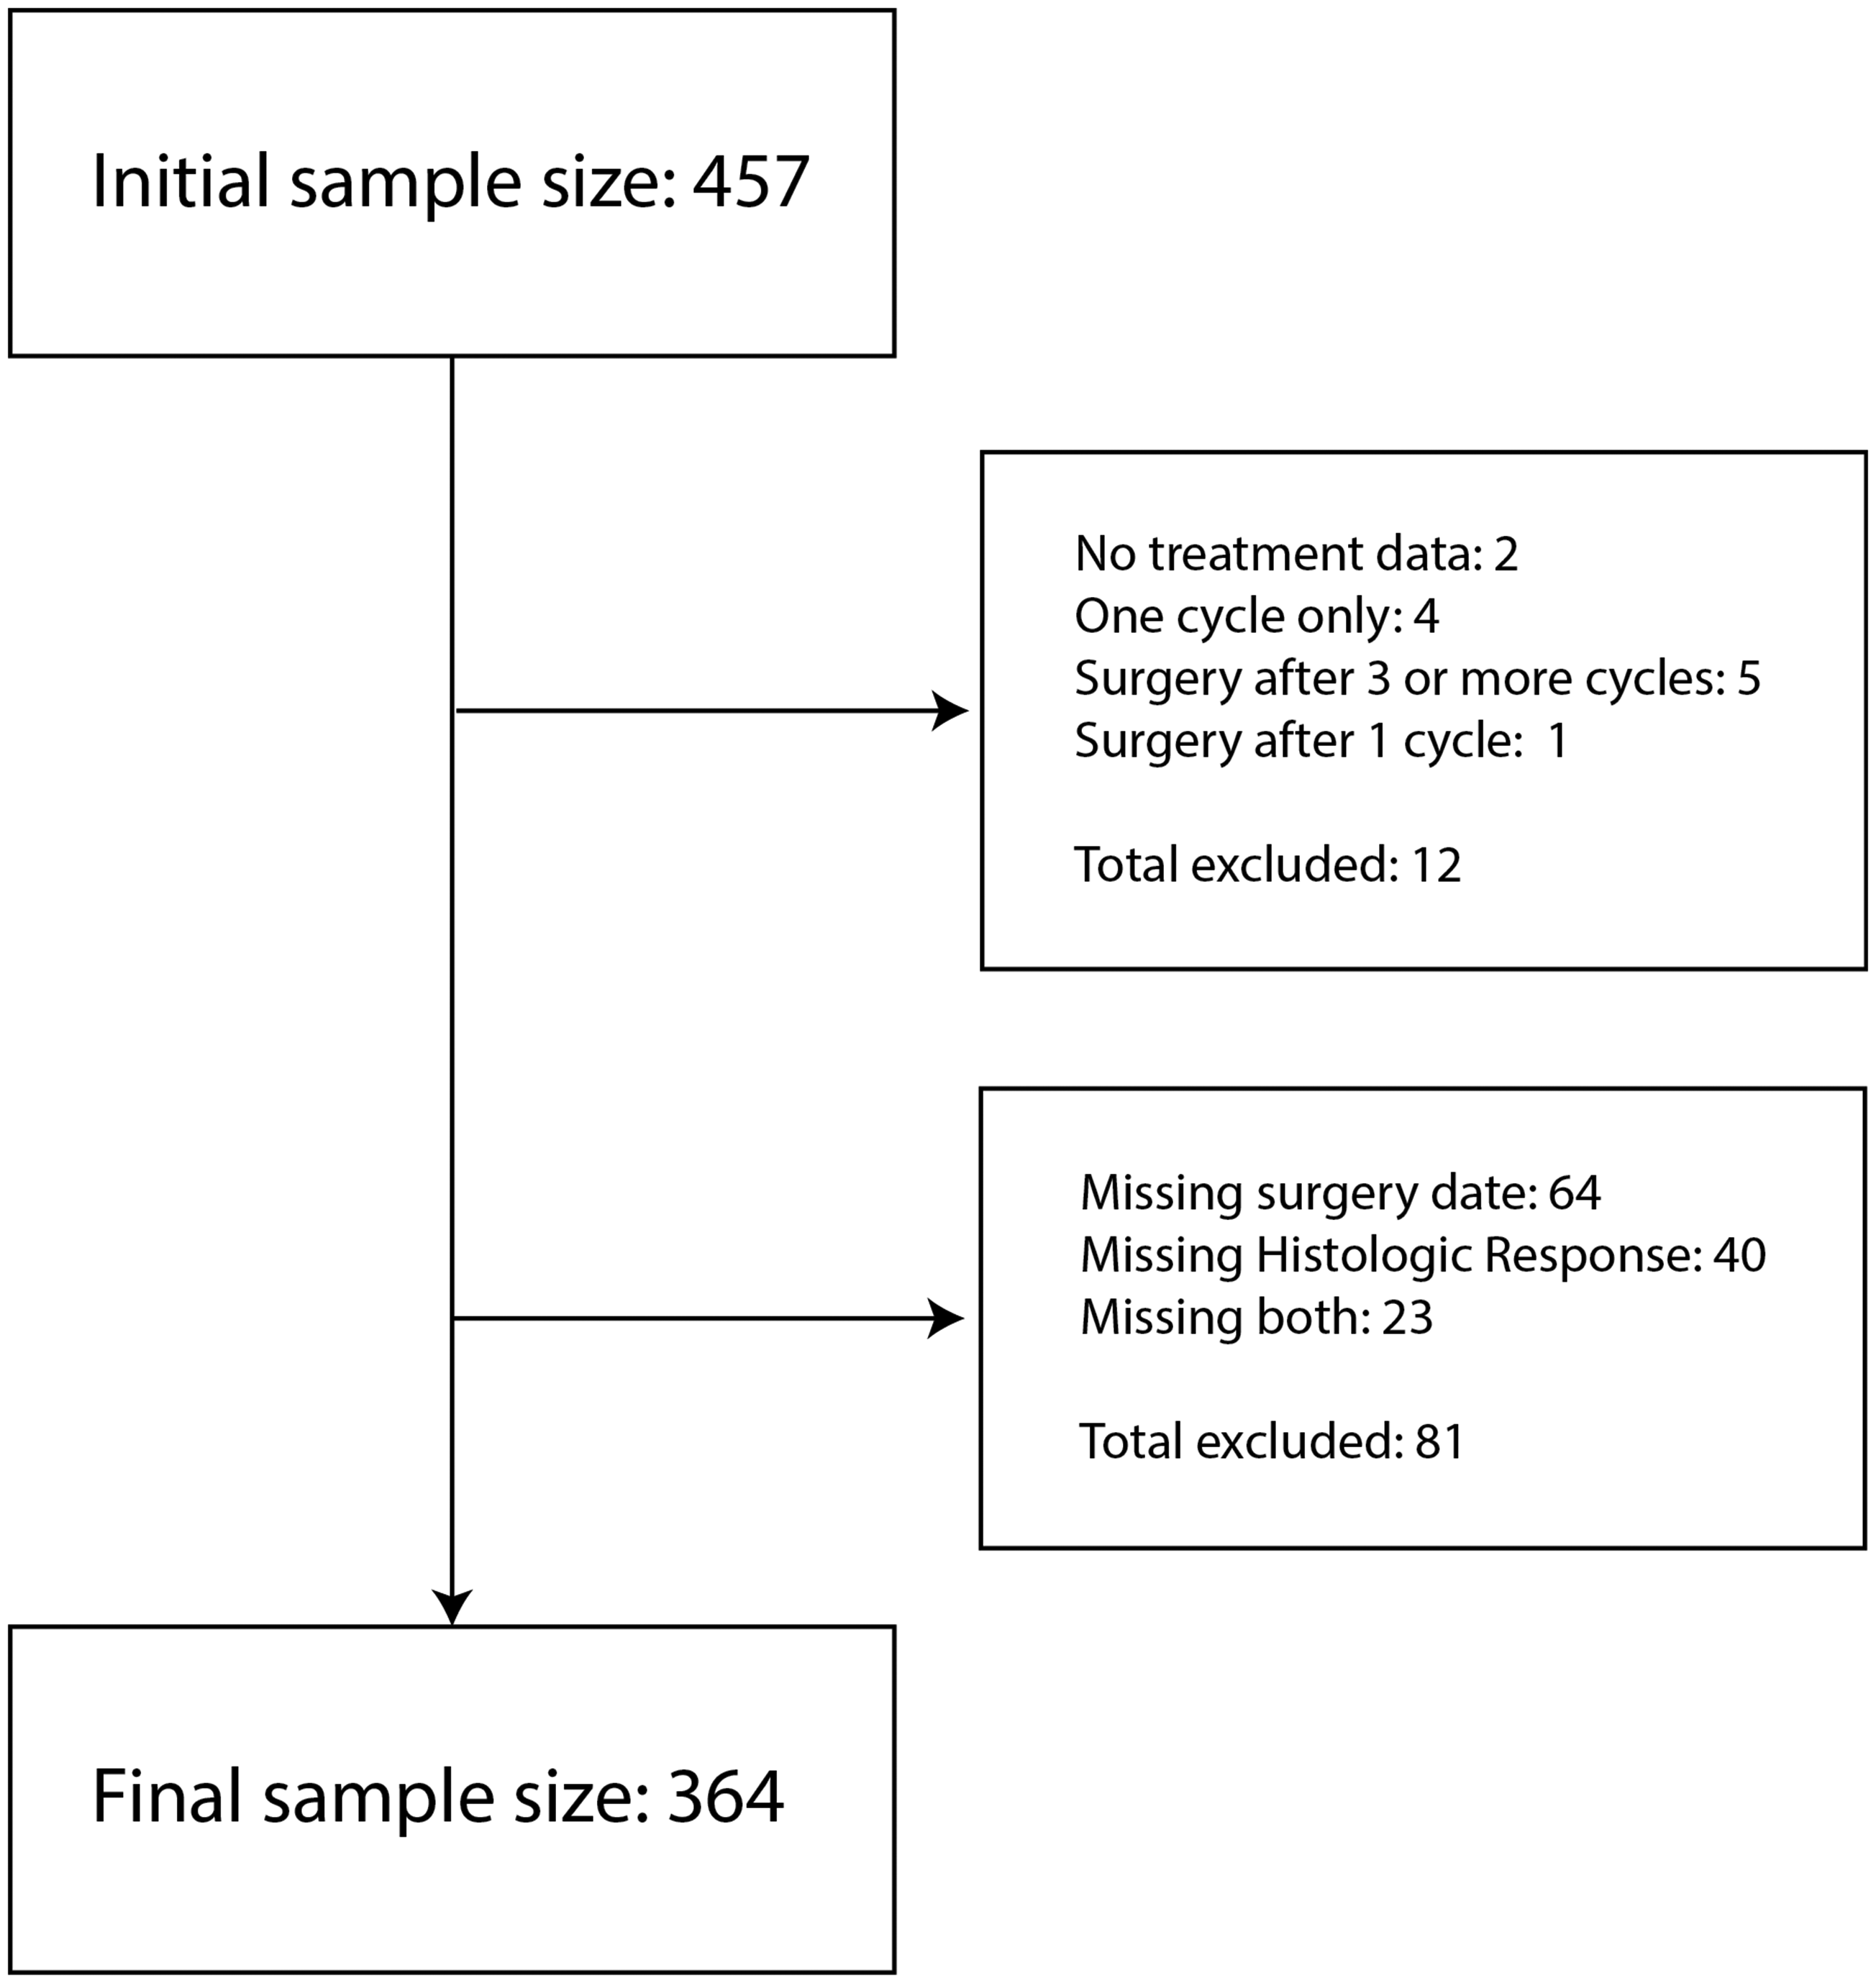
Among the 93 patients excluded from this analysis, 71 have surely undergone surgery because only one between HRe and surgery time is missing. The event/censoring time of the remaining 22 patients is in general much larger than the nominal duration of the preoperative treatment, see Figure 3. In addition, for nearly all of them (20/22), the completion of preoperative treatment could be assessed from chemotherapy data.
Event/censoring time (red and blue, respectively) for the subjects with both HRe and surgery date missing. The dashed line marks 77 days from registration, i.e. the nominal surgery time; all event/censoring times lie beyond it.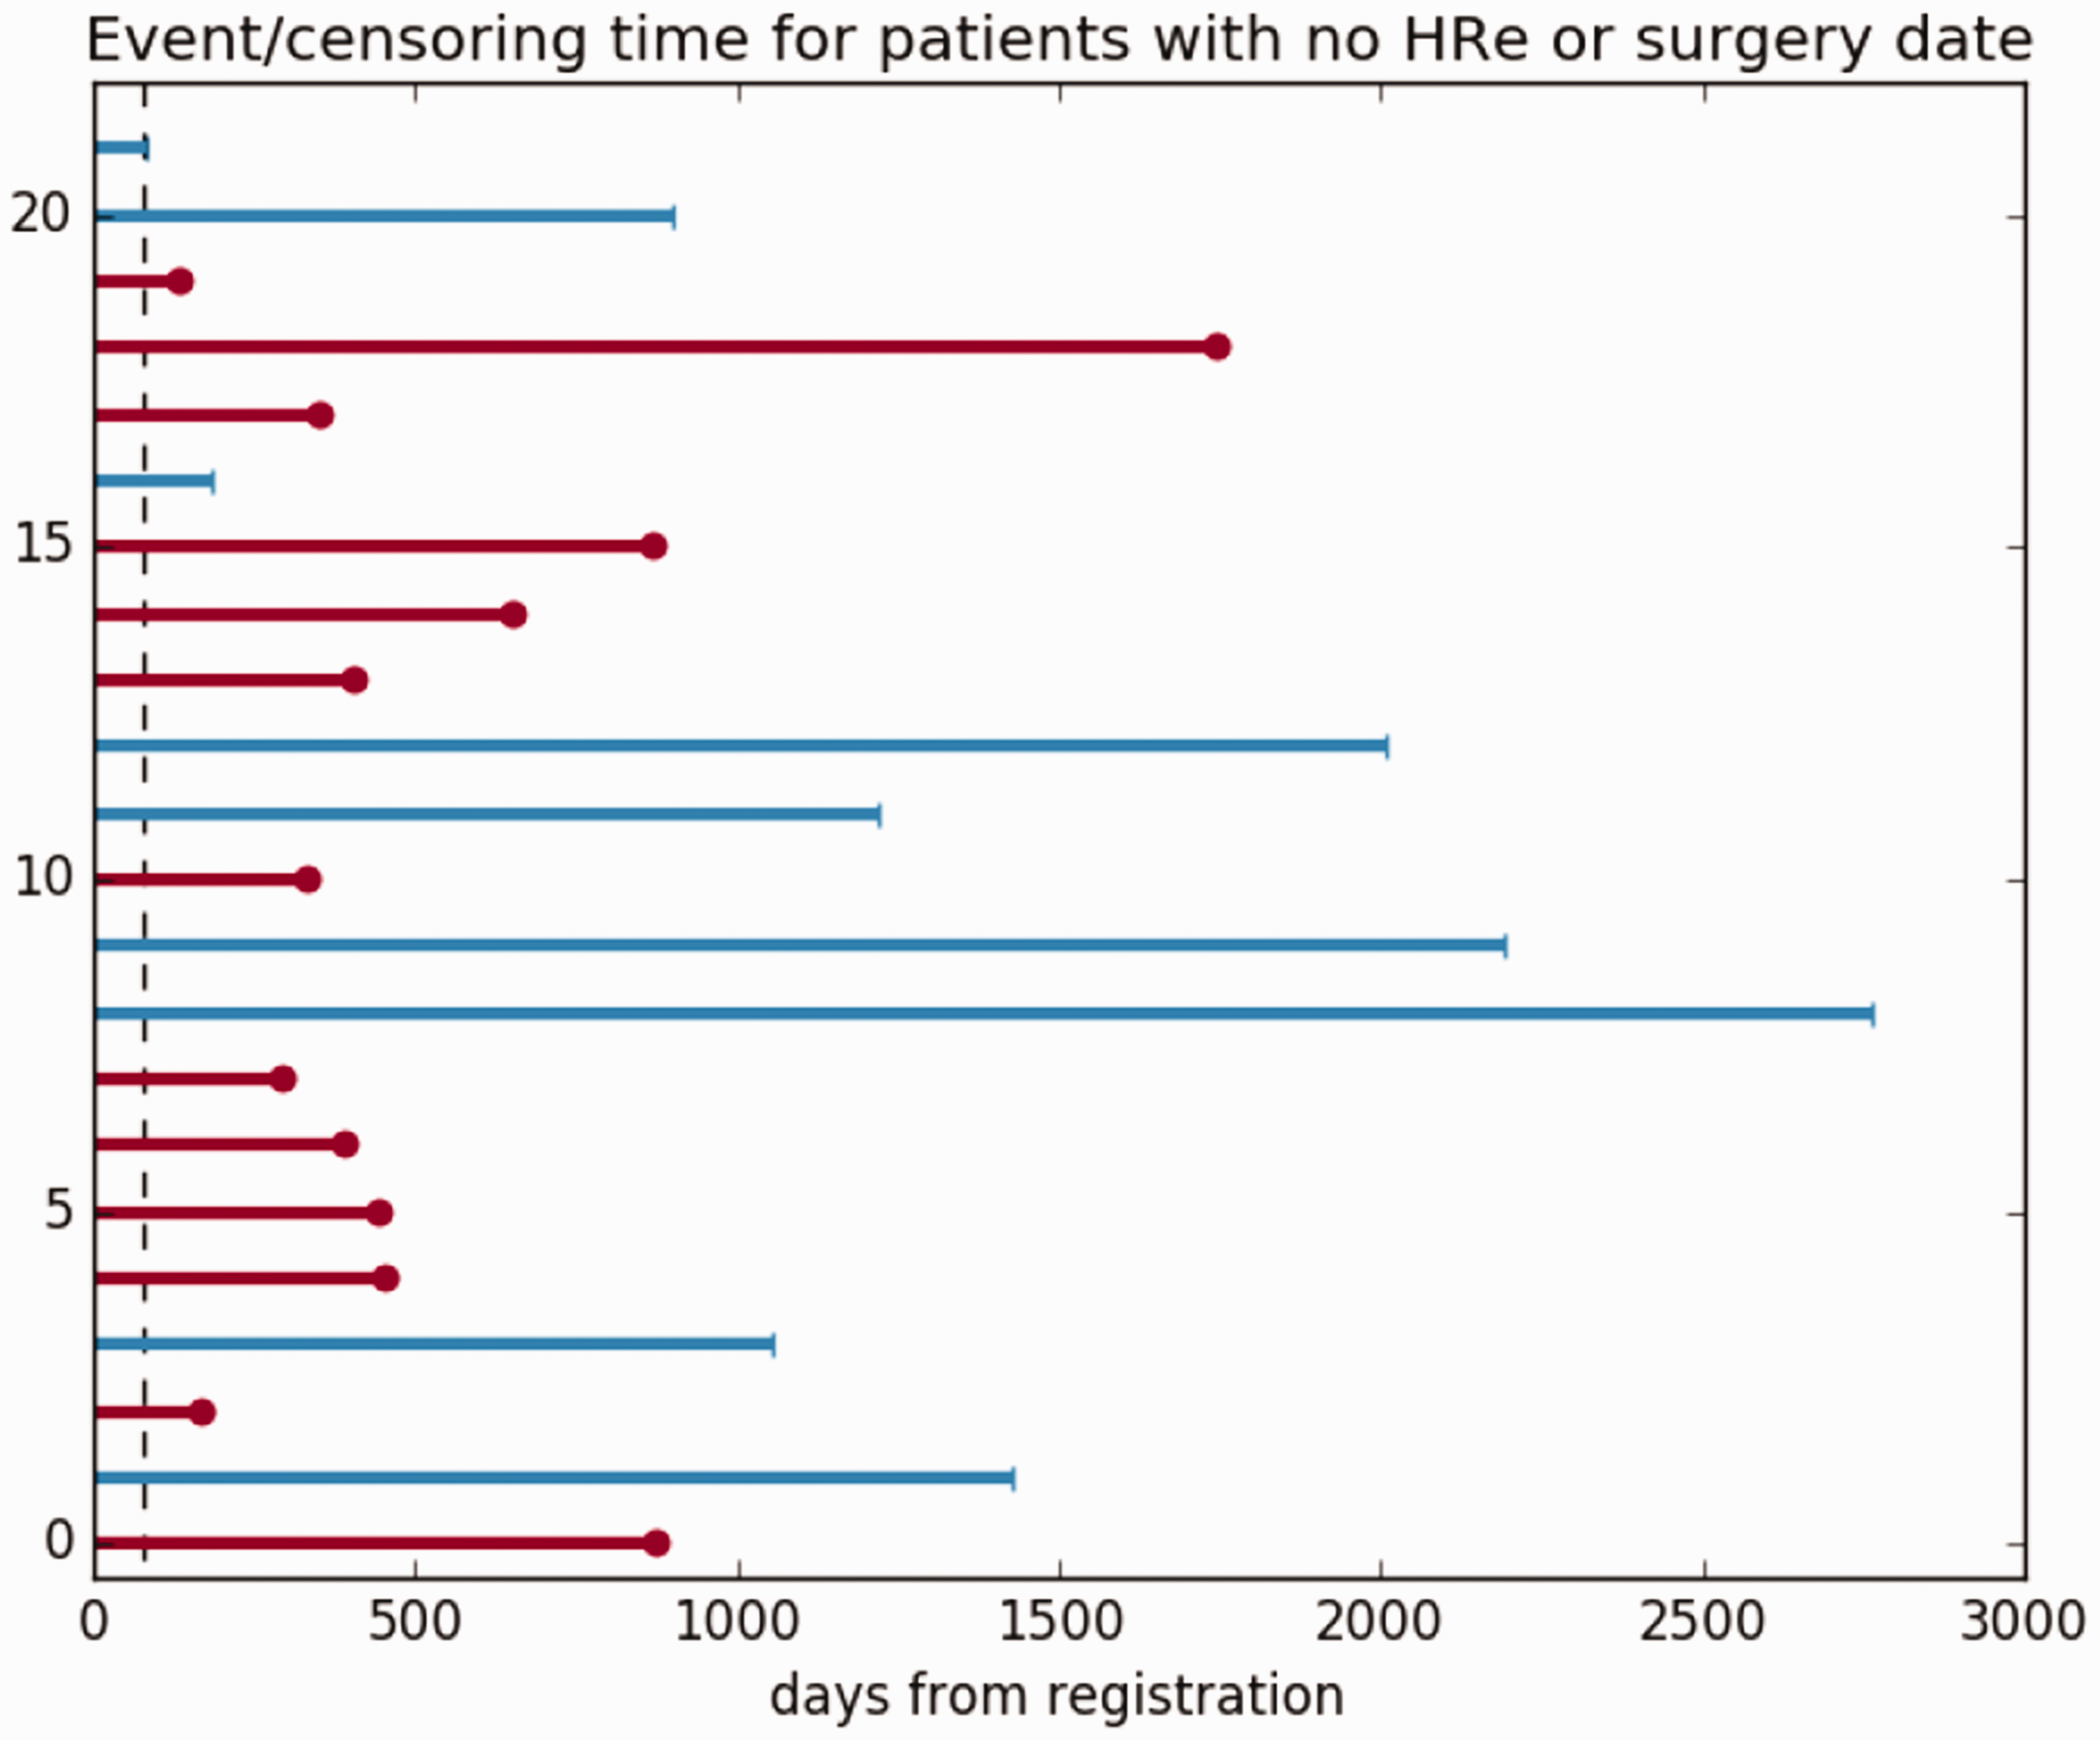
In the chemotherapy registration form of
As outlined in Section 1, the clinical question motivating this paper targets the possibility of reducing exposure to MTX. Data of DOX and CDDP was explored first to evaluate the administration of these two drugs. Figure 4 plots, for each cycle, the standardised dose
f
of DOX + CDDP against the standardised dose of MTX. Some properties of the dataset can be derived from this figure:
Only a negligible fraction of the subjects reported a reduction in the dosage of DOX + CDDP. This finding permits the exclusion of DOX + CDDP from the definition of the exposure in Section 3.3. Only course discontinuations occurred in the adjustment of MTX dosage. Indeed, the standardised dose per cycle of MTX is tightly located around half-integer values, i.e. no partial doses were administered and the number of MTX courses can be reconstructed from the standardised dose. This finding is in line with what the Collected data are not clear about the effect of toxicities on delays. The chemotherapy registration form included a field named “did this toxicity cause delay or reduction?”. However, Figure 4 shows in blue (no delay/reduction) some subjects with a marked dose reduction of either DOX + CDDP or MTX. To detect delays, expected cycle durations with the recorded ones were compared. Standardised dose of DOX plus CDDP against standardised dose of MTX. Points lying between the two horizontal (resp. vertical) dotted lines correspond to an administered dose of DOX + CDDP (resp. MTX) within 5% from the intended dosage. Points are coloured in red/blue depending on whether, according to the chemotherapy-registration-form dedicated field, at least a toxicity caused a delay/reduction. On the right part of the lower subfigure, it is possible to notice two groups of patients who received one and two extra courses of MTX.
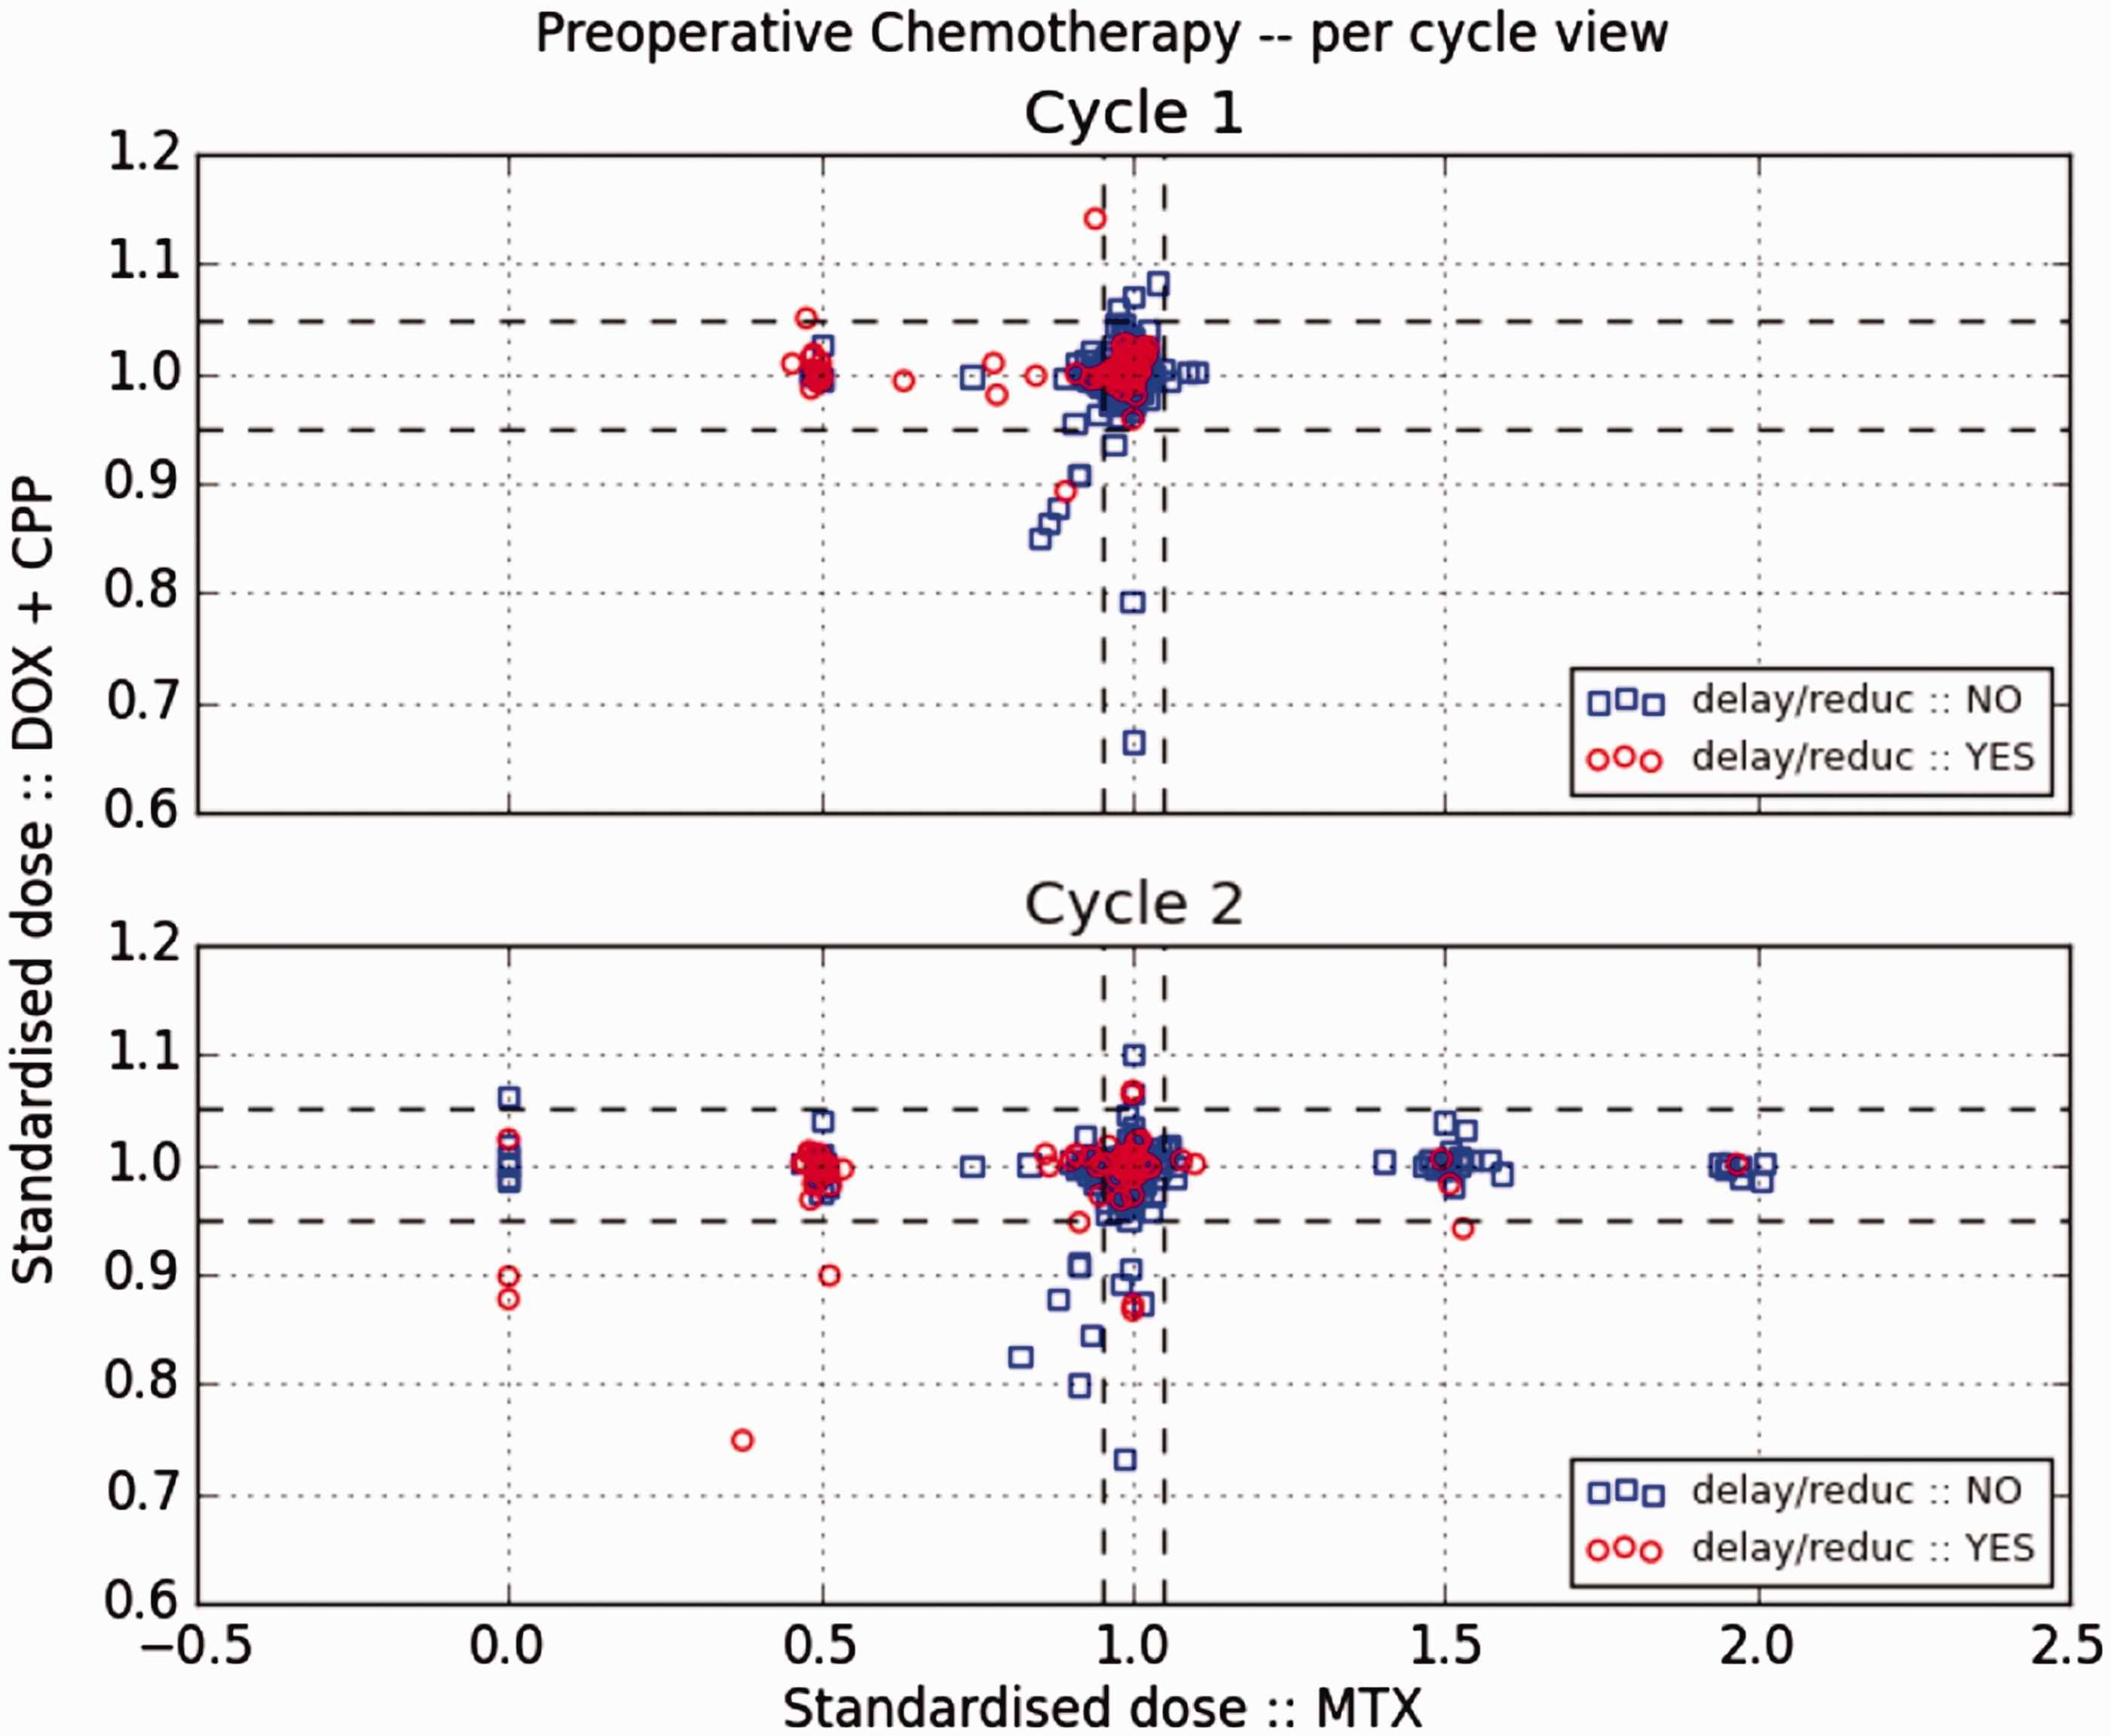
Figure 5 plots the RDI of MTX against its standardised dose. The solid line satisfies the equation RDI of MTX against standardised dose of MTX. A cycle lasted less than expected for subjects above the solid line and more than expected (delay) for subjects below it.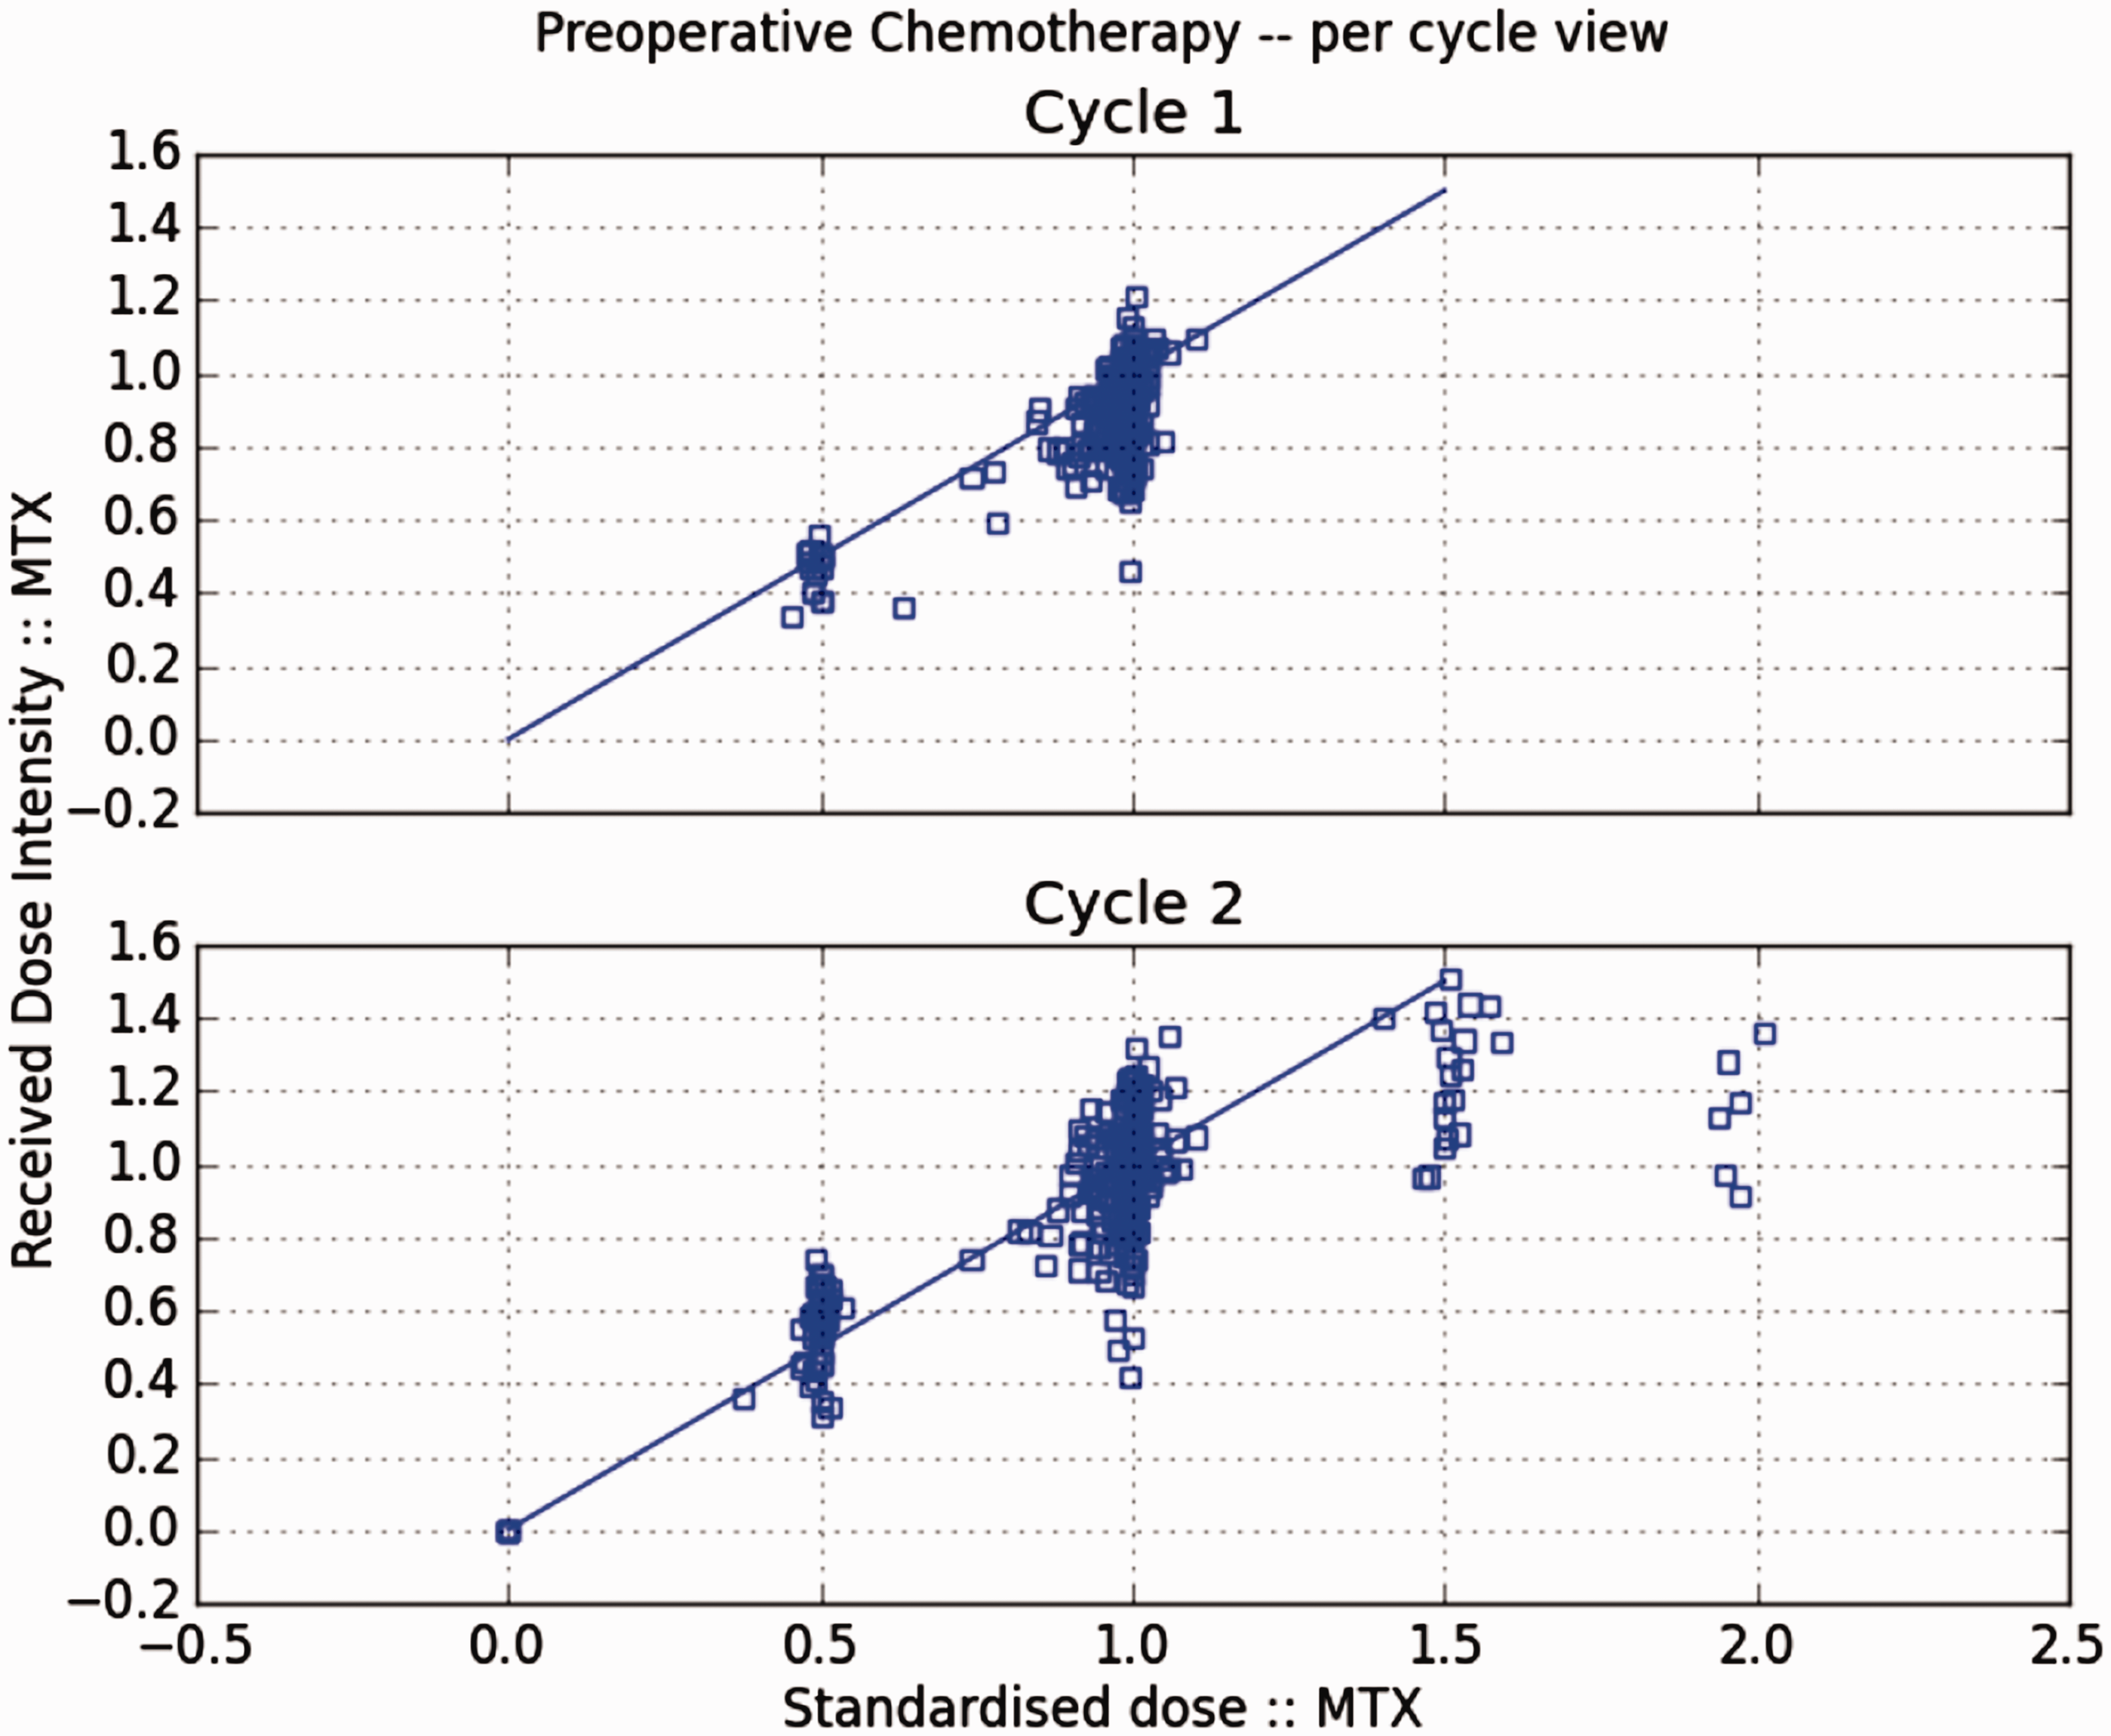
Another two comments can be drawn from this figure:
The actual duration of cycles presents both anticipations (up to a week) and delays (up to three weeks). This reflects the clinical experience, where variations to the chemotherapy intended-schedule frequently happen often for practical reasons for scheduling. Only a negligible fraction of subjects entirely discontinued MTX in cycle 2 (RDI = 0). Usually MTX reductions involved only one of the two courses planned in each cycle.
3.2 Modelling the exposure-toxicity feedback
As mentioned above, the
As pointed out by Property 1 above, dosage of DOX + CDDP is close to nominal for the large majority of the subjects and can be thus excluded from the exposure. Moreover, one should keep in mind that clinical evaluations of toxicity are always performed before starting the administration of every dose. A patient must satisfy a number of requirements before the administration of any course of MTX. Among these, Mucositis (which falls in the category MT) not worse than CTCAE grade 1; no liver/urinary/ventricular dysfunctions (all included in LV); an adequate White Blood Count (WBC) and platelets count (again MT).
The causal structure proposed here for the Direct Acyclic Graph (DAG) for the causal relationships between exposure and confounders in 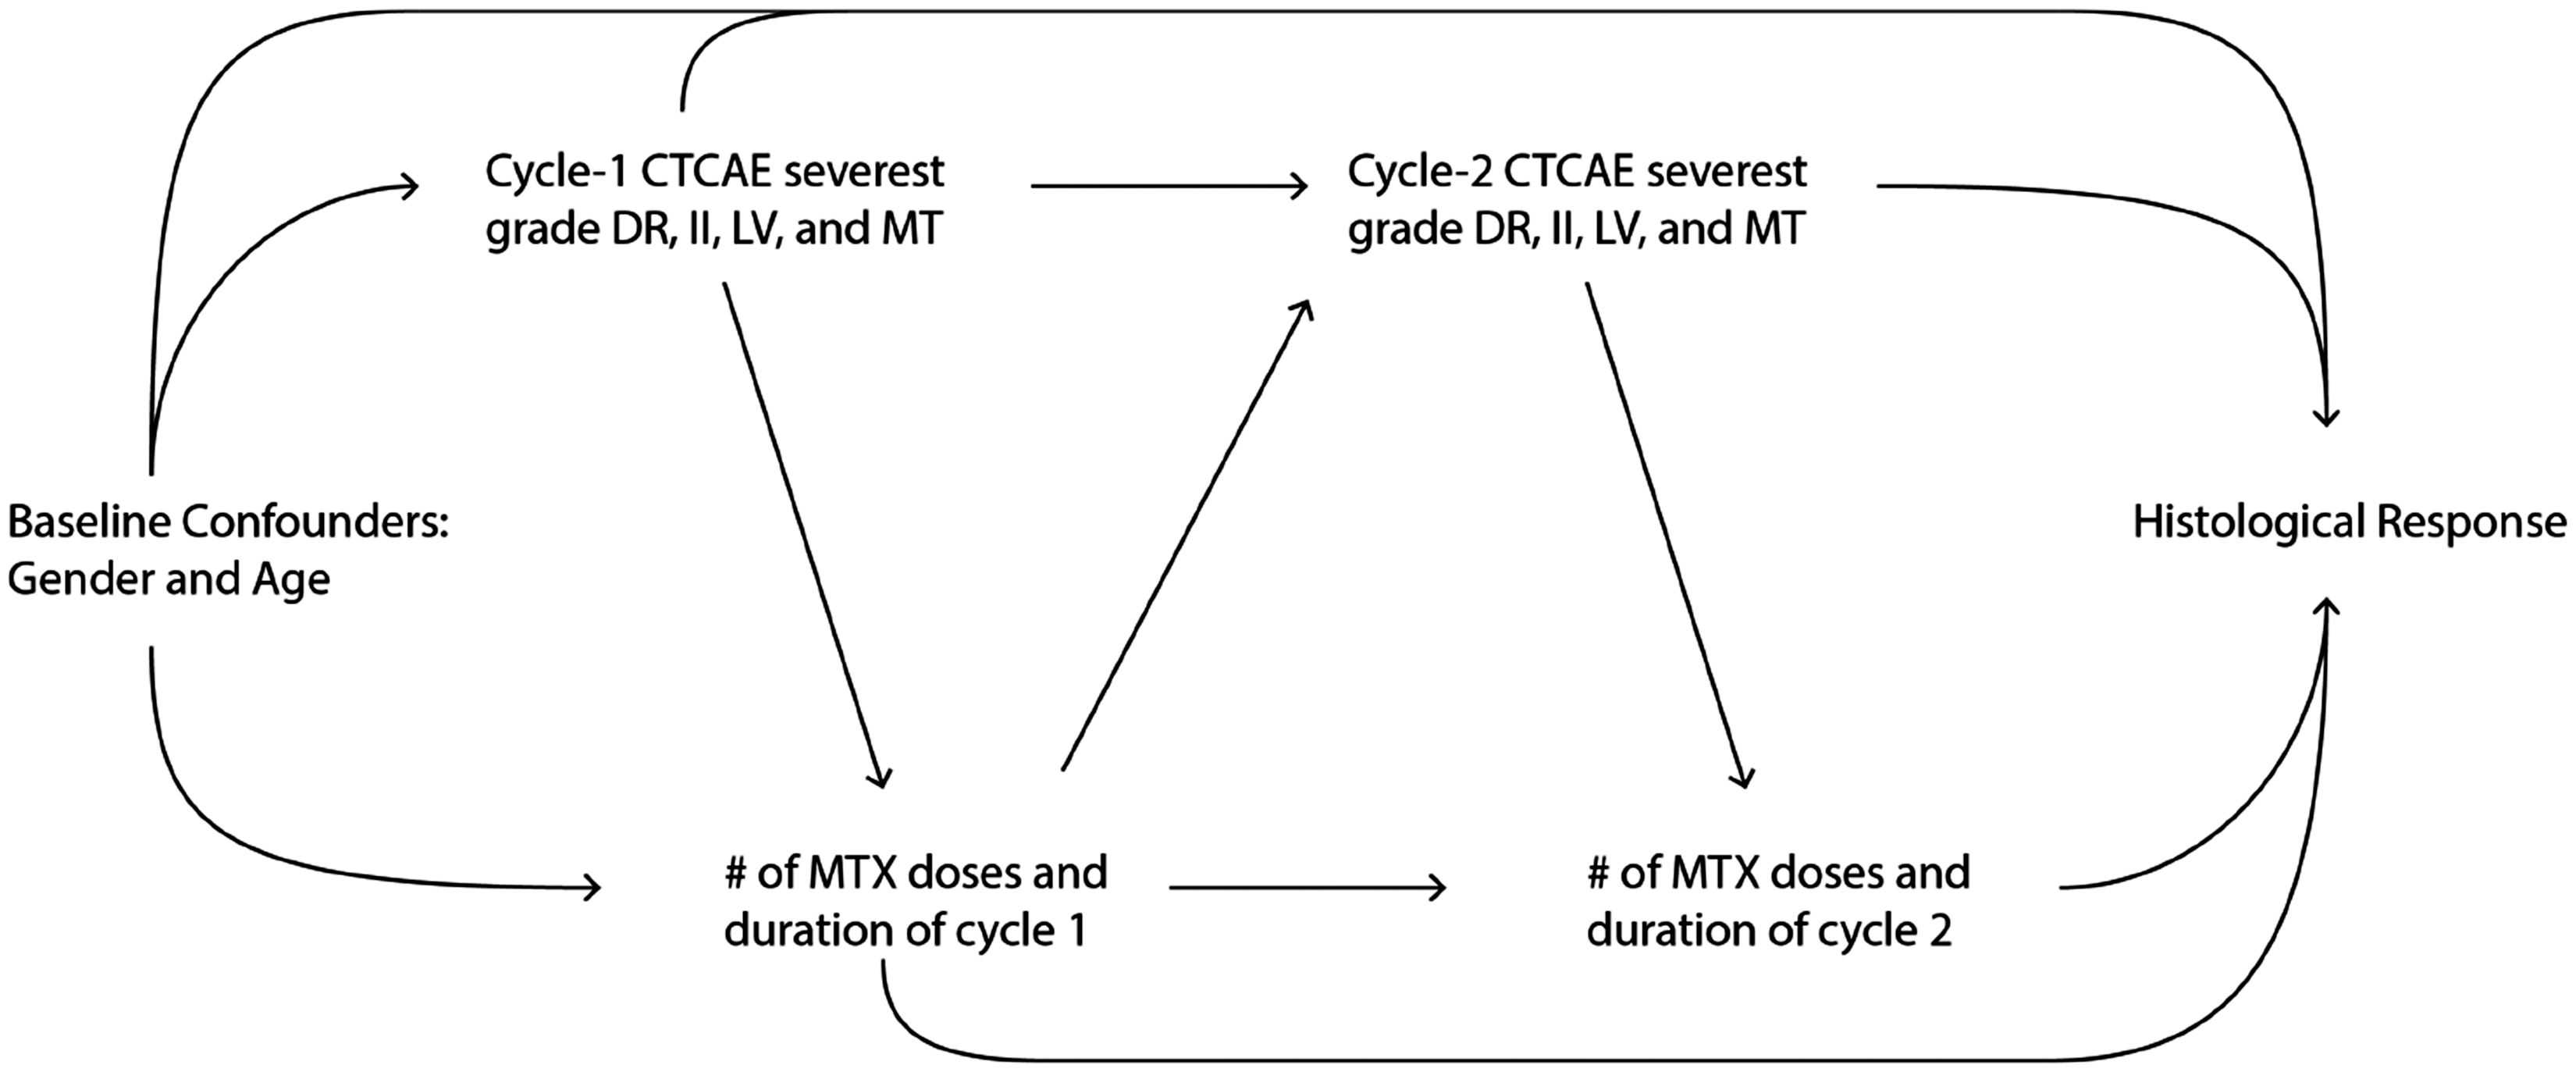
3.3 Marginal structural model for the histologic response
This section describes the MSM used to measure the causal effect on HRe of reducing by one course the MTX exposure. First, some notation is introduced: Y is a dichotomous variable describing the outcome (HRe), i.e.
Outcome

According to the definition of HRe given in Section 3.1, Y = 1 is equivalent to a ‘good’ HRe, while Y = 0 denotes a ‘poor’ HRe. The exposure administered on cycle k is denoted by the vector
Exposure
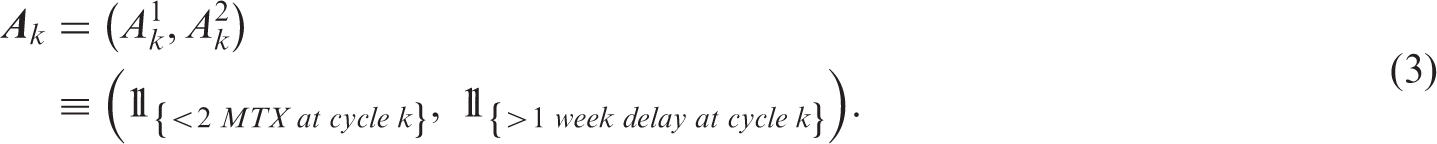
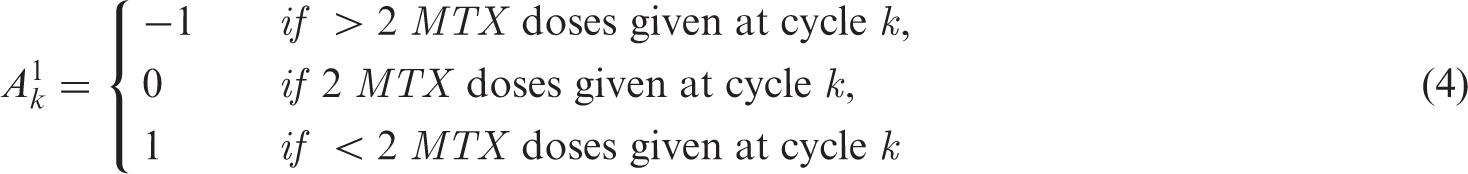
According to equation (3), the exposure on cycle k can take on the following four values:
‐ (0, 0), at least two courses of MTX were administered during cycle k,
g
and cycle k was delayed by no more than a week; ‐ (0, 1), at least two courses of MTX were administered during cycle k, and cycle k was delayed by at least 8 days; ‐ (1, 0), only one or zero courses of MTX were administered during cycle k, and the cycle was delayed by no more than a week; ‐ (1, 1), only one or zero courses of MTX were administered during cycle k, and cycle k was delayed by at least eight days.
According to the literature on MSMs, where the roman capital letter L is used to indicate a confounder, the following variables denote the baseline characteristics and the toxicity categories that influence the allocation of the kth treatment:
Confounders
Figure 7 describes through a stacked bar chart the CTCAE grades measured preoperatively, i.e. in cycle 1 and in cycle 2.
Stacked bar-chart of the preoperative CTCAE grades for each class of toxicity.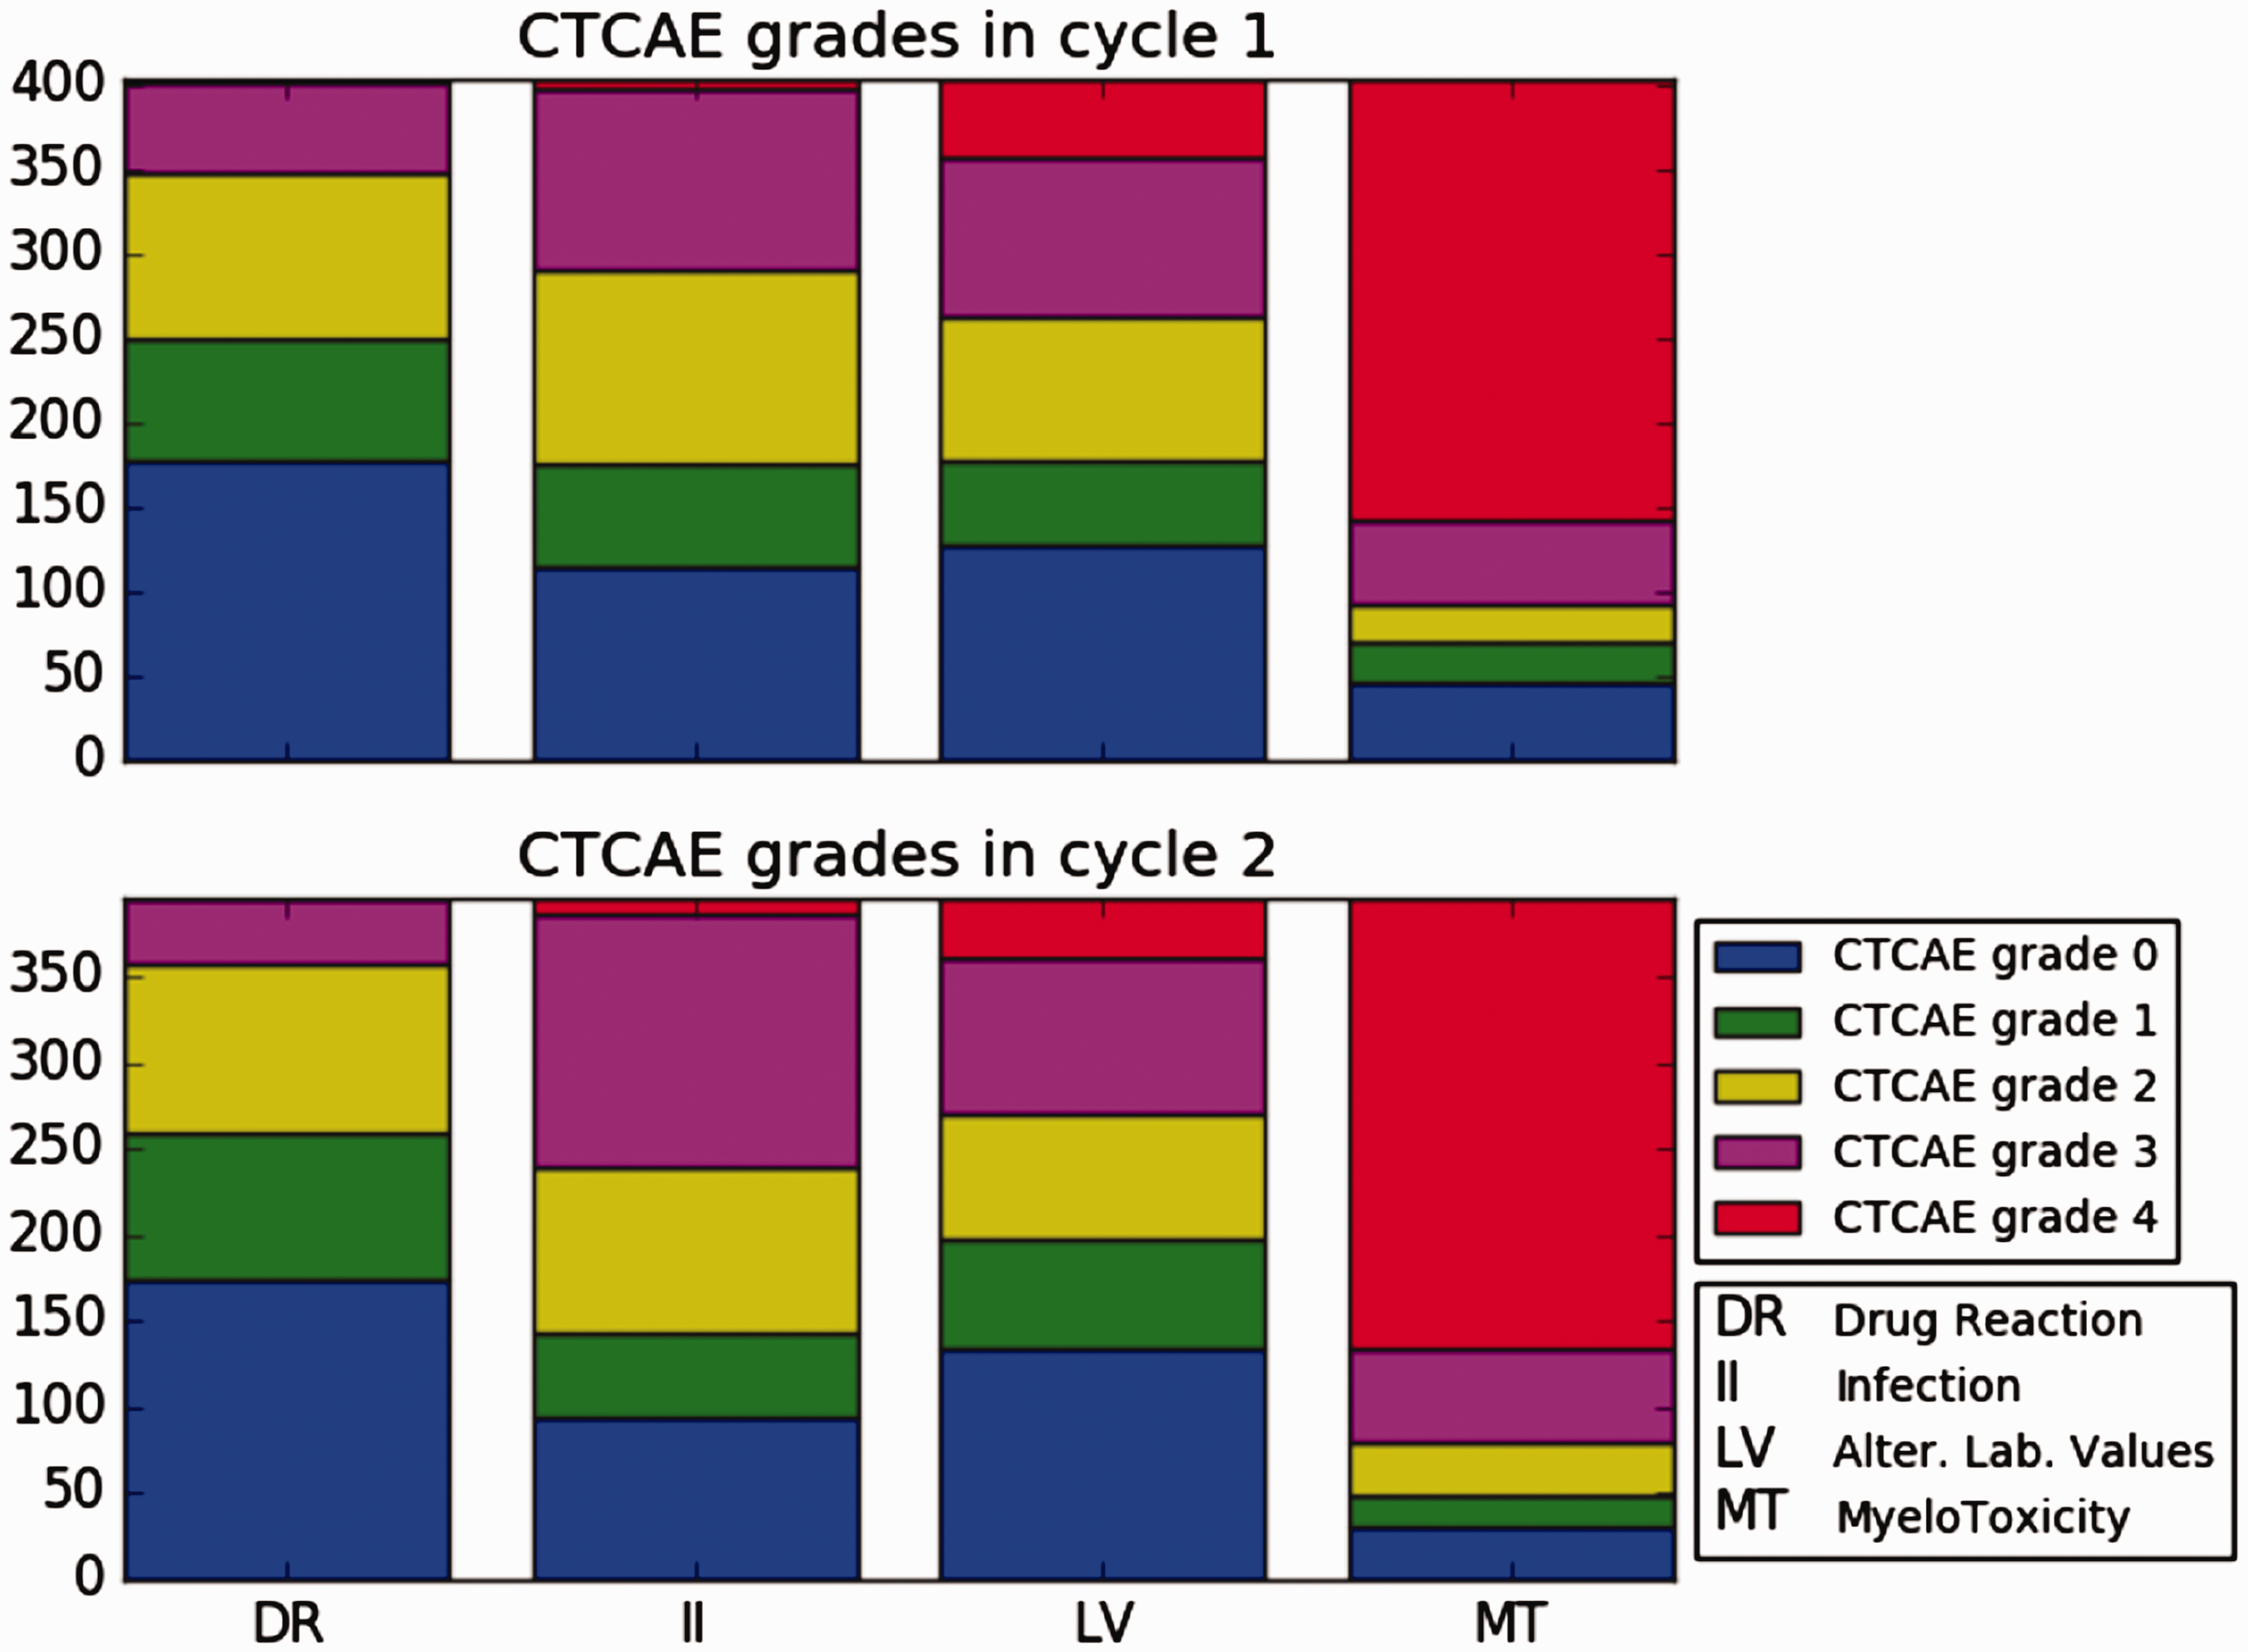
The subscript k marks the therapy periods (chemotherapy cycles). As such,
The past history of a quantity is denoted by placing an overbar on the corresponding symbol, e.g.
Counterfactual variables are used in causal modelling to describe a potential outcome, i.e. an outcome that would be observed had the subject followed, possibly contrary-to-fact, a given treatment.
Given the treatment trajectory Counterfactual Outcome
There are exactly 16 counterfactual outcomes, corresponding to the 16 trajectories
The model for the histological response is as follows: (MSM logit with bivariate binary-binary exposure)
Model 1

The dose component of the cumulative exposure is
Model 1 does not include any baseline covariates. The reason for such a modelling choice is two-fold: on one hand, there is no clinical interest in evaluating the causal effect of exposure modifications within specific population strata, see Robins
19
[§7.1]; on the other, subjects’ baseline covariates in the
An interesting model to consider next to Model 1 is the one where extra preoperative MTX is also measured: (MSM logit with bivariate multinomial-binary exposure)
Model 2

The interpretation of Model 2 is similar to that of Model 1.
Under the hypothesis of No Unmeasured Confounder,19,20 both Models 1 and 2 give unbiased estimates of the causal OR of variations in the number of preoperative MTX courses. Being closer to their daily practice, Model 2 is of greater interest for physicians and should better capture the effect of MTX therapy modifications. However, it would not be possible to apply the exposure (4) in a post-operative analysis, while exposure (3) from Model 1 would still work. This is a consequence of the
4 Results
The coefficients
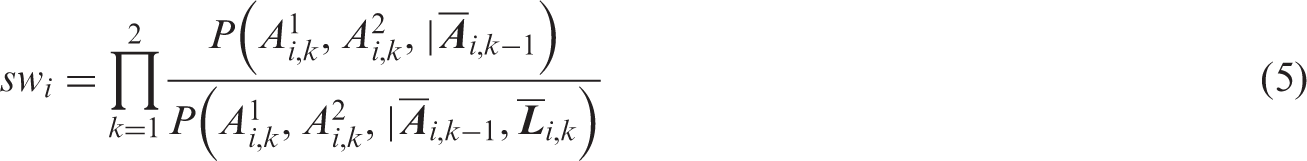
Applying the definition of conditional probability, swi is usually recast20–22 as follows
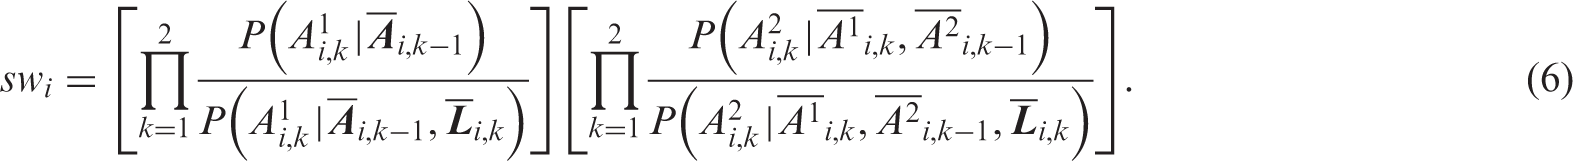
The swi’s can be estimated by use of equation (6) and existing software like the R package ipw.
39
In case of Model 1, the stabilised weights can be alternatively estimated from equation (5) using a Bivariate Logistic Odds-ratio Model (BLOM) – available through the R package VGAM.
40
Fitting a joint exposure-model is not exactly in the original spirit of MSMs, but the computation of the weights with both methods does not show any difference anyway. Figure 8 shows a plot of the weights (equation (6)) used to fit Model 2. The left boxplot corresponds to the product of the factors for k = 1 only, while the right boxplot shows the final weights.
Diagnostic boxplot of subject-specific weights computed via equation (6). The scale on the y-axis is logarithmic. The left boxplot corresponds to the terms with k = 1 only, while the right one corresponds to the full product.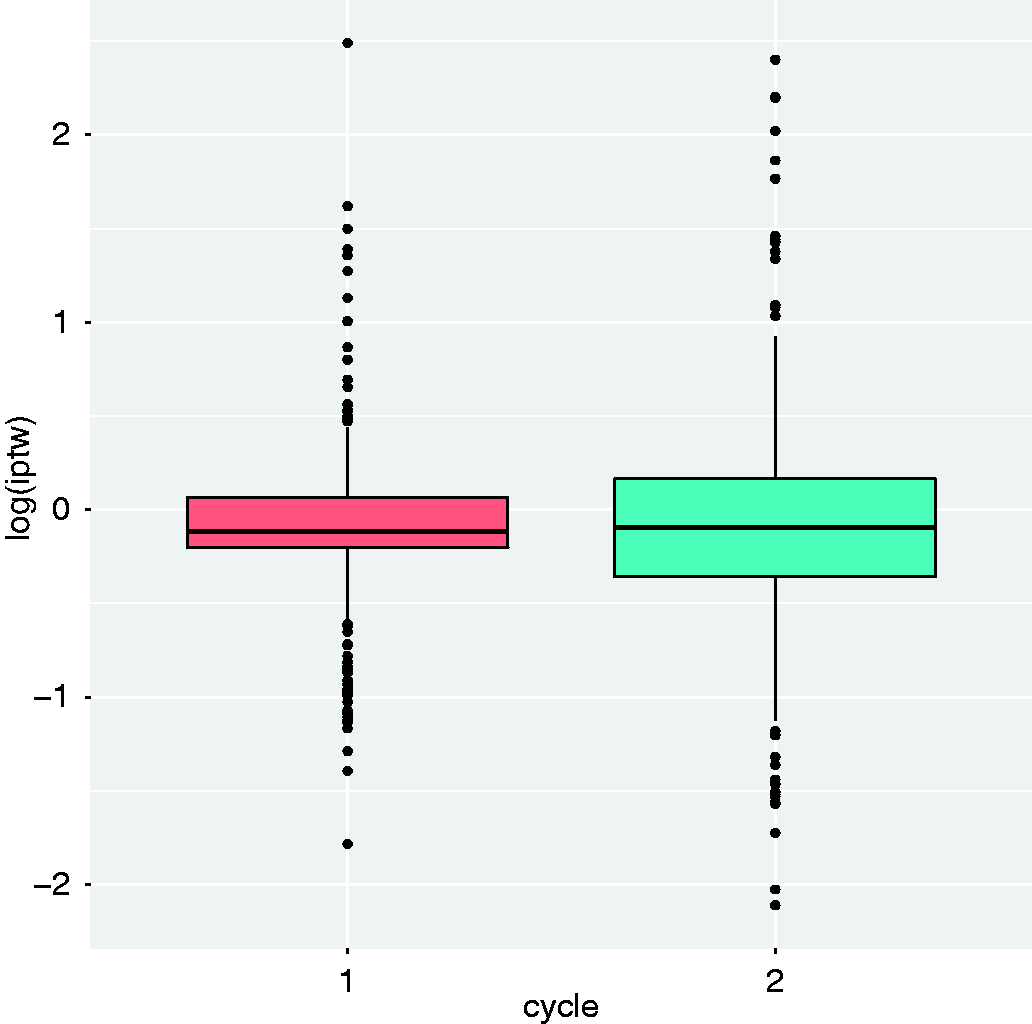
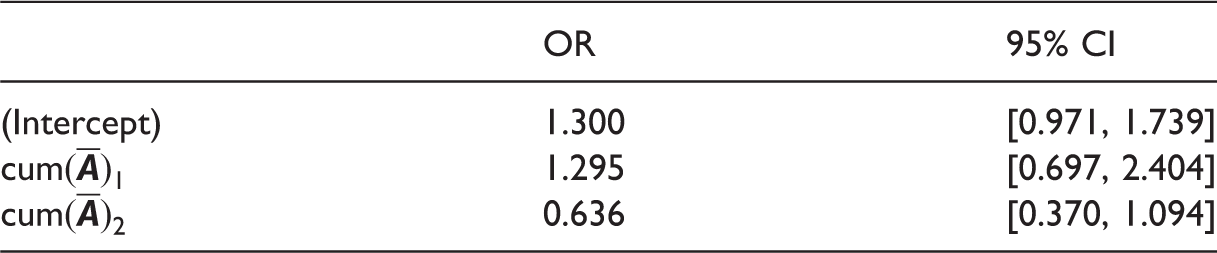
Model 1: Odds ratio (OR) and 95% confidence interval (CI).
Model 2: OR and 95% CI.
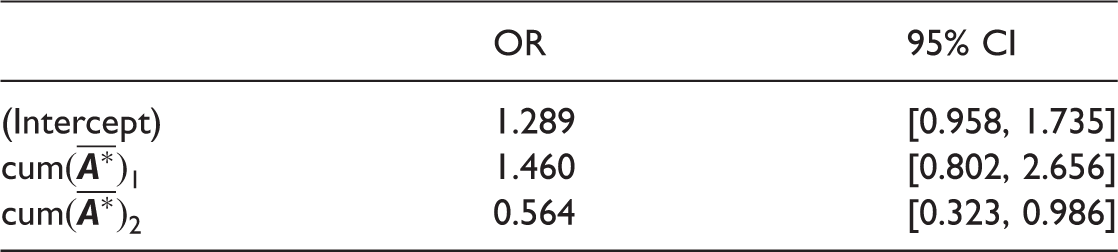
Based on the results reported, there is no evidence to support the hypothesis that a reduction in the number of courses of MTX might improve the HRe whilst accounting for patients that could have had an increased number of cycles for unrecorded reasons. However, in a clinical scenario where an operative choice need to be taken between
‐ giving two courses of MTX but delaying the cycle because of high toxicity, ‐ skipping one course of MTX and not delaying the end of the cycle, the findings of Models 1 and 2 suggest that the latter decision should probably be taken.
5 Conclusions
This paper discussed the application of MSMs, a well-established methodology in causal inference, to a novel class of longitudinal data. These are pre-randomisation data collected in a randomised clinical trial of chemotherapy. This research was motivated by a sharp yet delicate clinical question on the effect of reducing the exposure to one of the chemotherapy agents administered during the
The outcome addressed by the paper, HRe, is acknowledged as one of the strongest prognostic factors for survival in osteosarcoma. 1 Moreover, addressing the HRe allowed the use of data from 95 non-randomised subjects. These are patients that were not admitted to or refused to enroll on post-operative treatment.
Concerning the possibility of reducing the number of courses of MTX tout-court, ORs listed in Tables 1 and 2 are not statistically significant, so no compelling conclusion can be provided. It would be interesting to repeat the analysis with a separate, larger dataset, where hopefully a stronger fraction of the subjects have a reduced number of courses of MTX and/or delayed cycles. Indeed, Figure 5 shows a strong unbalance among the trajectories (
A major achievement of this work is having shown the potentially detrimental effect of chemotherapy delays, an aspect of treatment data seldom addressed in the literature. If confirmed by other studies, especially on survival outcomes, the negative effect of chemotherapy delays could call for a modification of current clinical practice.
As a final remark, a validation study using another independent dataset is highly recommended to increase the overall impact of this study. Verification of the negative effect of delaying a therapy cycle in osteosarcoma could be sought in three past European Organisation for Research and Treatment of Cancer (EORTC) studies, namely, trials 80831, 80861, and 80931 (EOI trials BO02, BO03, and BO06, respectively). Subjects randomised to the control arm of these studies are administered identical doses of DOX + CDDP. About the effect of MTX, more insight could be possibly achieved by analysing data from the case arm of EORTC randomised trial 80831 (EOI trial BO02), where the preoperative cumulative dosage of DOX and CDDP are substantially similar to
Footnotes
Data Sharing
The dataset used in this research can be requested via the MRC Clinical Trials Unit at UCL, Institute of Clinical Trials & Methodology, UCL, London, UK.
Declaration of conflicting interests
The author(s) declared no potential conflicts of interest with respect to the research, authorship, and/or publication of this article.
Funding
The author(s) disclosed receipt of the following financial support for the research, authorship, and/or publication of this article: This work was supported by the Dutch Foundation KiKa (Stichting Kinderen Kankervrij), grant 163, through the project Meta-analysis of individual patient data to investigate dose-intensity relation with survival outcome for osteosarcoma patients.