
Abstract
The reduction of the mean or median bias of the maximum likelihood estimator in regular parametric models can be achieved through the additive adjustment of the score equations. In this paper, we derive the adjusted score equations for median bias reduction in random-effects meta-analysis and meta-regression models and derive efficient estimation algorithms. The median bias-reducing adjusted score functions are found to be the derivatives of a penalised likelihood. The penalised likelihood is used to form a penalised likelihood ratio statistic which has known limiting distribution and can be used for carrying out hypothesis tests or for constructing confidence intervals for either the fixed-effect parameters or the variance component. Simulation studies and real data applications are used to assess the performance of estimation and inference based on the median bias-reducing penalised likelihood and compare it to recently proposed alternatives. The results provide evidence on the effectiveness of median bias reduction in improving estimation and likelihood-based inference.
1 Introduction
Meta-analysis is a core tool for synthesising the results from independent studies investigating a common effect of interest. One of the main challenges when combining results from multiple studies is the variability or heterogeneity in the design and the methods employed in each study. Accounting for and quantifying that heterogeneity is critical when drawing inferences about the common effect. In this direction, DerSimonian and Laird 1 introduced the random-effects meta-analysis model, which expresses the heterogeneity between studies in terms of a variance component that can be estimated through standard estimation techniques.
Nevertheless, there is ample evidence that frequentist inference based on random-effects meta-analysis can be problematic in the usual meta-analytic scenario where the number of studies is small or moderate. Specifically, the estimation of the heterogeneity parameter can be highly imprecise, which in turn results in misleading conclusions.2–4 Examples of recently proposed methods that attempt to improve inference are the resampling 5 and double resampling approaches, 6 and the mean bias-reducing penalised likelihood (BRPL) approach in Kosmidis et al. 3 Specifically, Kosmidis et al. 3 show that maximisation of the BRPL results in an estimator of the heterogeneity parameter that has notably smaller bias than maximum likelihood (ML) with small loss in efficiency, and illustrate that BRPL-based inference outperforms its competitors in terms of inferential performance.
Kenne Pagui et al. 7 show that under suitable conditions, third-order median unbiased estimators can be obtained by the solution of a suitably adjusted score equation. The components of such median bias-reduced estimators have, to third-order, the same probability of over- and under-estimating the true parameter. A key property of these estimators, not shared with the mean bias-reduced ones, is that any monotone component-wise transformation of the estimators results automatically in median bias-reduced estimators of the transformed parameters. 7 Such equivariance property can be useful in the context of random-effects meta-analysis where the Fisher information and, hence, the asymptotic variances of various likelihood-based estimators depend only on the heterogeneity parameter.
In this paper, we derive the median bias-reducing adjusted score functions for random-effects meta-analysis and meta-regression. The adjusted score functions are found to correspond to a median BRPL, whose logarithm differs from the logarithm of the mean BRPL in Kosmidis et al. 3 by a simple additive term that depends on the heterogeneity parameter. Since the adjustments to the score function for mean and median bias reduction are both of order O(1), the same arguments as in Kosmidis et al. 3 are used to obtain a median BRPL ratio statistic with known asymptotic null distribution that can be used for carrying out hypothesis tests and constructing confidence regions or intervals for either the fixed-effect or the heterogeneity parameter. Simulation studies and real data applications are used to assess the performance of estimation and inference based on the median BRPL, and compare it to recently proposed alternatives, including the mean BRPL. The results provide evidence on the effectiveness of median bias reduction in improving estimation and likelihood-based inference.
The rest of the paper is organised as follows. Section 2 considers the cocoa intake dataset 8 and a random-effects meta-analysis model as a motivational example that demonstrates how conclusions in frequentist inference may vary using different methods when the number of studies is small. Section 3 defines the random-effects meta-analysis and meta-regression model and establishes notation. Section 4 gives a formal statement of the proposed median bias-reducing adjusted score function and penalised likelihood for these models, gives the algorithm used for computing the median BRPL estimates, and briefly discusses the median BRPL ratio statistic used for inference. Section 5 revisits the example in Section 2 and gives some simulations comparing the median BRPL method to alternative approaches. Section 6 gives more extensive simulations under the random-effects meta-analysis model that evaluate the performance of median BRPL and compare it with that of ML and mean BRPL methods. An application to meat consumption data 9 and a random-effects meta-regression model is given in Section 7. Section 8 concludes with a brief discussion, and Appendix 1 contains some technical details on the derivation of the median bias-reducing adjusted score functions.
2 Cocoa intake and blood pressure reduction data
Consider the setting in Bellio and Guolo
10
who carry out a meta-analysis of five randomised controlled trials from Taubert et al.
8
on the efficacy of two weeks of cocoa consumption on lowering diastolic blood pressure. Figure 1 is a forest plot with the estimated mean difference in diastolic blood pressure before and after cocoa intake from each study, and the associated 95% Wald-type confidence intervals. Four out of the five studies reported a reduction of diastolic blood pressure from cocoa intake.
Forest plot of cocoa data.8,10 The outcomes from the five studies are reported in terms of the diastolic blood pressure (DBP) difference after two weeks of cocoa consumption. A negative change in DBP indicates favorable hypotensive cocoa actions. Squares represent the mean effect estimate for each study; the size of the square reflects the weight that the corresponding study exerts in the meta-analysis calculated as the within-study’s inverse variance. Horizontal line segments represent 95% Wald-type confidence intervals (CI) of the effect estimate of individual studies. In the bottom panel of the plot, horizontal line segments represent the corresponding 95% confidence interval as computed based on the Wald statistic using the ML estimates (ML Wald), the DerSimonian and Laird approach,
1
double resampling,
6
the LR statistic, the Knapp and Hartung
11
method, the mean BRPL ratio statistic,
3
the Bartlett-corrected LR statistic (Bartlett LR),
12
the Skovgaard’s statistic, and the median BRPL ratio statistic. The confidence intervals n are ordered according to their length. The estimate of β has not been reported, as is commonly done in forest plots, because some of the methods considered (e.g. Skovgaard, Bartlett-corrected LR, and double resampling) are designed to produce directly p-values and/or confidence intervals and do not directly correspond to an estimation method.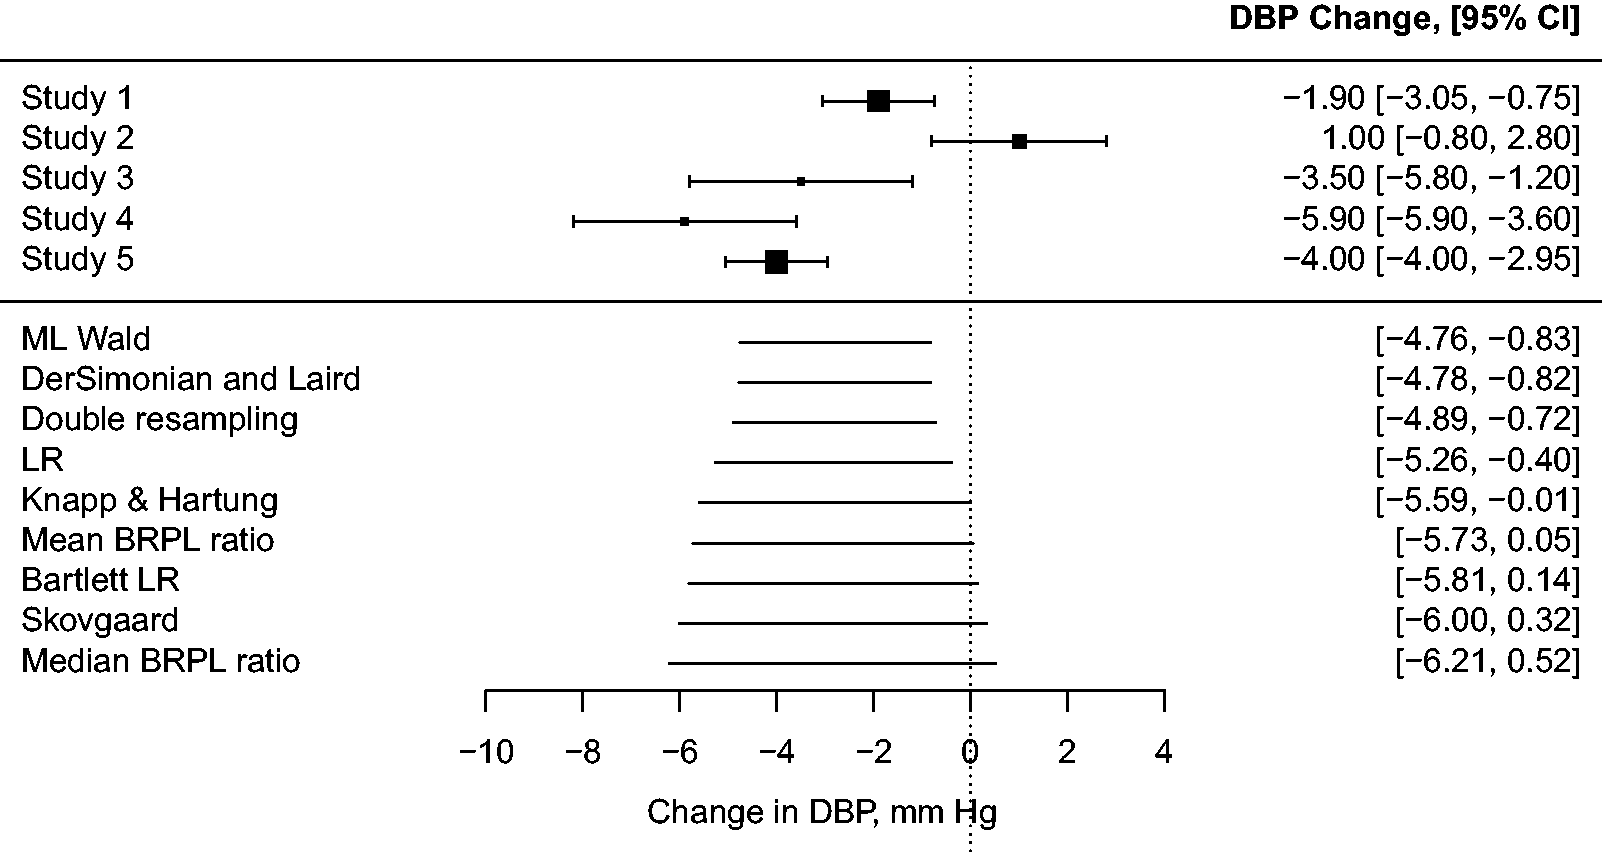
The random-effects meta-analysis model is used to synthesise the evidence from the five studies. In particular, let Yi be the random variable representing the mean difference in the diastolic blood pressure after two weeks of cocoa intake in the ith study. We assume that
The forest plot in Figure 1 has been enriched with several nominally 95% confidence intervals for β using various alternative methods. As is apparent, the conclusions when testing the hypothesis β = 0 can vary depending on the method used. More specifically, the Wald test using the ML estimates, the DerSimonian and Laird method, 1 double resampling, 6 and the likelihood ratio (LR) test give evidence that there is a relationship between cocoa consumption and diastolic blood pressure, with p-values 0.005, 0.006, 0.016, 0.030, respectively. On the other hand, Knapp and Hartung’s method, 11 the mean BRPL ratio, 3 the Bartlett-corrected LR, 12 and Skovgaard’s test suggest that the evidence that cocoa consumption affects diastolic blood pressure is weaker, with p-values of 0.050, 0.053, 0.058, and 0.067, respectively.
3 Random-effects meta-regression model
Let yi and
The within-study variances

The log-likelihood function for
4 Median bias reduction
4.1 The method
A popular method for reducing the mean bias of ML estimates in regular statistical models is through the adjustment of the score equation.13,14 Kenne Pagui et al. 7 propose an extension of the adjusted score equation approach which can be used to obtain median bias-reduced estimators. Specifically, under the model, the new estimator has a distribution with median closer to the “true” parameter value than the ML estimator. Kenne Pagui et al. 7 consider the median as a centering index for the score, and the adjusted score function for median bias reduction then results by subtracting from the score its approximate median, obtained using a Cornish-Fisher asymptotic expansion.
Let

In the context of meta-regression values of t and u in
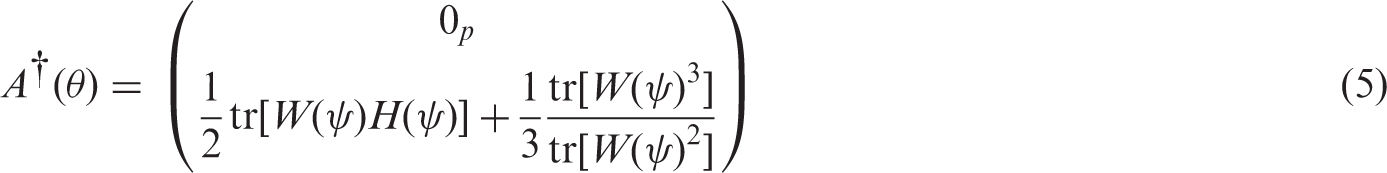
After some algebra (see Appendix 1 for details), the median bias-reducing adjustment for the random-effects meta-analysis and meta-regression models has the form
4.2 Computation of median bias-reduced estimator
A direct approach for computing the estimator Calculate Solve
In the above steps,
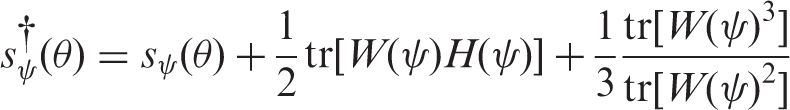
4.3 Median bias-reducing penalised likelihood
Although it is not generally true that

An advantage of the median BRPL estimators over mean BRPL ones is that the former are equivariant under monotone component-wise parameter transformations.
7
In the context of random-effects meta-analysis and meta-regression, this equivariance implies that not only we get a median bias-reduced estimator of ψ, but we also get median bias-reduced estimates of the standard errors for β by calculating the square roots of the diagonal elements of
4.4 Penalised likelihood-based inference
For inference about either the components of the fixed-effect parameters β or the between-study heterogeneity ψ, we propose the use of the median BRPL ratio. If

5 Cocoa intake and blood pressure reduction data (revisited)
The ML estimate, the maximum mean BRPL estimate and the maximum median BRPL estimate of the heterogeneity parameter in the meta-analysis model in Section 2 are
Figure 2 shows the value of LR, mean BRPL and median BRPL ratio statistic in equation (7) for a range of values of τ, when τ is either β or ψ. Here and in the following simulation studies, we compare median BRPL ratio statistic with only LR and mean BRPL ratio statistics because the mean BRPL ratio statistic is a strong competitor against other alternatives in terms of inferential performance.
3
The horizontal line in Figure 2 is the 95% quantile of the limiting Plot of LR (dotted), mean BRPL (dashed) and median BRPL (solid) ratio statistic in equation (7) when τ is β (left) and ψ (right). The horizontal line is the 95% quantile of the limiting 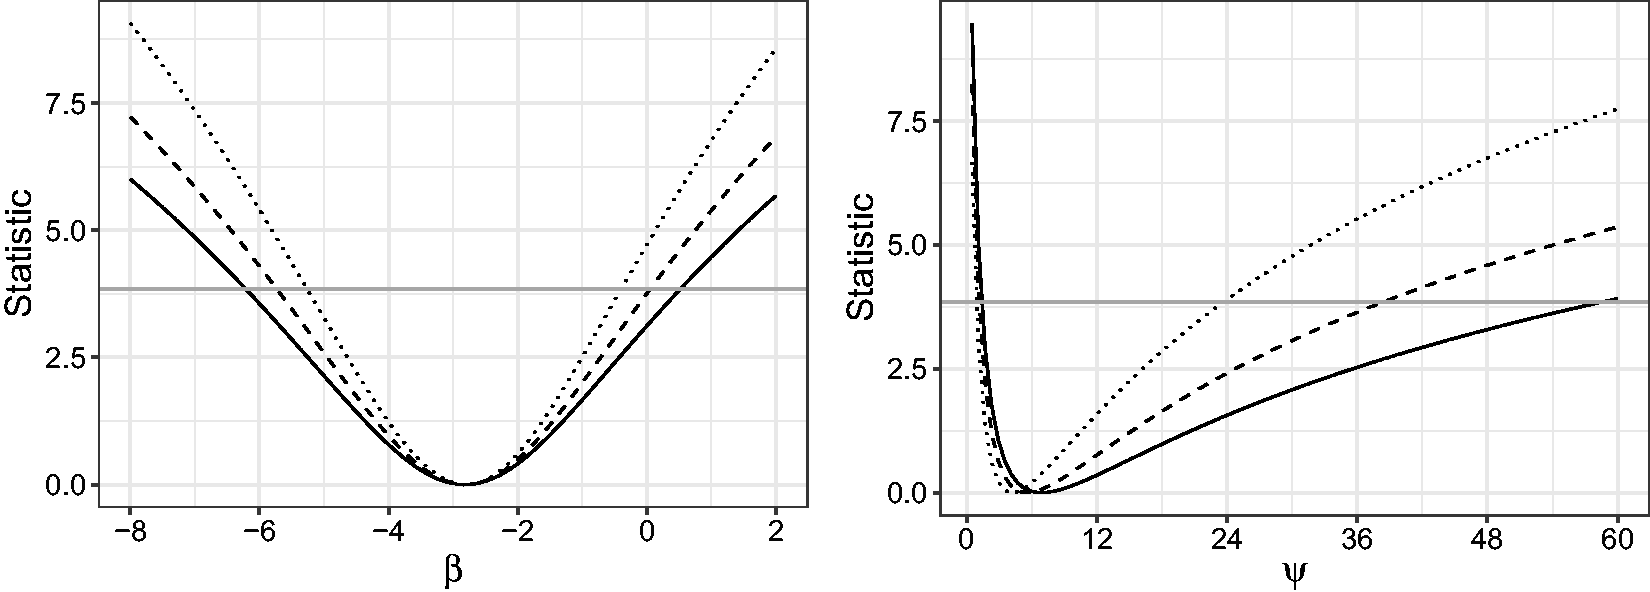
In order to further investigate the performance of the three approaches to estimation and inference, we performed a simulation study where we simulated 10,000 independent samples from the random-effects meta-analysis model with parameter values set to the ML estimates reported earlier, i.e. Boxplots for the ML, the maximum mean BRPL, and the maximum median BRPL estimates of β and ψ as calculated from 10,000 simulated samples under the ML fit using the cocoa data.8,10 The square point is the empirical mean of the estimates. The dashed grey horizontal line is at the parameter value used to generate the data.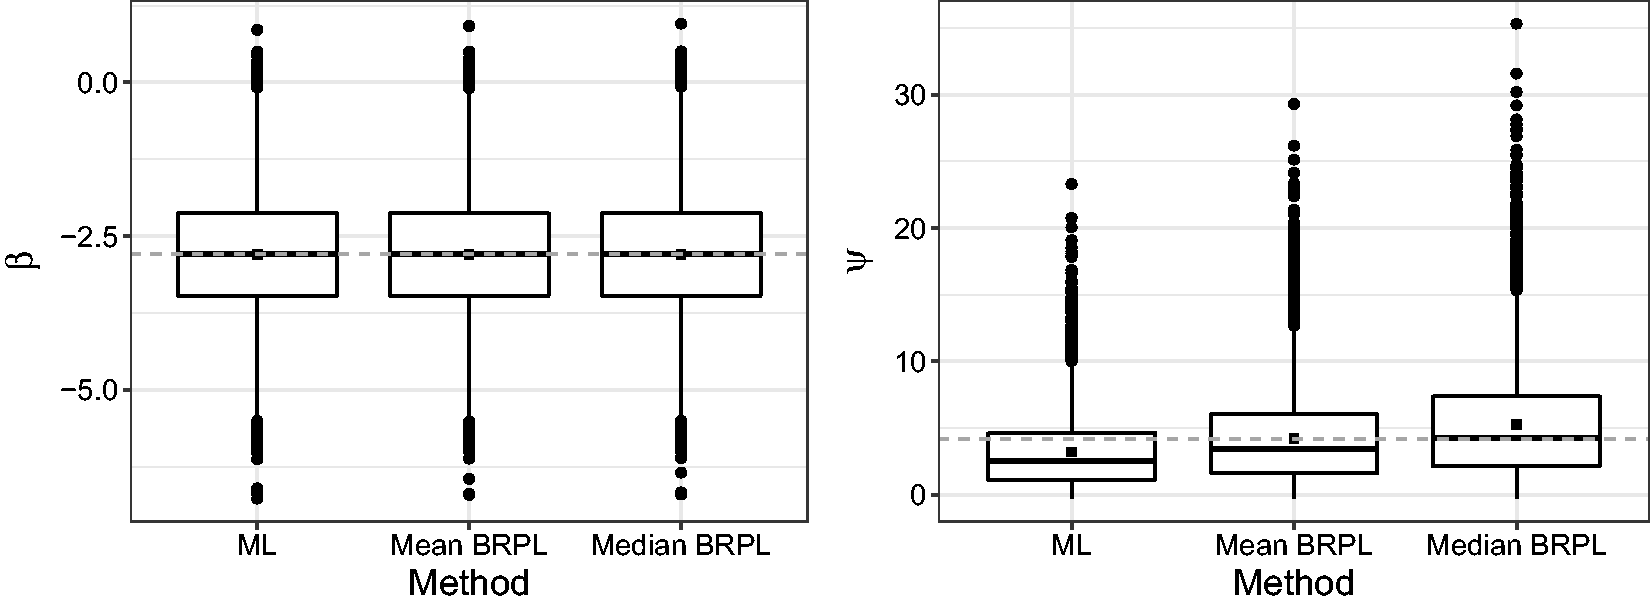
6 Simulation study
More extensive simulations under the random-effects meta-analysis model (1) are performed here using the design in Brockwell and Gordon.
16
Specifically, the data
Zeng and Lin 6 compared the performance of their proposed double resampling method with the DerSimonian and Laird 1 method, the profile likelihood method in Hardy and Thompson, 17 and the resampling method in Jackson and Bowden 5 and showed that the double resampling method improves the accuracy of statistical inference. Based on these results, Kosmidis et al. 3 compared the performance of their mean BRPL approach with the double resampling method and illustrated that the former results in confidence intervals with coverage probabilities closer to the nominal level than the alternative methods.
We take advantage of the results reported in Zeng and Lin
6
and Kosmidis et al.
3
and evaluate the performance of estimation and inference based only on the median BRPL with that based on the likelihood and the mean BRPL. The estimators of the fixed and random-effect parameters obtained from the three methods are calculated using variants of the two-step algorithm described in Section 4.2. In the second step of the algorithm, the candidate values for the ML, and maximum mean and median BRPL estimators of the between-study variance ψ are calculated by searching for the root of the partial derivatives of
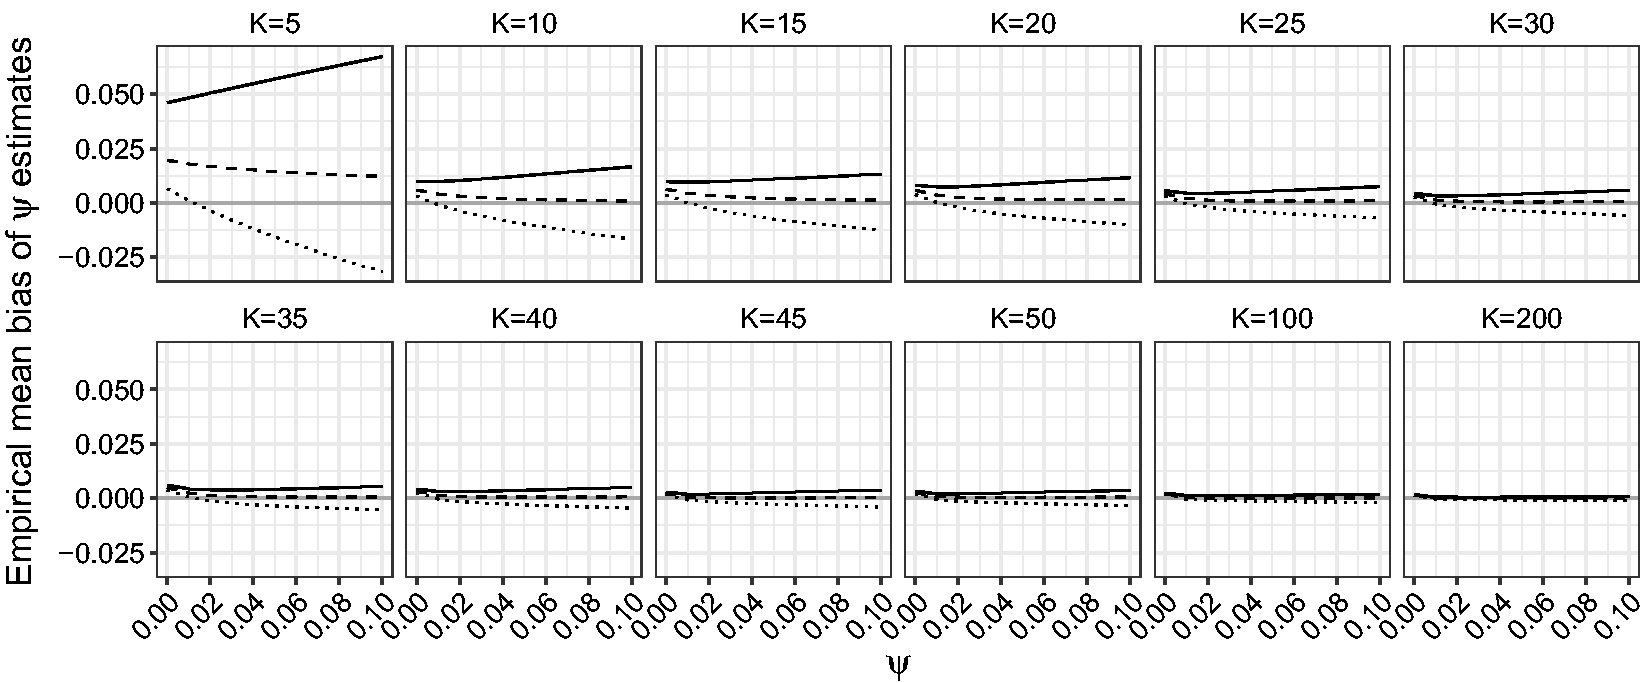
First, we compare the performance of the ML, maximum mean BRPL and maximum median BRPL estimators in terms of percentage of underestimation. Figure 4 shows that the median bias-reducing adjustment is the most effective in reducing median bias even for small values of K. As expected, the ML and maximum mean BRPL estimators also approach the limit of 50% underestimation as K grows, with the latter being closer to 50% than the former. Figure 5 shows that maximum median BRPL is also effective in reducing the mean bias of the ML estimator of ψ but only for moderate to large values of K, while maximum mean BRPL results in estimators with the smallest bias.
Empirical percentage of underestimation for ψ for random-effects meta-analysis. The percentage of underestimation is calculated for Empirical mean bias of ψ estimates for random-effects meta-analysis. The mean bias is calculated for 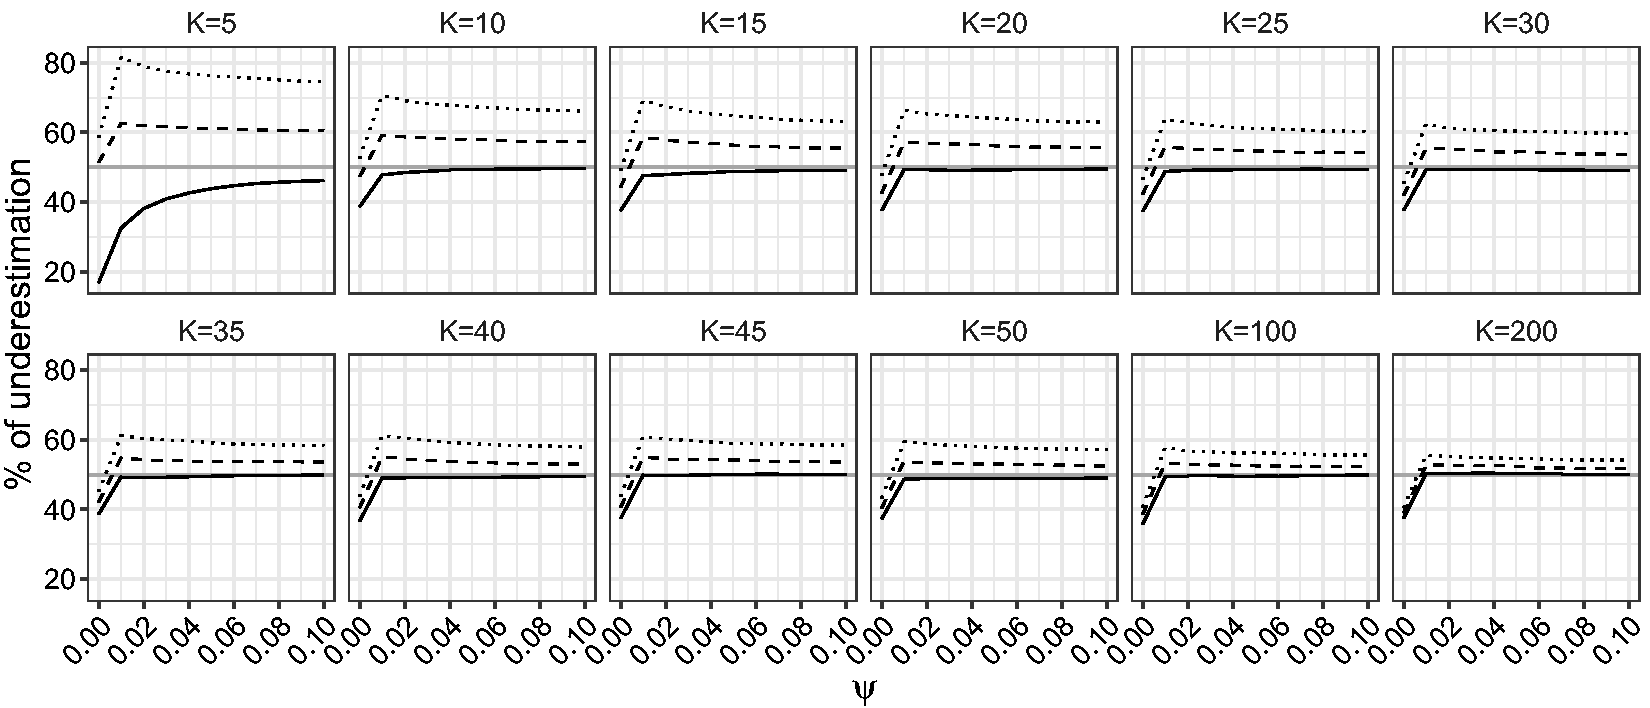
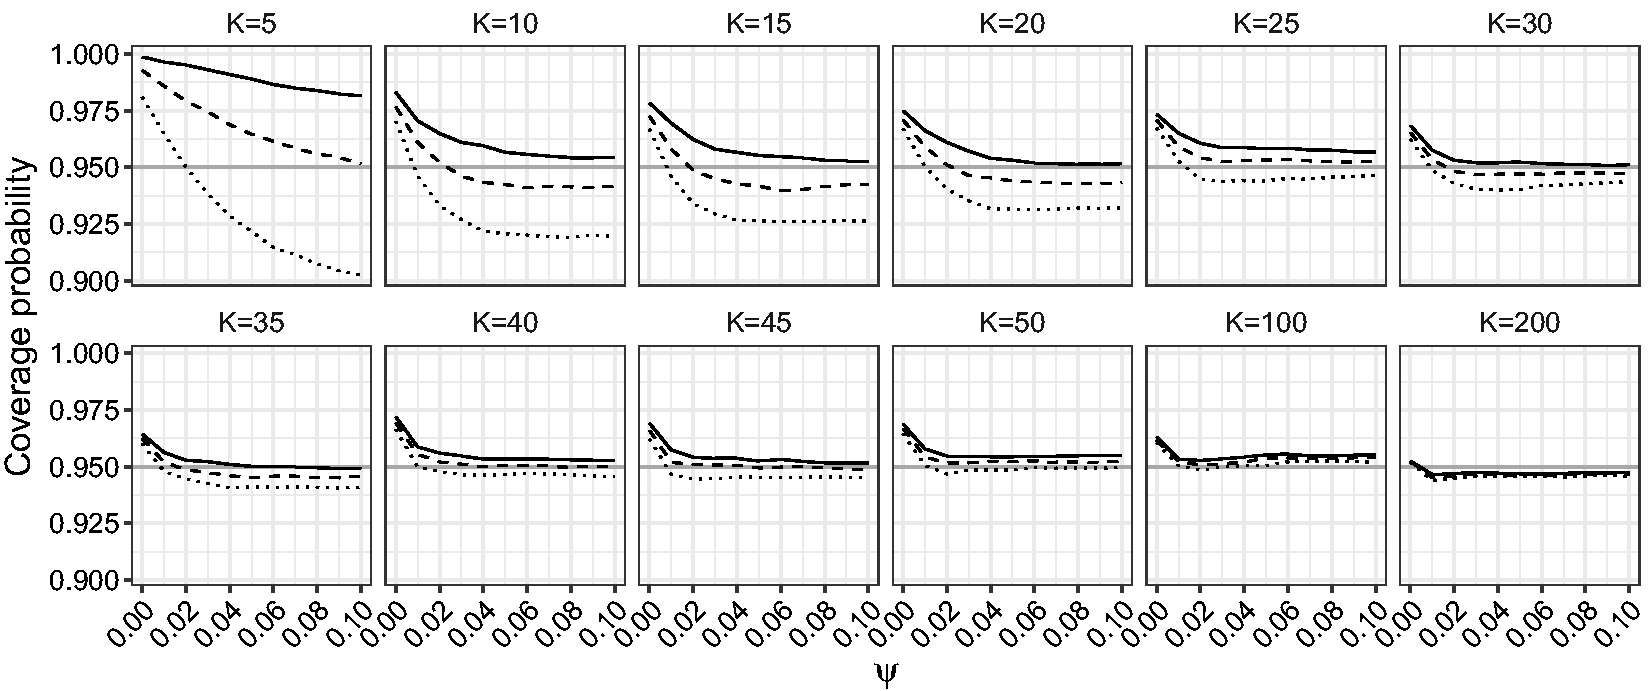
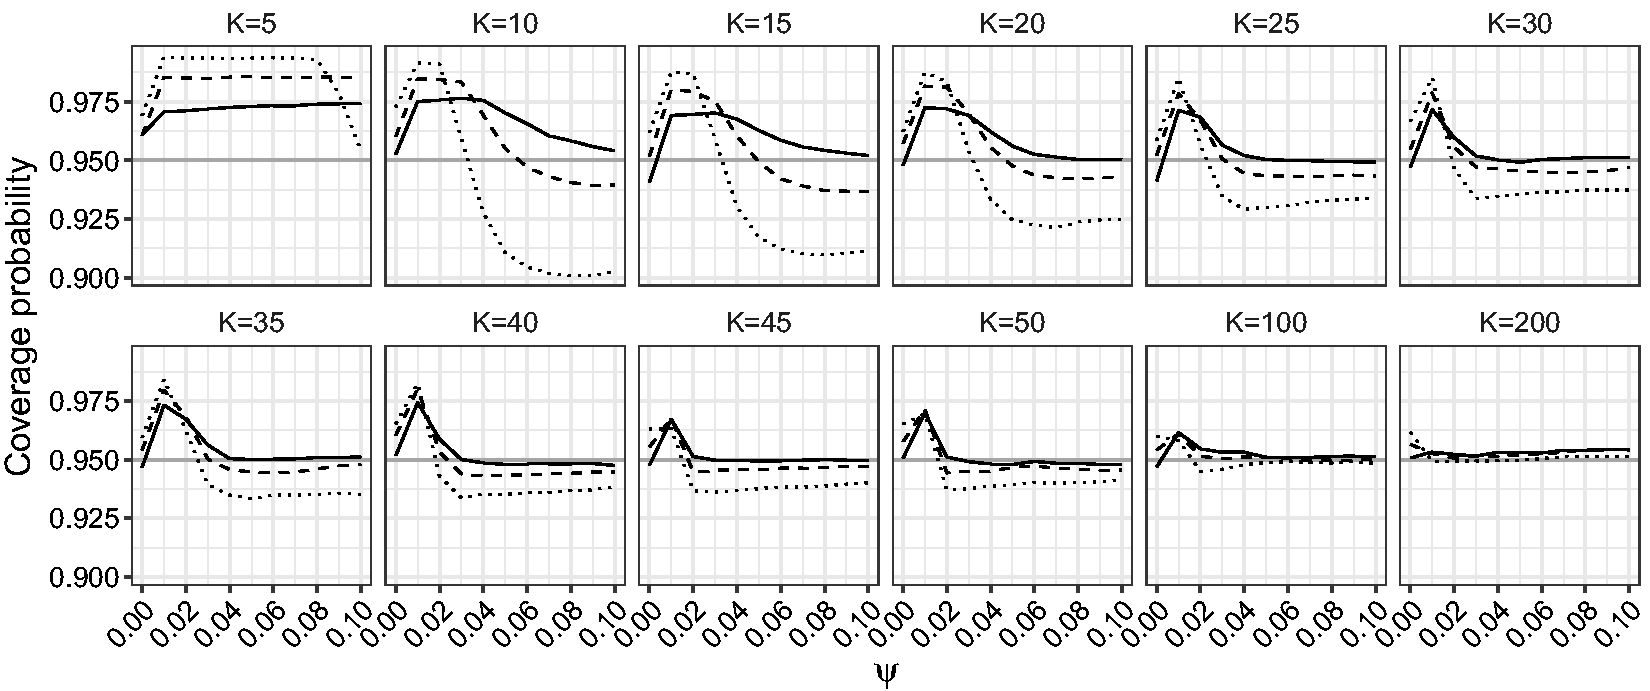
Figures 6 and 7 show the estimated coverage probability for the one-sided and two-sided confidence intervals for β based on the LR, mean BRPL ratio and median BRPL ratio statistics at the 95% nominal level. Figure 8 shows the estimated coverage probability for the two-sided confidence intervals for ψ based on the LR, mean BRPL ratio and median BRPL ratio statistics at the 95% nominal level. For small values of ψ or small and moderate number of studies K, the empirical coverage of the intervals is larger than the nominal 95% level. In general, the confidence intervals based on mean and median BRPL ratio have empirical coverage that is closer to the nominal level with the latter having generally better coverage. The differences between the three methods diminish as the number of studies K increases.
Empirical coverage probabilities of one-sided (right) confidence intervals for β for random-effects meta-analysis. The empirical coverage is calculated for increasing values of ψ in the interval Empirical coverage probabilities of two-sided confidence intervals for β for random-effects meta-analysis. The empirical coverage is calculated for increasing values of ψ in the interval Empirical coverage probabilities of two-sided confidence intervals for ψ for random-effects meta-analysis. The empirical coverage is calculated with 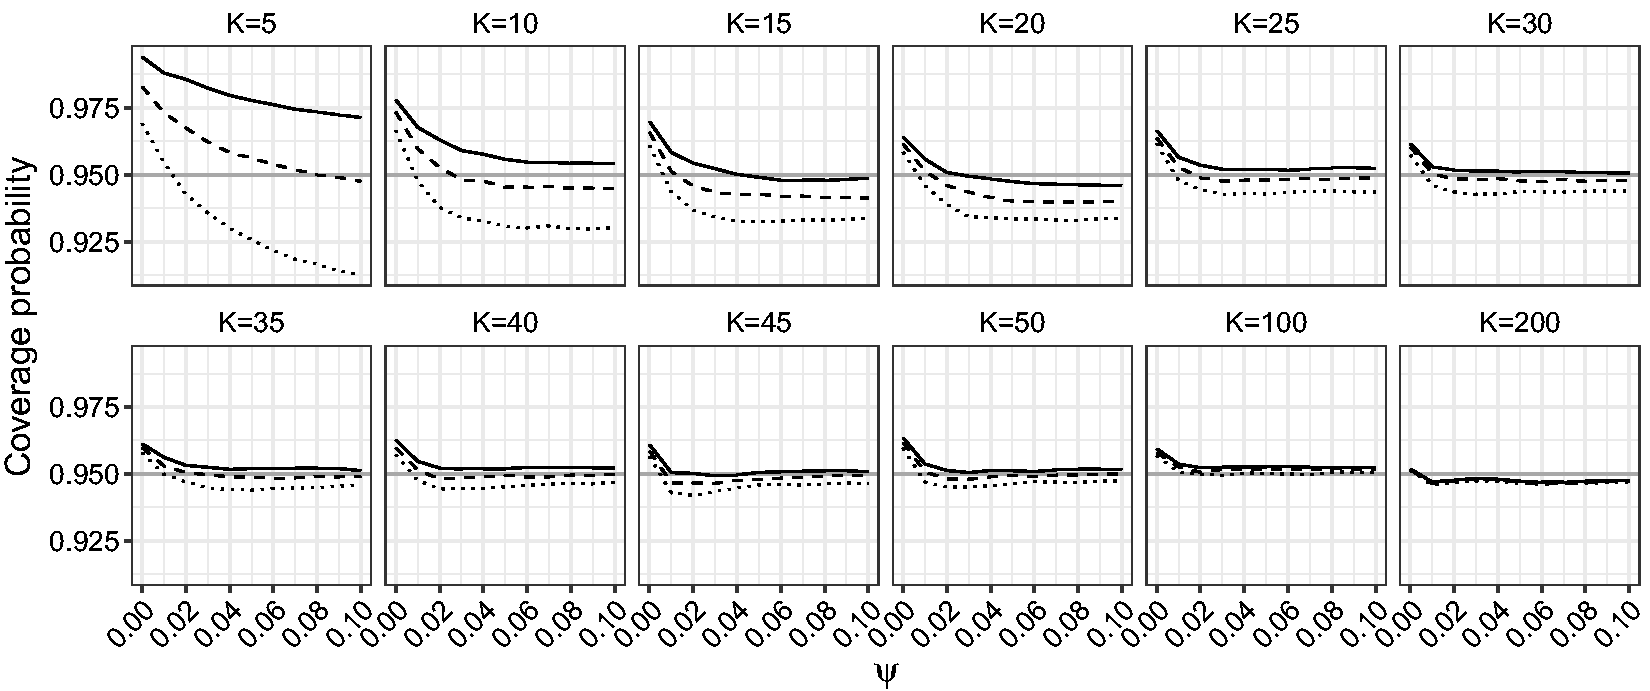
Figures 9 and 10 give the power of the LR, the mean BRPL ratio, and the median BRPL ratio tests for testing the null hypothesis Empirical power of the likelihood-based tests of asymptotic level 0.05 for random-effects meta-analysis for testing Empirical power of the likelihood-based tests of exact level 0.05 for random-effects meta-analysis for testing 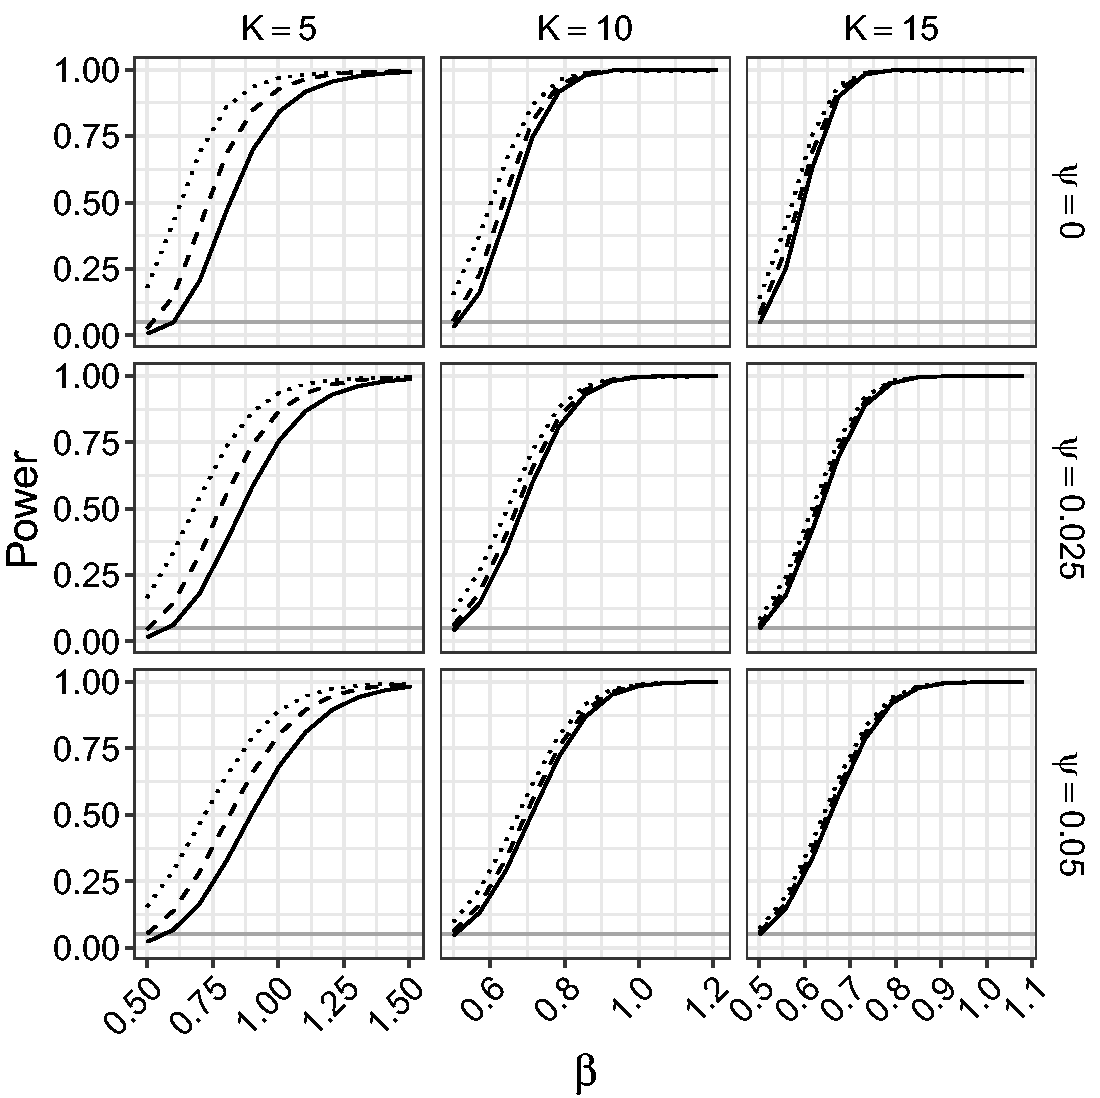
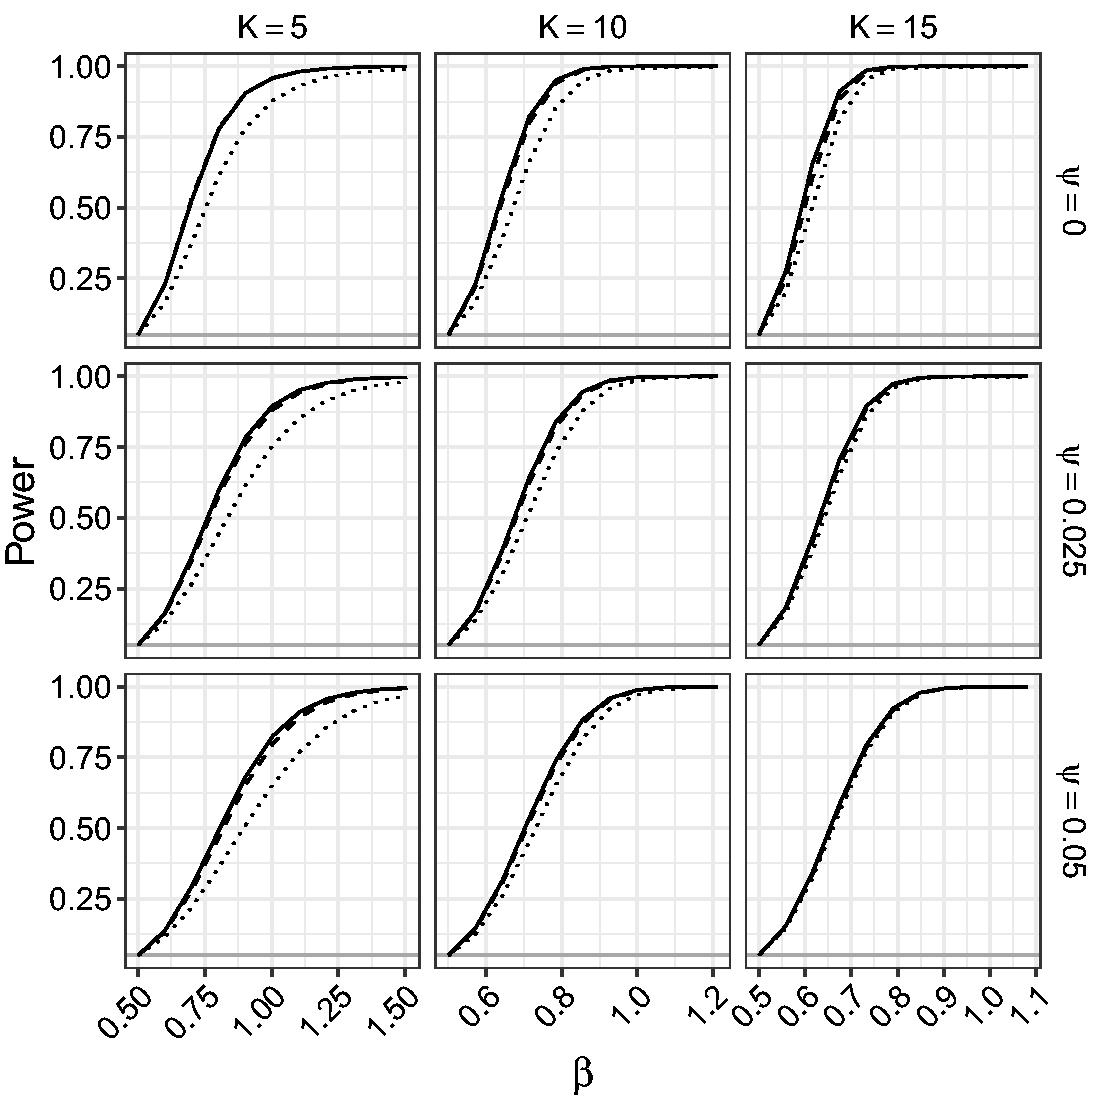
Figure 9 shows that the three tests have monotone power and for small values of K the LR test yields the largest power. This is because the LR test is oversized, while the mean and median BRPL ratio tests are slightly more conservative and this conservativeness comes at the cost of lower power. As the number of studies K increases, the three tests approach the nominal size and provide similar power. The use of the exact critical values in Figure 10 allows us to compare the performance of the tests without letting the oversizing or the conservativeness of a test skew the power results. Figure 10 shows that the power of the median BRPL ratio test is almost identical to that of the mean BRPL ratio test, and both tests have larger power than the LR test. Again, inference based on either of the two penalised likelihoods becomes indistinguishable from classical likelihood inference as the number of studies increases.
Across all ψ and K values considered, the average number of iterations taken per fit for the two-step iterative process to converge is 6.20, 5.75, and 5.86 iterations for ML, maximum mean BRPL, and maximum median BRPL, respectively. The average computational run-times for ML, maximum mean BRPL, and maximum median BRPL are 0.005 s, 0.021 s, and 0.017 s, respectively. Figures 1 and 2 in the Supplementary material show the average number of iterations and the average computational run-time taken per fit for the two-step iterative process to converge for each value of K and ψ used in the simulation study. The results show that in all cases estimation is achieved rapidly and after a small number of iterations for all three methods, with only negligible overhead with the two bias reducing methods.
7 Meat consumption data
Larsson and Orsini
9
investigate the association between meat consumption and relative risk of all-cause mortality. The data consists of 16 prospective studies, eight of which are about unprocessed red meat consumption and eight about processed meat consumption. Figure 11 displays the information provided by each study in the meta-analysis. The results from the studies point towards the conclusion that high consumption of red meat, in particular processed red meat, is associated with higher all-cause mortality.
The meat consumption data.
9
Outcomes from 16 studies are reported in terms of the logarithm of the relative risk (Log RR) of all-cause mortality for the highest versus lowest category of unprocessed red meat, and processed meat consumption. Squares represent the mean effect estimate for each study; the size of the square reflects the weight that the corresponding study exerts in the meta-analysis. Horizontal lines represent 95% Wald-type confidence intervals (CI) of the effect estimate of individual studies.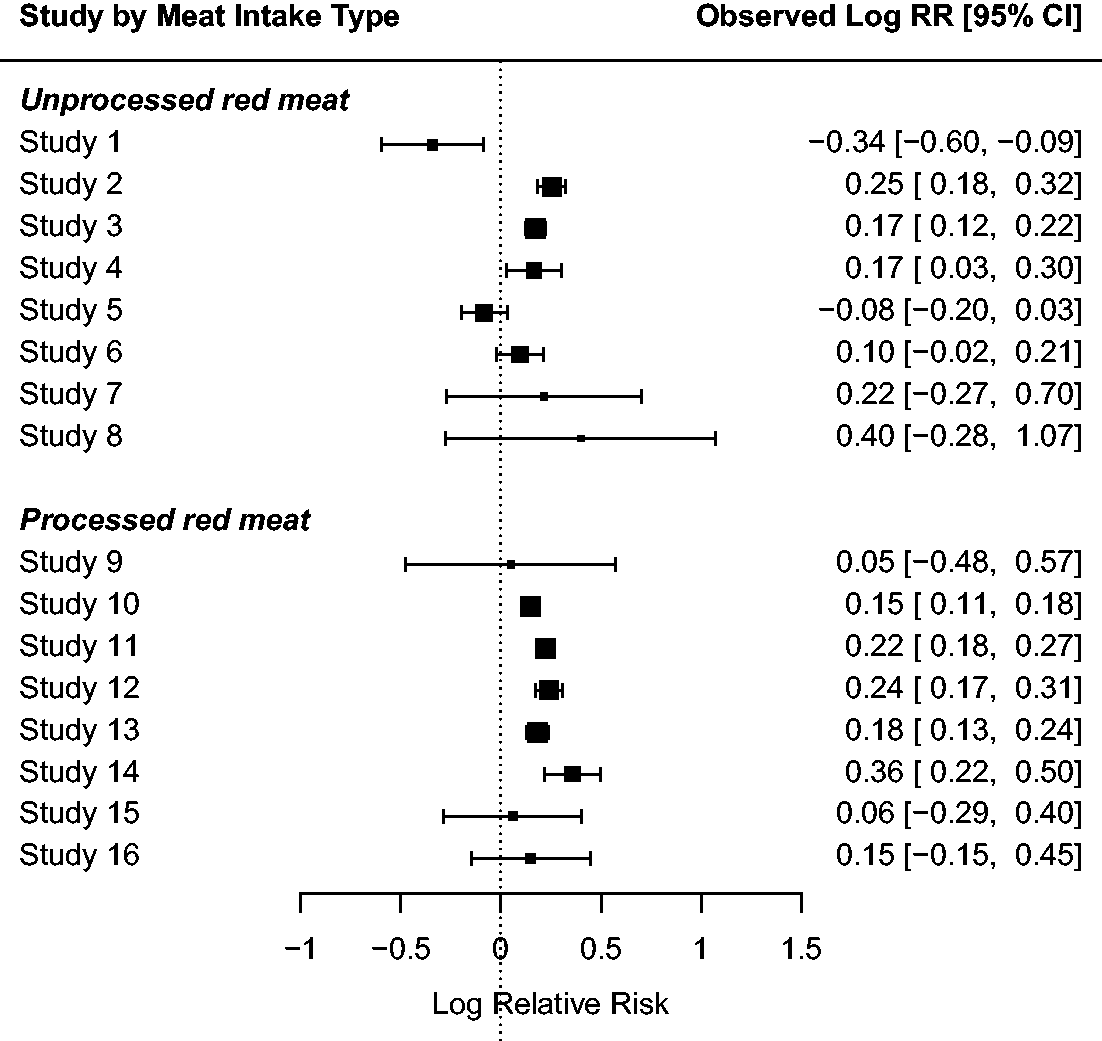
ML, maximum mean BRPL, and maximum median BRPL estimates of the model parameters for the meat consumption data. 9
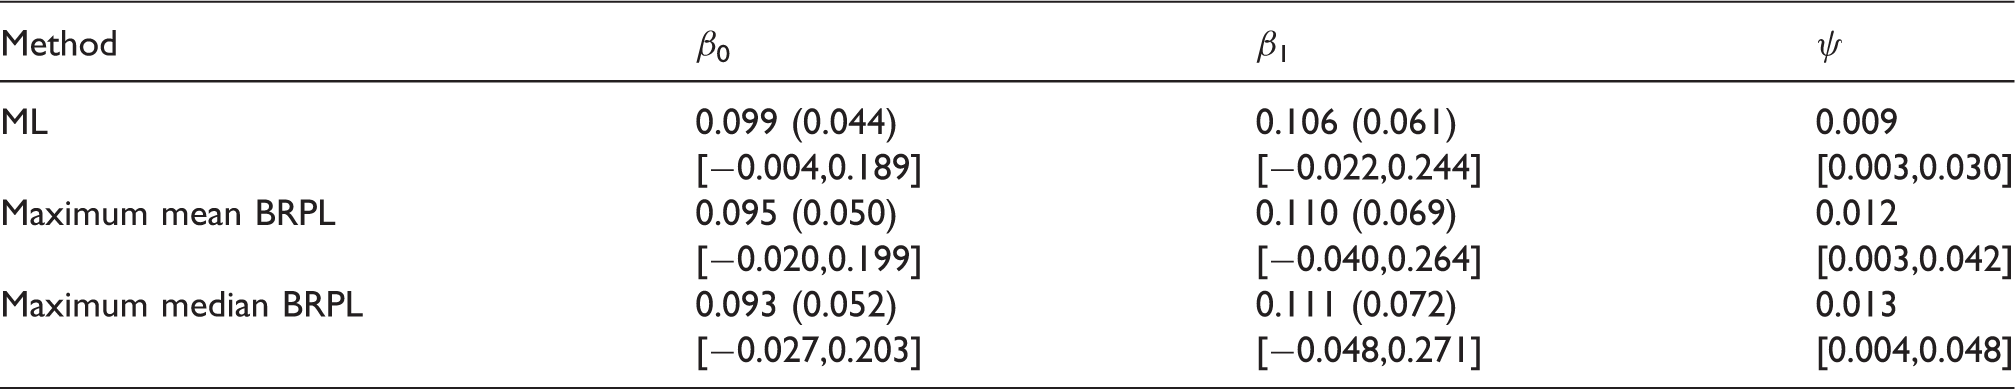
Note: Standard errors are reported in parentheses. The 95% confidence intervals based on the LR, mean BRPL ratio and median BRPL ratio are reported in squared brackets.
The LR test indicates some evidence for a higher risk associated to the consumption of red processed meat with a p-value of 0.047. On the other hand, the mean and median BRPL ratio tests suggest that there is weaker evidence for higher risk, with p-values of 0.066 and 0.074, respectively. Skovgaard’s test also gives weak evidence for higher risk with p-value 0.073.
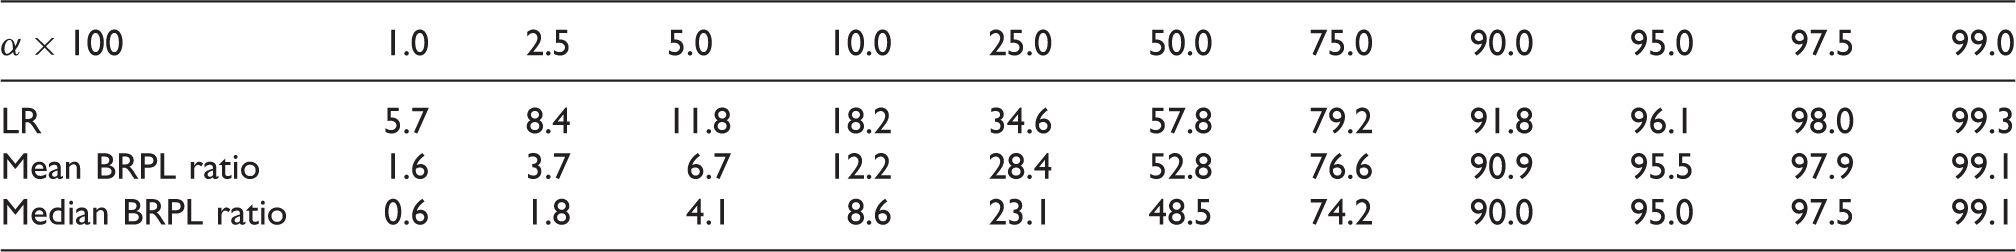
Similar to Section 5, we performed a simulation study in order to further investigate the performance of the three methods in a meta-regression context. We simulated 10,000 independent samples from the meta-regression model at the ML estimates reported in Table 2. Figure 12 shows boxplots of the estimates of β0, β1, and ψ. Maximum likelihood underestimates the parameter ψ, while mean BRPL and median BRPL almost fully compensate for the negative bias of ML estimates, with the latter having a slightly heavier right tail. The percentages of underestimation are 72.6%, 56.6%, and 49.9% for the ML, maximum mean BRPL, and maximum median BRPL estimators, respectively.
Boxplots for the ML, maximum mean BRPL, and maximum median BRPL estimates of β0, β1, and ψ as calculated from 10,000 simulated samples under the ML fit using the meat consumption data.
9
The square point is the mean of the estimates obtained from each method. The dashed grey horizontal line is at the parameter value used to generate the data.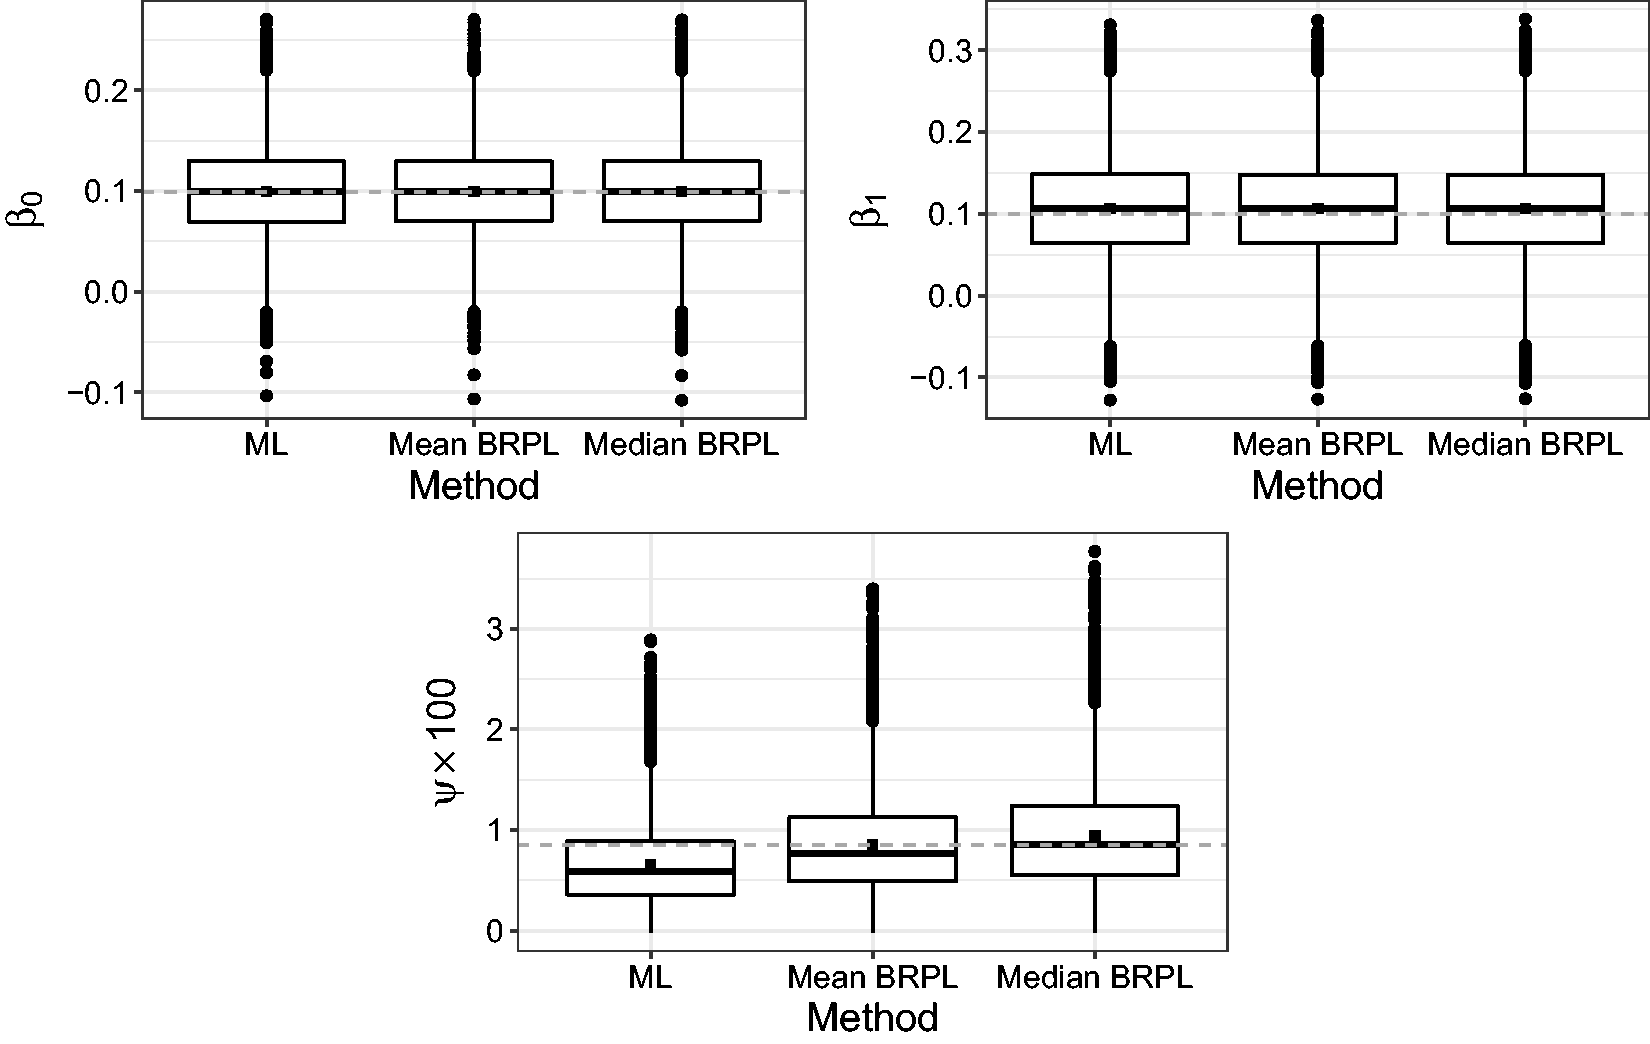
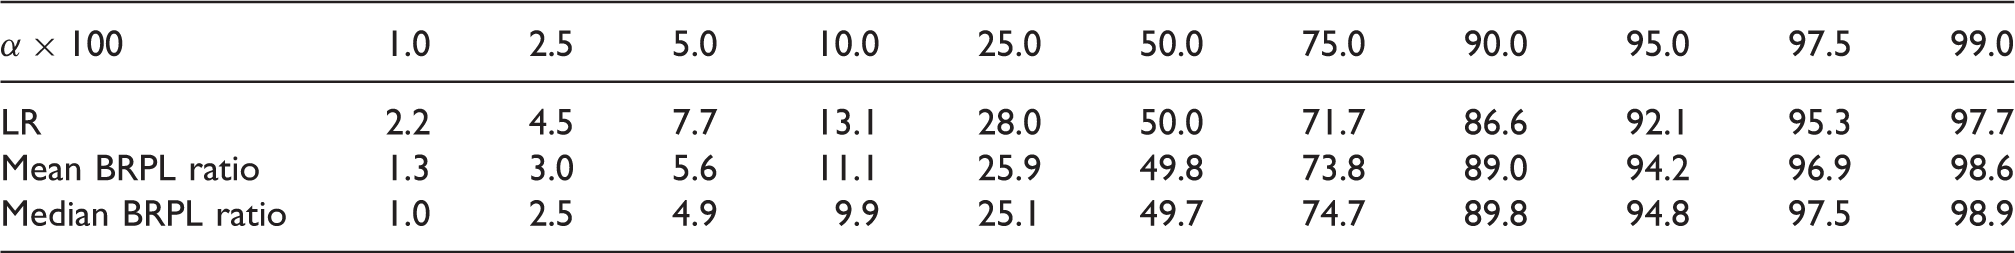
Empirical p-value distribution (%) for the tests based on the LR statistic, the mean BRPL ratio statistic, and the median BRPL ratio statistic using the meat consumption data. 9
8 Concluding remarks
In this paper we derive the adjusted score equations for the median bias reduction of the ML estimator for random-effects meta-analysis and meta-regression models and describe the associated inferential procedures.
We show that the solution of the median bias-reducing adjusted score equations is equivalent to maximising a penalised log-likelihood. The logarithm of that penalised likelihood differs from the logarithm of the mean BRPL in Kosmidis et al. 3 by a simple additive term. The computation of the maximum median BRPL estimators can be performed through a two-step iteration that involves a weighted least squares update and the solution of a nonlinear equation with respect to a scalar parameter, and which converges rapidly, as illustrated by the computational times and number of iterations reported in the paper. The reported times and number of iterations were computed using a workstation with 24 cores at 2.90 GHz and 80 GB memory running under the CentOS 7 operating system, using one core per data set.
Using various settings we were able to retrieve enough information on the performance of the maximum median BRPL estimators. All our simulation studies illustrate that use of the median BRPL succeeds in achieving median centering in estimation, and results in confidence intervals with good coverage properties. Furthermore, while tests based on the LR suffer from size distortions, the median BRPL ratio statistic results in tests with size and power properties, sometimes better to those of the mean BRPL ratio statistic in Kosmidis et al. 3
The main advantage of the maximum median BRPL estimators from the maximum mean BRPL ones is their equivariance under monotone component-wise parameter transformations, which, in the case of random-effects meta-regression, leads to median bias-reduced standard errors.
As random-effect models are widely used in practice, the median BRPL method is likely to be useful in models with more complex random-effect structures, such as linear mixed models.
Footnotes
Acknowledgement
The authors thank E.C. Kenne Pagui for providing the formula for the median bias-reducing adjustment in matrix form.
Declaration of conflicting interests
The author(s) declared no potential conflicts of interest with respect to the research, authorship, and/or publication of this article.
Funding
The author(s) disclosed receipt of the following financial support for the research, authorship, and/or publication of this article: The first author was partially supported by the Erasmus + programme of the European Union which funded her for a two-month traineeship at the University of Padova. The work of the second author was supported by the Alan Turing Institute under the EPSRC grant EP/N510129/1 (Turing award number TU/B/000082) and part of it was completed when he was a Senior Lecturer at University College London. The third author was supported by the Italian Ministry of Education under the PRIN 2015 grant 2015EASZFS_003, and by the University of Padova (PRAT 2015).
Supplemental material
Supplemental material for this article is available online.