
Abstract
Agreement is an important concept in medical and behavioral sciences, in particular in clinical decision making where disagreements possibly imply a different patient management. The concordance correlation coefficient is an appropriate measure to quantify agreement between two scorers on a quantitative scale. However, this measure is based on the first two moments, which could poorly summarize the shape of the score distribution on bounded scales. Bounded outcome scores are common in medical and behavioral sciences. Typical examples are scores obtained on visual analog scales and scores derived as the number of positive items on a questionnaire. These kinds of scores often show a non-standard distribution, like a J- or U-shape, questioning the usefulness of the concordance correlation coefficient as agreement measure. The logit-normal distribution has shown to be successful in modeling bounded outcome scores of two types: (1) when the bounded score is a coarsened version of a latent score with a logit-normal distribution on the [0,1] interval and (2) when the bounded score is a proportion with the true probability having a logit-normal distribution. In the present work, a model-based approach, based on a bivariate generalization of the logit-normal distribution, is developed in a Bayesian framework to assess the agreement on bounded scales. This method permits to directly study the impact of predictors on the concordance correlation coefficient and can be simply implemented in standard Bayesian softwares, like JAGS and WinBUGS. The performances of the new method are compared to the classical approach using simulations. Finally, the methodology is used in two different medical domains: cardiology and rheumatology.
1 Introduction
Reliability and validity studies are of paramount importance in behavioral and medical sciences. They provide information about the amount of error inherent to any diagnosis, score or measurement. Reliability studies involve repeated measurements of a random sample of items from a target population under the same experimental conditions. On quantitative scales, reliability is classically quantified by an intraclass correlation coefficient (ICC).1,2 In validity studies, and in particular when studying criterion validity, the measurement instrument is calibrated against an established method. The established method is often regarded as a “gold standard” measuring the “true value” of the quantity to be determined. However, it is frequent that the reference method cannot be viewed as giving a true value. Then, the comparability of the new and the reference methods is assessed by the degree of agreement between them. Agreement is also important in clinical decision making, where disagreements between physicians can lead to different treatments for the patient. On quantitative scales, agreement can be assessed visually using the Bland and Altman plot 3 or be quantified using the concordance correlation coefficient (CCC).4,5 In the presence of two fixed scorers, the ICC and CCC are equivalent under the assumption that the joint distribution of the scores given by the two methods is bivariate normal. However, the concordance correlation can also be determined without the bivariate normality assumption, which represents an advantage over the intraclass correlation.6,7
The present paper is motivated by two studies. The first study, the COCO study (unpublished work), is a study on the COmpliance and COmplexity of drug regimen in hypertension. The primary objective was to compare the compliance to an antihypertensive treatment when it was given in a single tablet or as two or three separate tablets. Compliance was assessed on a 100 mm VAS scale by the patient and the physician. The interest was therefore also in the agreement level between the patient and the physician assessments and in the impact of the drug regimen complexity on this agreement level. The second study is the PETRA study, 8 an explorative study on the use of F-Fluorodeoxyglucose Positron Emission Computer Tomography (F-FDG PET/CT) in the assessment of rheumatoid arthritis (RA) remission. The DAS28 score, involving a clinical examination of 28 particular articulations for swelling and tenderness, is usually used in the assessment of remission. The presence of synovitis was assessed using F-FDG PET/CT and ultrasound (US) in these 28 articulations. The agreement between the percentage of positive joints detected with the F-FDG PET/CT and the US is of particular interest to study whether these techniques could be interchangeably used as additional tool in the remission diagnosis.
A first particularity of these studies is that the outcome is a bounded score and can present a variety of distributions, including J- or U-shapes 9 with lots of observations at the boundaries. Second, the impact of covariates on the CCC is of direct interest in the first study. Barnhart and Williamson 10 proposed the use of three sets of generalized estimating equations to model the CCC according to covariates. However, on bounded scales, the adequacy of the CCC as agreement measure and therefore of the method of Barnhart and Williamson could be questioned because the CCC is based on the two first statistical moments, which might not be good summary measures to describe J- or U-shapes. Although the CCC was also recently generalized to handle log-normal distributions,11,12 the methods do not cover data with more general J- or U-shapes.
Hutton and Stanghellini 13 proposed to use censored skewed normal distributions to model bounded outcomes. They consider the case where the bounded score is a weighted average of scores obtained on various questionnaires and scaled to range between 0 and 100. The idea behind their approach is to assume the existence of values beyond the range of the bounded scale and to consider that values at the boundaries are censored. In the two motivating examples, this assumption can hardly be made. In the COCO study, the outcome is measured on a VAS scale where the boundaries are defined as the smallest and largest possible score. In the PETRA study, the outcome is the percentage of positive joints which cannot be extended outside the 0–100% range. Moreover, U-shapes cannot be adequately described using a censored skewed normal distribution. Lesaffre et al. 9 developed a methodology to handle bounded scores of two types: (1) when the bounded score is a coarsened version of a latent score with a logit-normal (LN) distribution on the [0,1] interval, like potentially in the COCO study and (2) when the bounded score is a proportion with the true probability having a LN distribution, like possibly in the PETRA study. The LN distribution was originally suggested by Johnson 14 and can describe a variety of distributions, including distributions with J- and U-shapes. A LN distribution can directly be assumed when the bounded score is a pure percentage, like the ejection fraction in cardiology or is a continuous bounded score.
In the present work, a model-based CCC based on a bivariate generalization of the LN distribution is defined. We adopted a model-based approach to permit a direct relationship between the CCC and predictors. This could help researchers in improving agreement levels by identifying influential factors. Statistical inference for the CCC is obtained within the Bayesian framework. The choice of a Bayesian framework is motivated by the fact that it has shown good frequentist properties in a variety of settings. In Bayesian inference, prior knowledge about the parameters is combined with the likelihood to yield a posterior distribution. When the posterior distribution is not of standard form, Markov Chain Monte Carlo (MCMC) can be used to sample from the posterior distribution. Bayesian estimation is also flexible in the presence of covariates and missing values and easy to implement. The methodology developed in this paper can be directly implemented in standard Bayesian software, like JAGS and WinBUGS.
The motivating datasets are presented in Section 2. Then, the classical definition of the CCC is given in Section 3. This definition is extended in Section 4 to bounded scales and the inferential procedure is given in Section 5. In section 6, the Bayesian estimation method is presented. Simulations are performed to assess the properties of the new methodology in Section 7. Then, the method is illustrated on the COCO and the PETRA studies in Section 8. Finally, the methodology is discussed in Section 9.
2 Motivating studies
2.1 COCO study
About 20–30% of adults suffer from hypertension, a major risk factor for cardiovascular diseases. The control of hypertension by adapting the lifestyle behavior and taking medication reduces these risks. Unfortunately, less than 50% of the patients treated for hypertension have controlled blood pressure. 15 Compliance to the treatment is an important determinant of controlled blood pressure. Indeed, whatever the definition of compliance, poor compliance is the most important cause of uncontrolled blood pressure and only 50–70% of the patients being treated for hypertension in real life situation are considered to be “good compliers.”
Negative determinants of compliance include multiple daily dosing, chronic duration and asymptomatic disease. The COCO study purposed to investigate whether a fixed combination of antihypertensives (taken as a combined treatment in one tablet) instead of multiple drug intake could decrease drug regimen complexity and improve treatment compliance. To avoid bias related to the type of drug used, attention was restricted to the combination of a diuretic with another antihypertensive drug, given as a combination tablet or as two or three separate tablets.
The COCO study is a multicenter survey carried out from November 2005 to June 2006. A total of 1260 eligible patients, with a stable hypertensive treatment since at least six months, were evaluated during a regular visit by their physician. In this report, the agreement between the patient and the physician assessment of the compliance on a 100 mm VAS scale is studied. The effect of the number of tablets on the agreement level is of particular interest since it could be more difficult to define compliance when increasing treatment complexity. Other possible predictors considered are gender, disease duration (year), acceptability of the treatment (5-point Likert scale) and tolerance to the treatment (%). Compliance scores were available for 1025 patient–physician pairs and are displayed in Figure 1.
COCO study. Compliance assessed on a 100 mm VAS scale by the patient and the physician. The observed marginal distribution (histogram) and the marginal density distribution predicted by the LN approach (lines) are reported in the margins.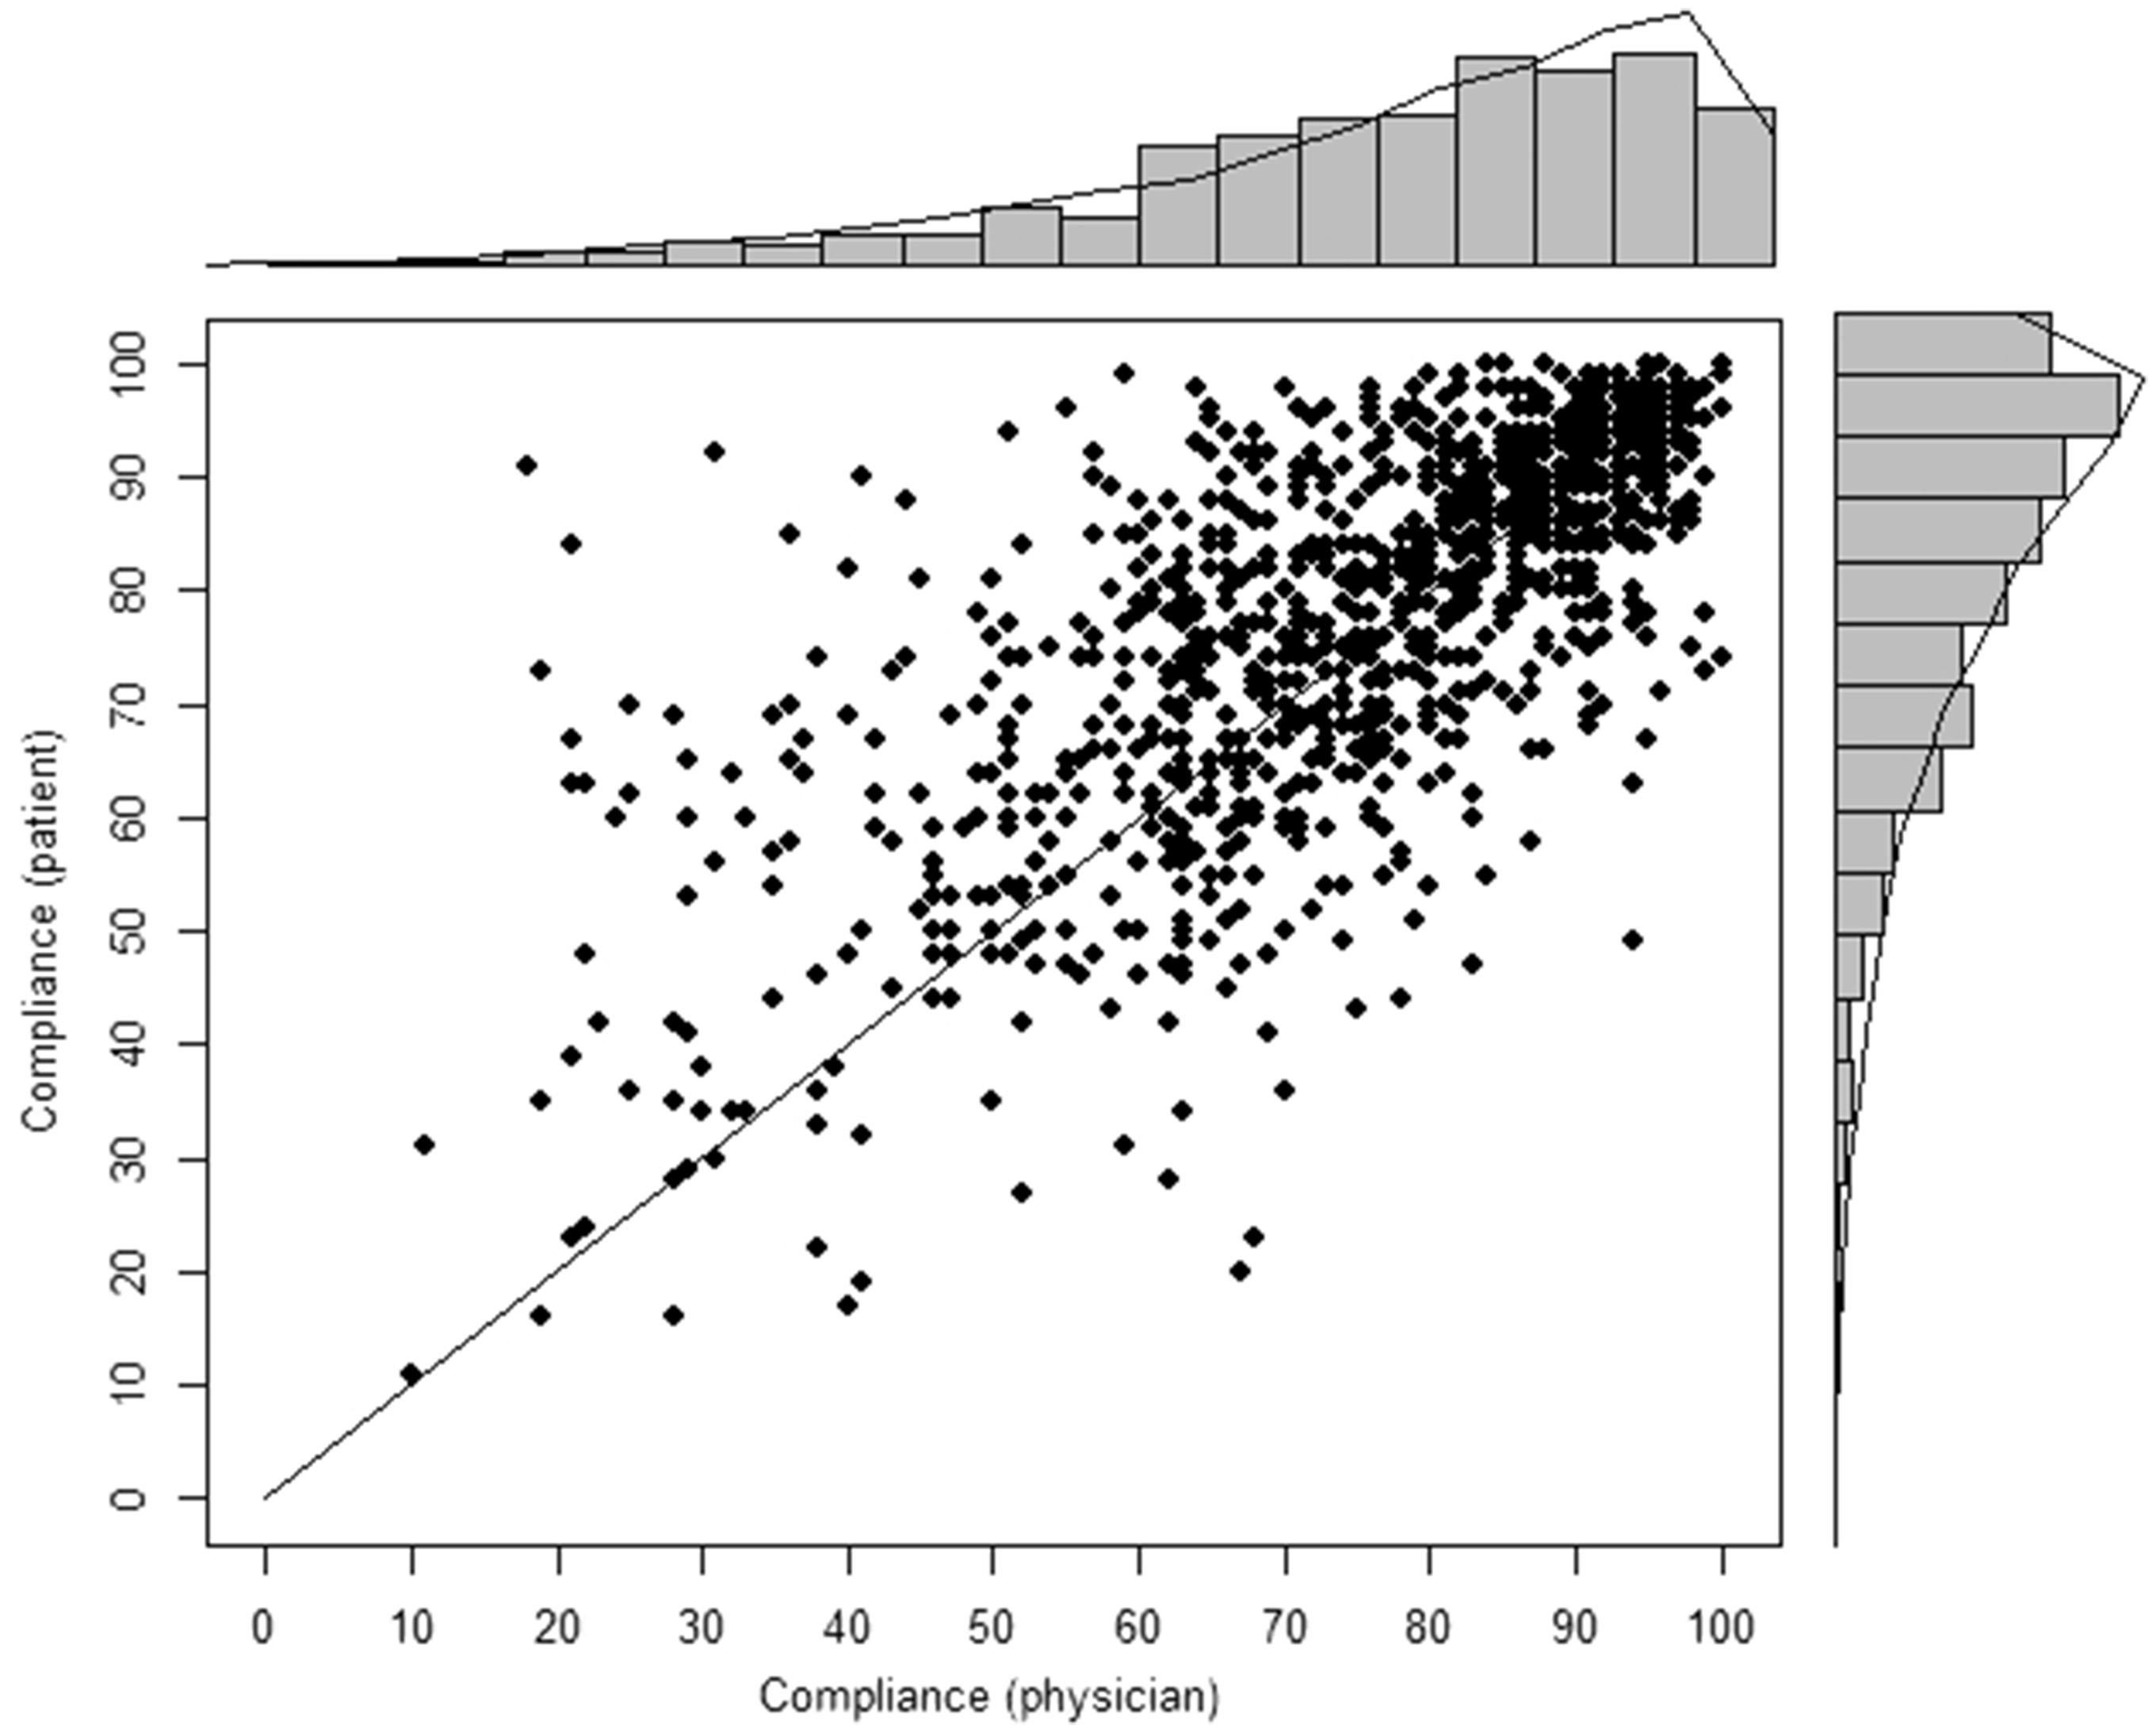
2.2 PETRA study
The disease activity score based on 28 joints (DAS28) might not be sufficient to assess remission in RA. Several studies have shown that patients in remission according to the DAS28 still evidence synovitis by US and magnetic imaging resonance. Those patients could eventually develop irreversible joint damage. Although F-FDG PET/CT is known to be correlated with DAS28 in patients with active RA, its role in assessing remission has not been evaluated yet.
The PETRA study
8
is therefore an exploratory study to see whether F-FDG PET/CT could be used in the assessment of RA remission. The presence of synovitis was assessed on the 28 joints involved in the determination of the DAS28 score on 63 patients with RA, representing a total of 1764 joints. There were 42 (67%) women and 21 (33%) men, on average 55 years old (range: 24–77 years, median: 55 years). A total of 22 (35%) patients were in remission (DAS28<2.63), 31 (49%) presented with moderate disease activity (2.6 ≤DAS28≤5.1) and 10 (16%) with severe disease activity (DAS28>5.1). F-FDG PET/CT scans were first analyzed visually and then semiquantitatively by determining the Standardized Uptake Value of the positive joints. Synovitis was considered as present in US according to the OMERACT criteria. In this paper, interest is in the agreement between the F-FDG PET/CT scan and the US on the assessments of the number of positive joints. Interest is primarily on the number of positive joints detected rather than on each joint separately because this is the quantity used in the DAS28 score to assess disease remission. The distribution of the proportion of joints with synovitis observed by the two methods is depicted in Figure 2.
PETRA study. Proportion of positive joints observed with the F-FDG PET/CT scan and the US. The marginal densities observed (histogram) and predicted (lines) by the LN approach are also depicted.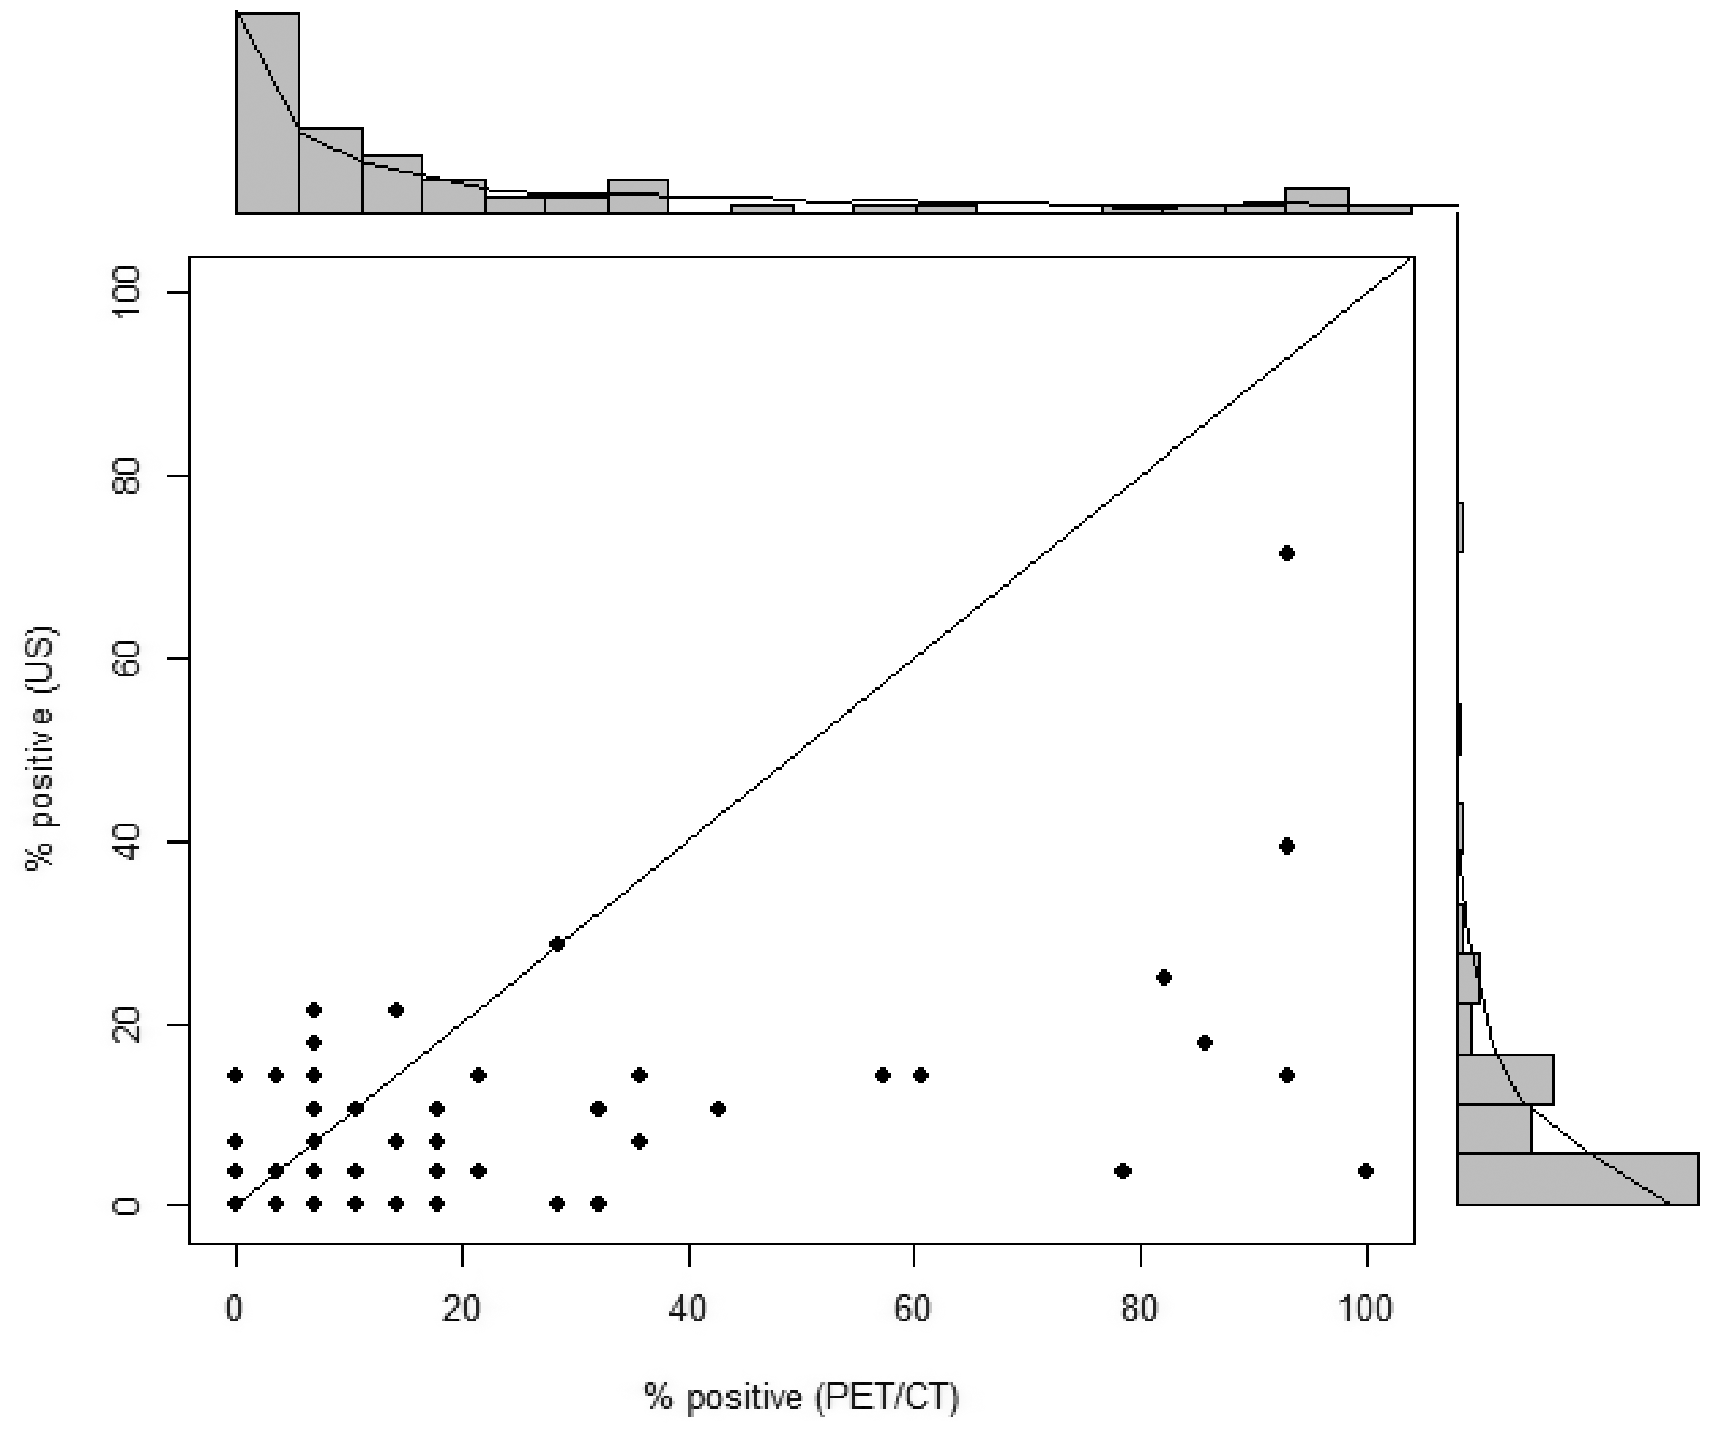
3 Classical definition of the CCC
Let


When sampling from a bivariate normal distribution, Lin
4
showed that

While the asymptotic standard error of the CCC relies on the bivariate normal distribution of the scores, the definition of the CCC itself is not based on any distributional assumption and involves only the two first moments and the correlation. The CCC is therefore valid for a variety of distributions. However, it could not be an adequate measure in case of distributions with a J- or a U-shape because the first and the second moments are not good summary measures to describe the shape of the distribution in that case.
4 CCC on bounded scales
Scores obtained on a bounded scale, like in the COCO and the PETRA studies, show a variety of distributions, from unimodal to non-standard J-and U-shape. Johnson
14
and later Lesaffre et al.
9
suggested the use of the LN distribution to model these non-standard distributions. The LN distribution can accommodate a wide range of shapes, as shown in Figure 3.
Different logit-normal distributions among which the predicted LN distributions for the COCO and PETRA studies.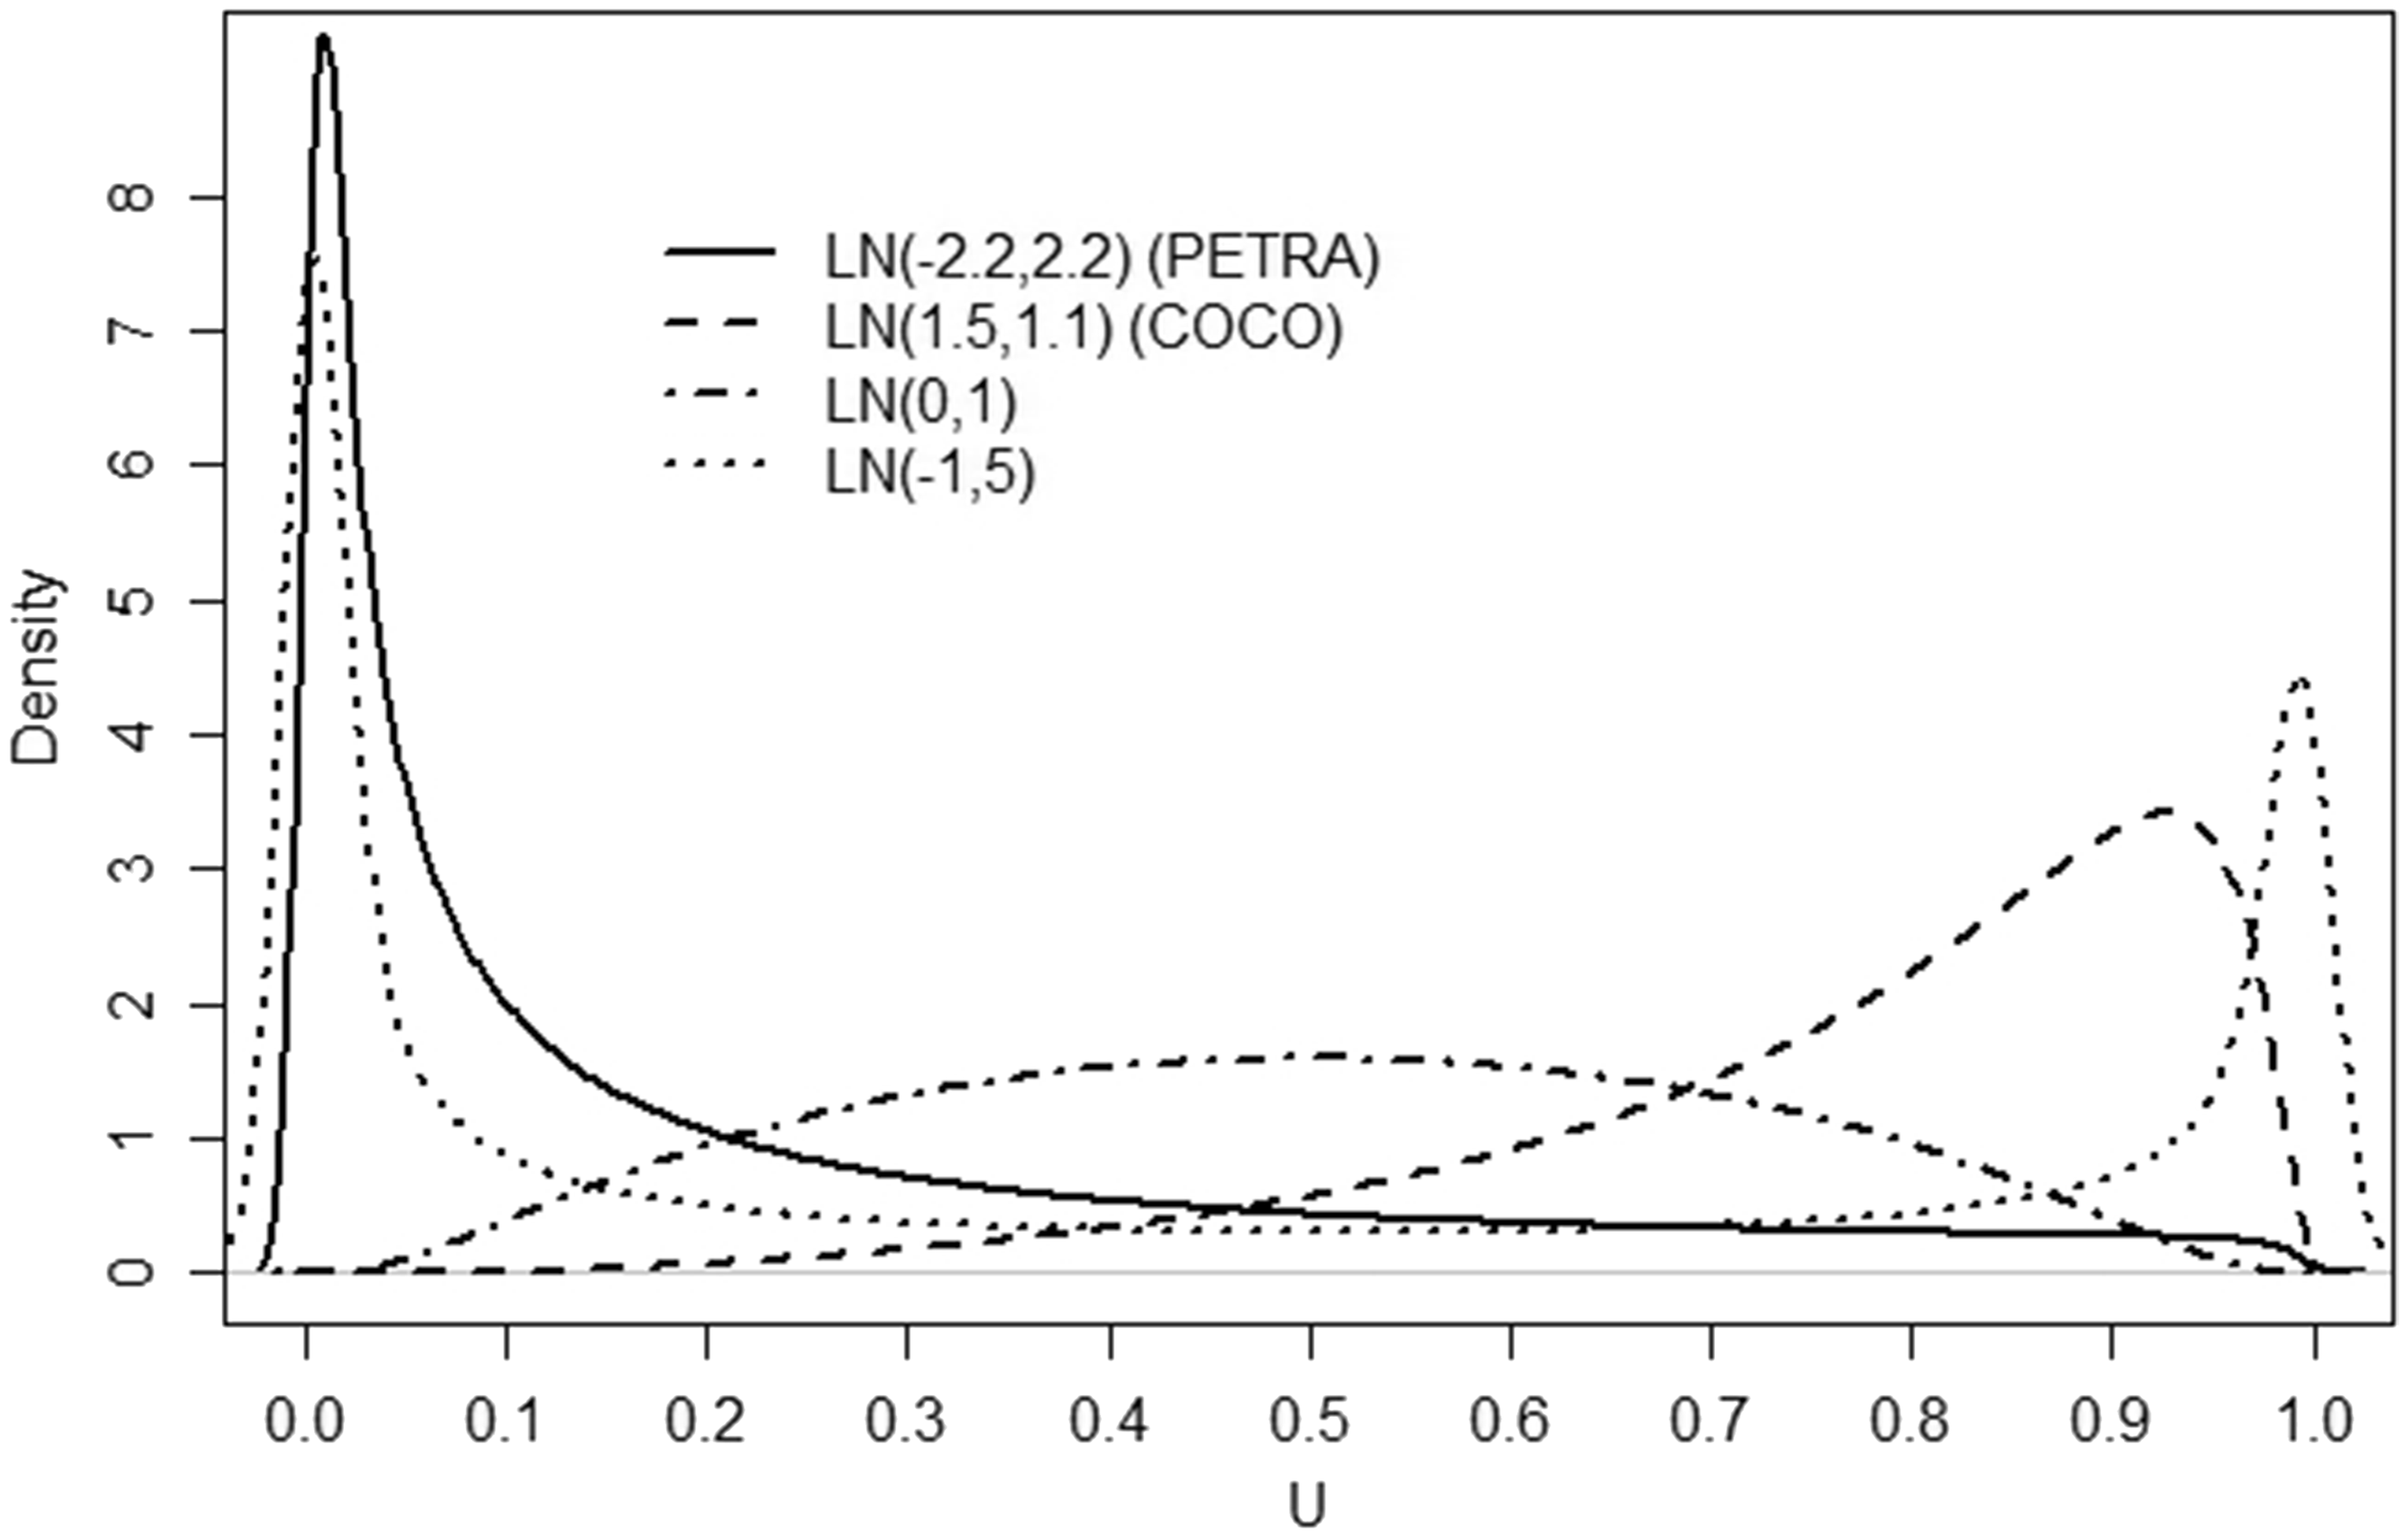
In this section, we generalize the approach of Lesaffre et al. 9 to the bivariate case considering that the bounded score is a coarsened version of a latent score with a LN distribution on the [0,1] interval, like in the COCO study or that the bounded score is a proportion with the true probability having a LN distribution, like in the PETRA study. Note that when the bounded score is a pure percentage, like the ejection fraction in cardiology or is a continuous bounded score, a bivariate LN (BLN) distribution can directly be assumed.
Since the mean and the variance of the scores given by the two scorers as well as the agreement/correlation will be allowed to vary according to covariates related to the items/scorers, the subscript i referring to the item is introduced.
4.1 Continuous bounded scores
Let
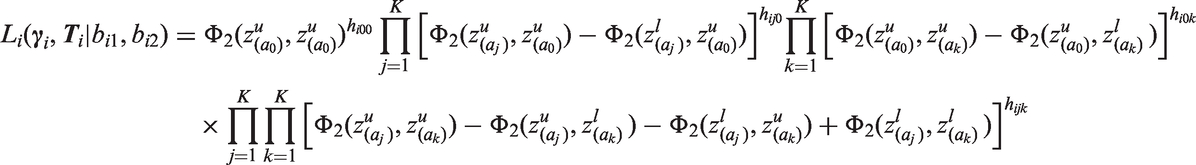
4.2 Coarsened bounded scores
Suppose that the vector of the scores given by the two scorers

It is further assumed that the vector Ui follows a BLN distribution, i.e., that
The CCC is defined at the latent scale level as

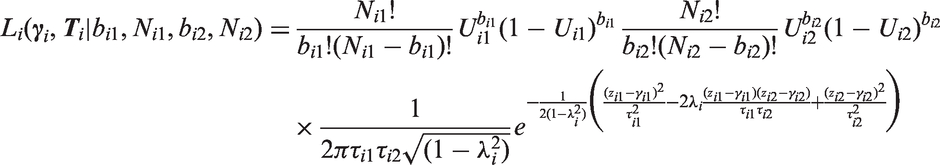
4.3 Proportions
Suppose that the bounded score Bij (i = 1, …, N;j = 1, 2) is the proportion of success resulting from a series of independent Bernoulli experiments, conditionally on the item scored. For example, in the PETRA study, each of the 28 joints of a patient is assessed as positive or negative for synovitis. Like in Lesaffre et al.,
9
it is assumed that
5 Statistical inference
The aim is to relate the CCC of interest to predictors depending on the items and/or scorers’ characteristics. The CCC can be defined on the original scale (ρci) in case of bivariate normal data or on a latent or transformed scale (λci) in case of BLN data. Note that if interest lies in correlation rather than in agreement, the correlation coefficients ρi or λi can be considered instead of the CCC ρci and λci, respectively. The inference procedure will remain the same. Therefore, the general notation φ
i
will be used to refer to correlation and CCCs. Since - 1 ≤ φ
i
≤ 1, Fisher link function can be used to link φ
i
to predictors,

5.1 Continuous bounded scores
We suppose that for item
5.2 Coarsened bounded scores
If the vector
Let the means and variances depend on covariates, i.e.,
5.3 Proportions
We suppose that for item i (
If the means and variances depend on covariates similarly to Section 5.2 and since
6 Bayesian estimation
It is possible to obtain the MLE of the CCC analytically for the bivariate normal distribution. However, in the case of bounded outcomes, the use of the logit link makes the computations more complex and there is no analytical way to estimate the cumulative bivariate normal density used in the coarsened case. The cumulative bivariate normal density can be estimated using algorithms
16
or approximation formula.17–20 We adopted a Bayesian approach using MCMC and an approximation formula mainly for two reasons. First, Bayesian methods have shown good frequentist properties in a variety of settings and are very flexible in the handling of covariates and missing values. Second, by doing so, the method developed only requires to write the likelihood in a standard Bayesian software (e.g. JAGS, WinBUGS). In a Bayesian approach prior knowledge about the parameters is combined with the observed data (likelihood) to yield the posterior distribution. We used vague priors which express the lack of prior information on the parameters. For all the regression coefficients
Several approximation formula of the cumulative bivariate normal distribution
7 Simulations
To study the performances of the BLN methodology and compare them to the performances of the classical method, 1000 datasets were generated under the bivariate normal assumption for two scenarios. Both scorers possess a N(2,1) distribution in scenario 1 and a N(0,3) distribution in scenario 2 on the latent scale. The same distribution was assumed for both scorers to ensure that all the range of CCC could be covered. Then, the expit transformation was applied to the bivariate data. The LN marginal probability distribution of the two scorers (LN(2,1) and LN(0,3)) is depicted in Figure 4.
Simulations. Logit-normal distributions used in the two scenarios.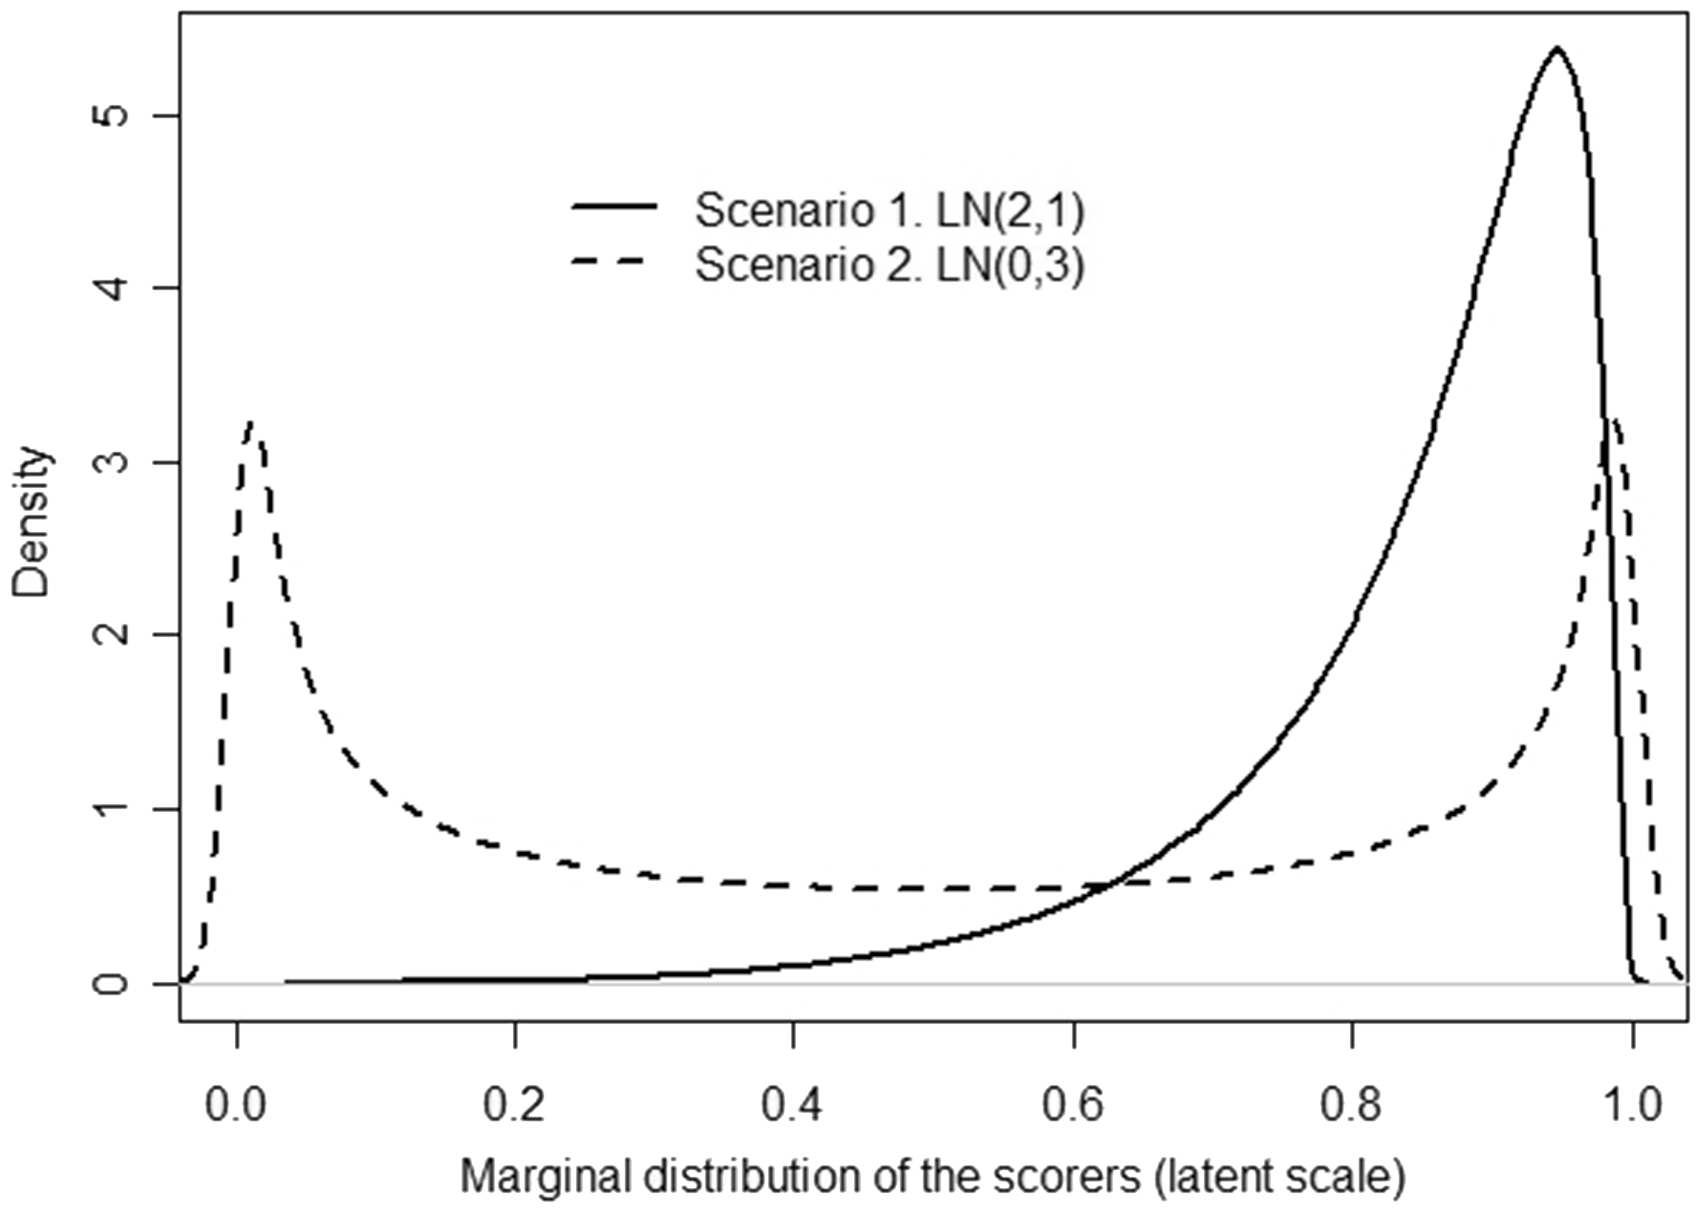
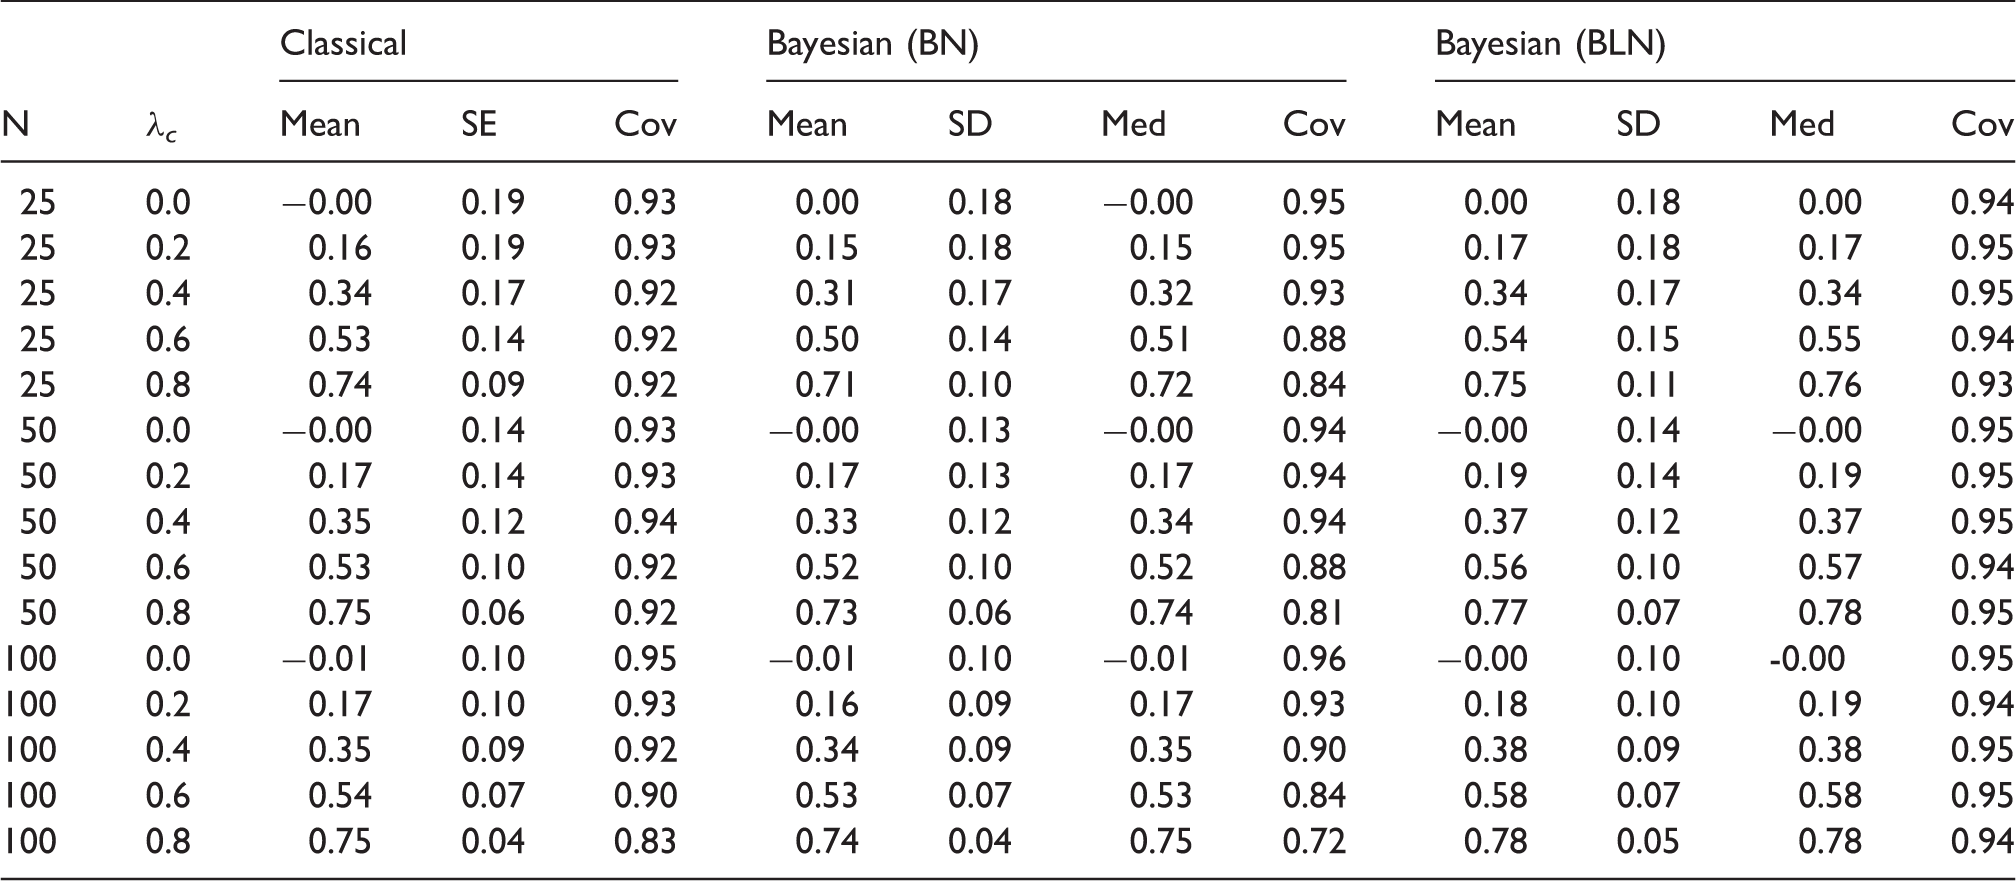
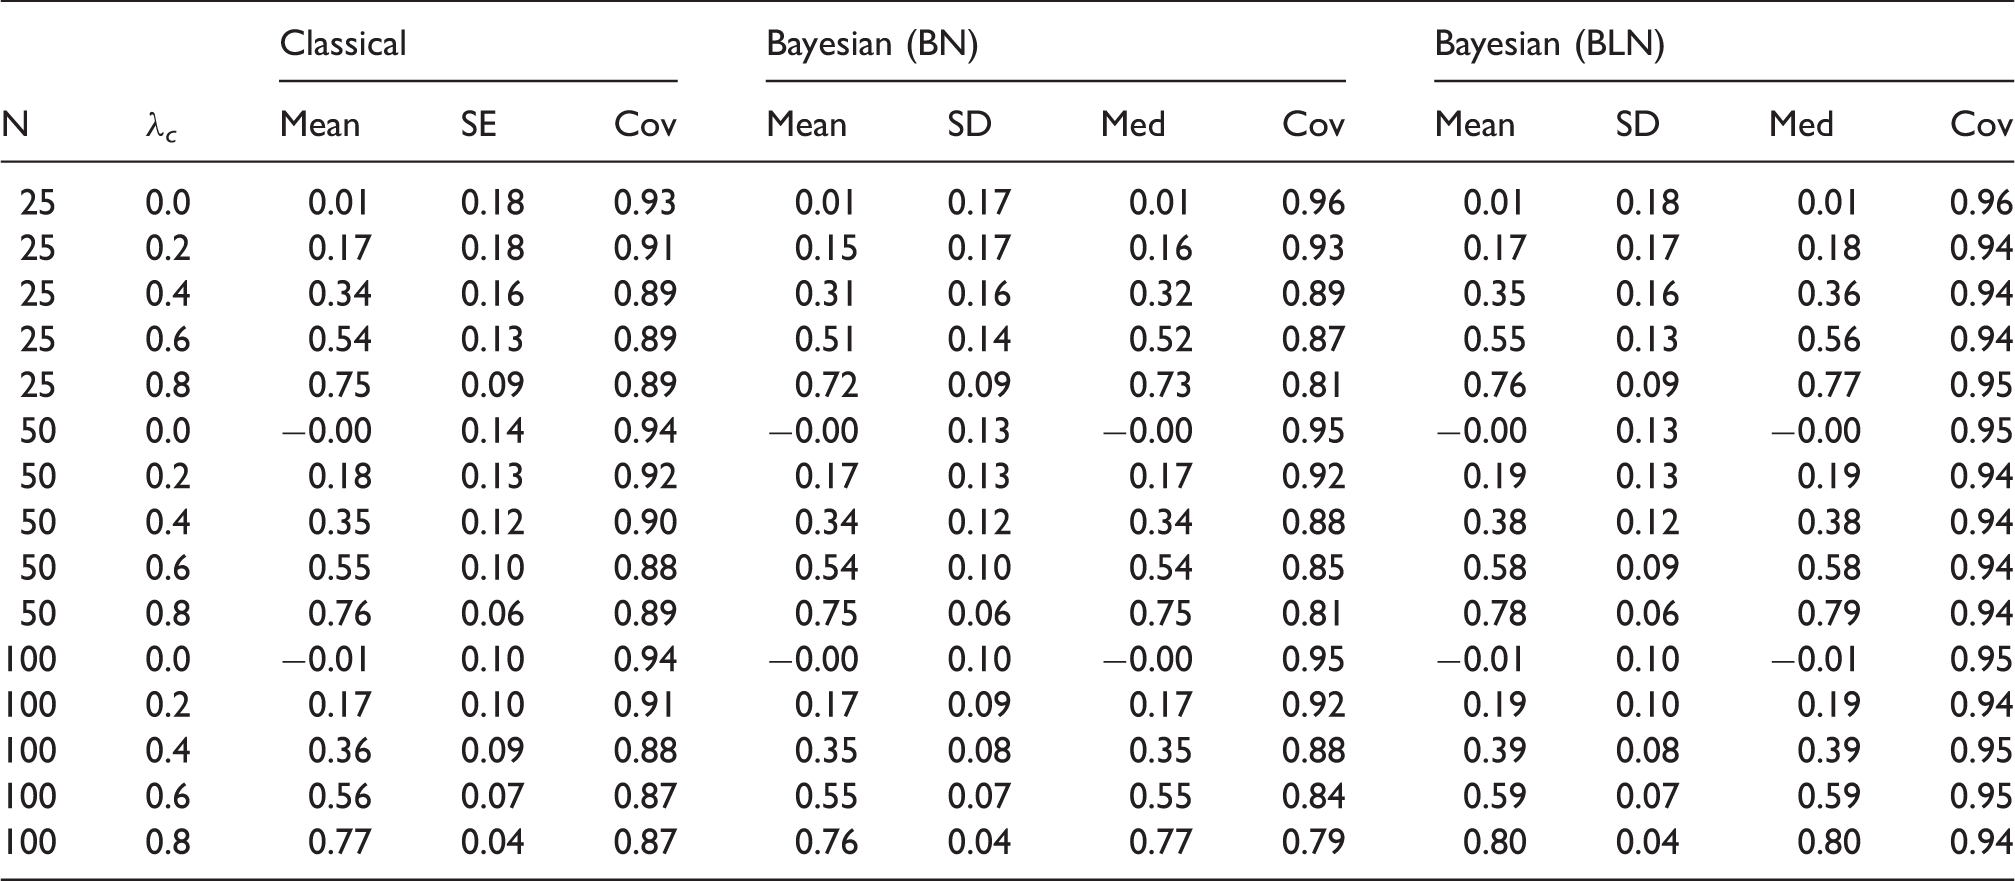
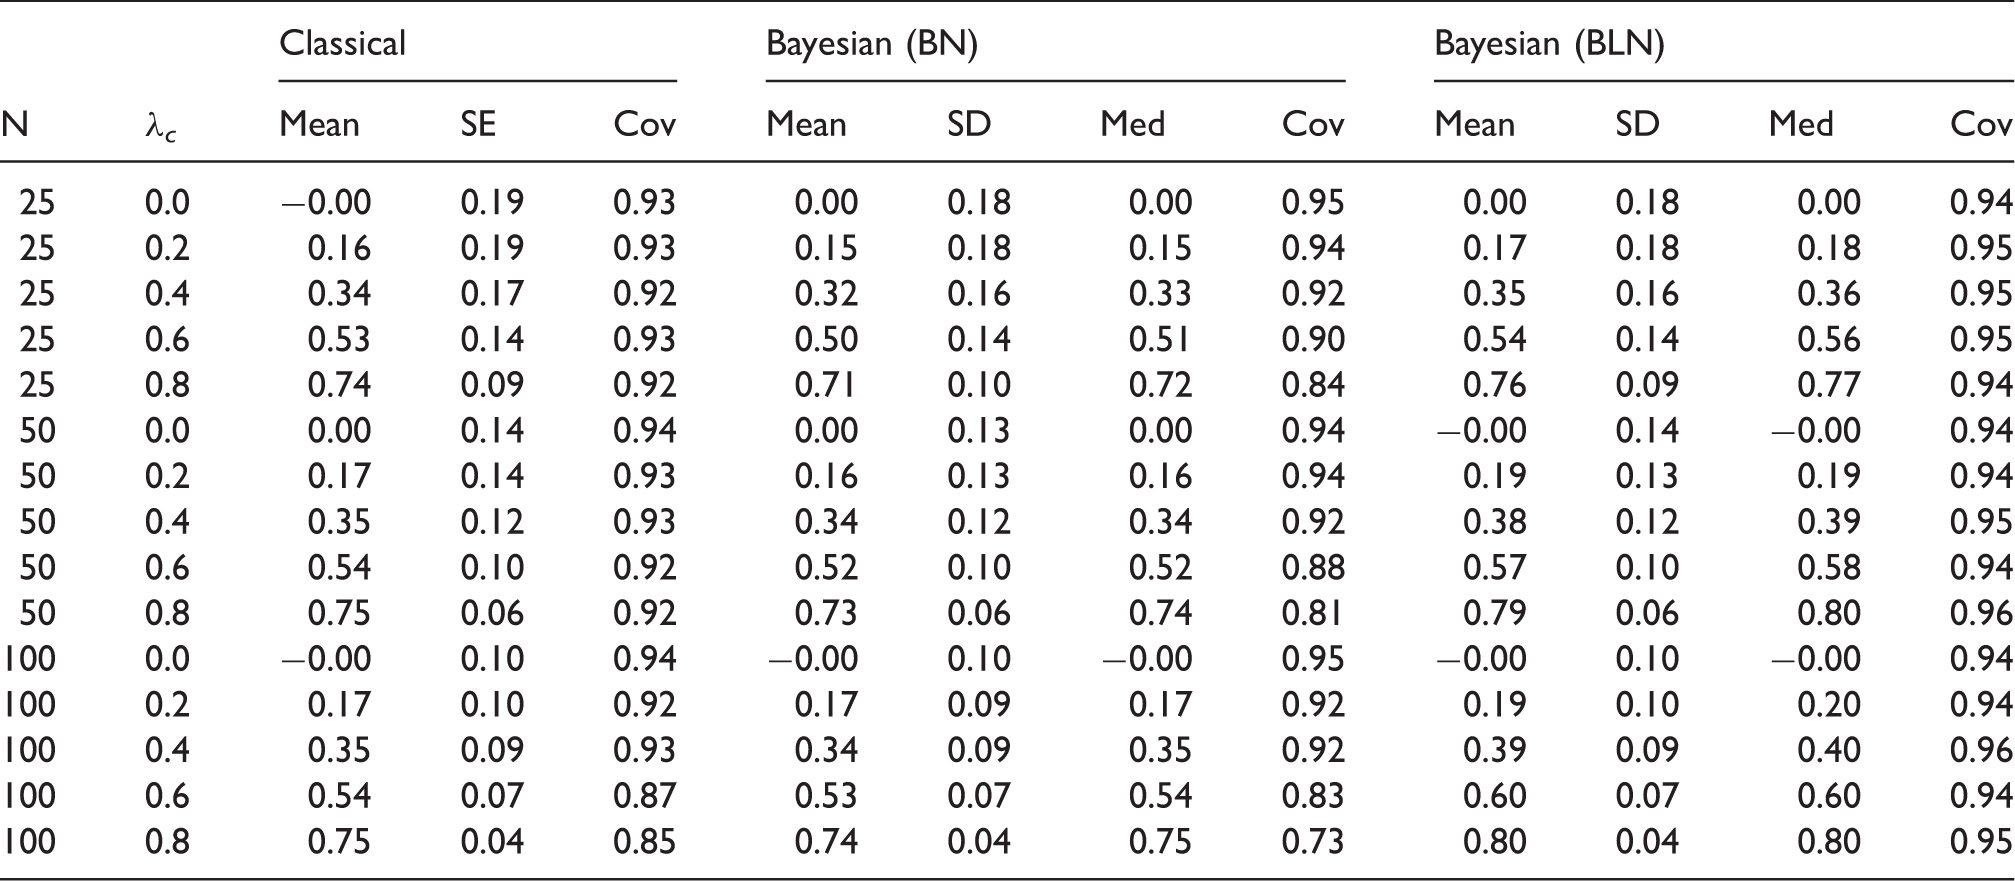
For each scenario, three sample sizes (N = 25, 50, 100) and five values of the CCC (λ c = 0.0, 0.2, 0.4, 0.6, 0.8) were considered. The classical CCC was computed on the bounded scale. The mean of the parameter estimates and their standard error obtained on the 1000 datasets are reported in the summary tables along with the coverage level, defined as the percentage of samples where the 95% confidence level covers the theoretical CCC value. The posterior distribution of the CCC was also obtained in the Bayesian framework under a bivariate normal model and the BLN model. In the coarsened case, the performance of the method was evaluated with 10 and with 100 cut-offs values. A large number of experiments (1000) was considered in the proportion case to speed up the convergence. Three chains were considered. A period of 1000 iterations was taken as burn-in period and 1000 iterations were sufficient to attain convergence. The posterior mean, median and standard deviation (SD) of the CCC are reported in the summary tables. In this case, the coverage level is defined as the percentage of samples for which the 95% equal-tailed credibility interval covers the theoretical value.
7.1 Bounded coarsened scores
Simulations – Bounded coarsened scales: Scenario 1.
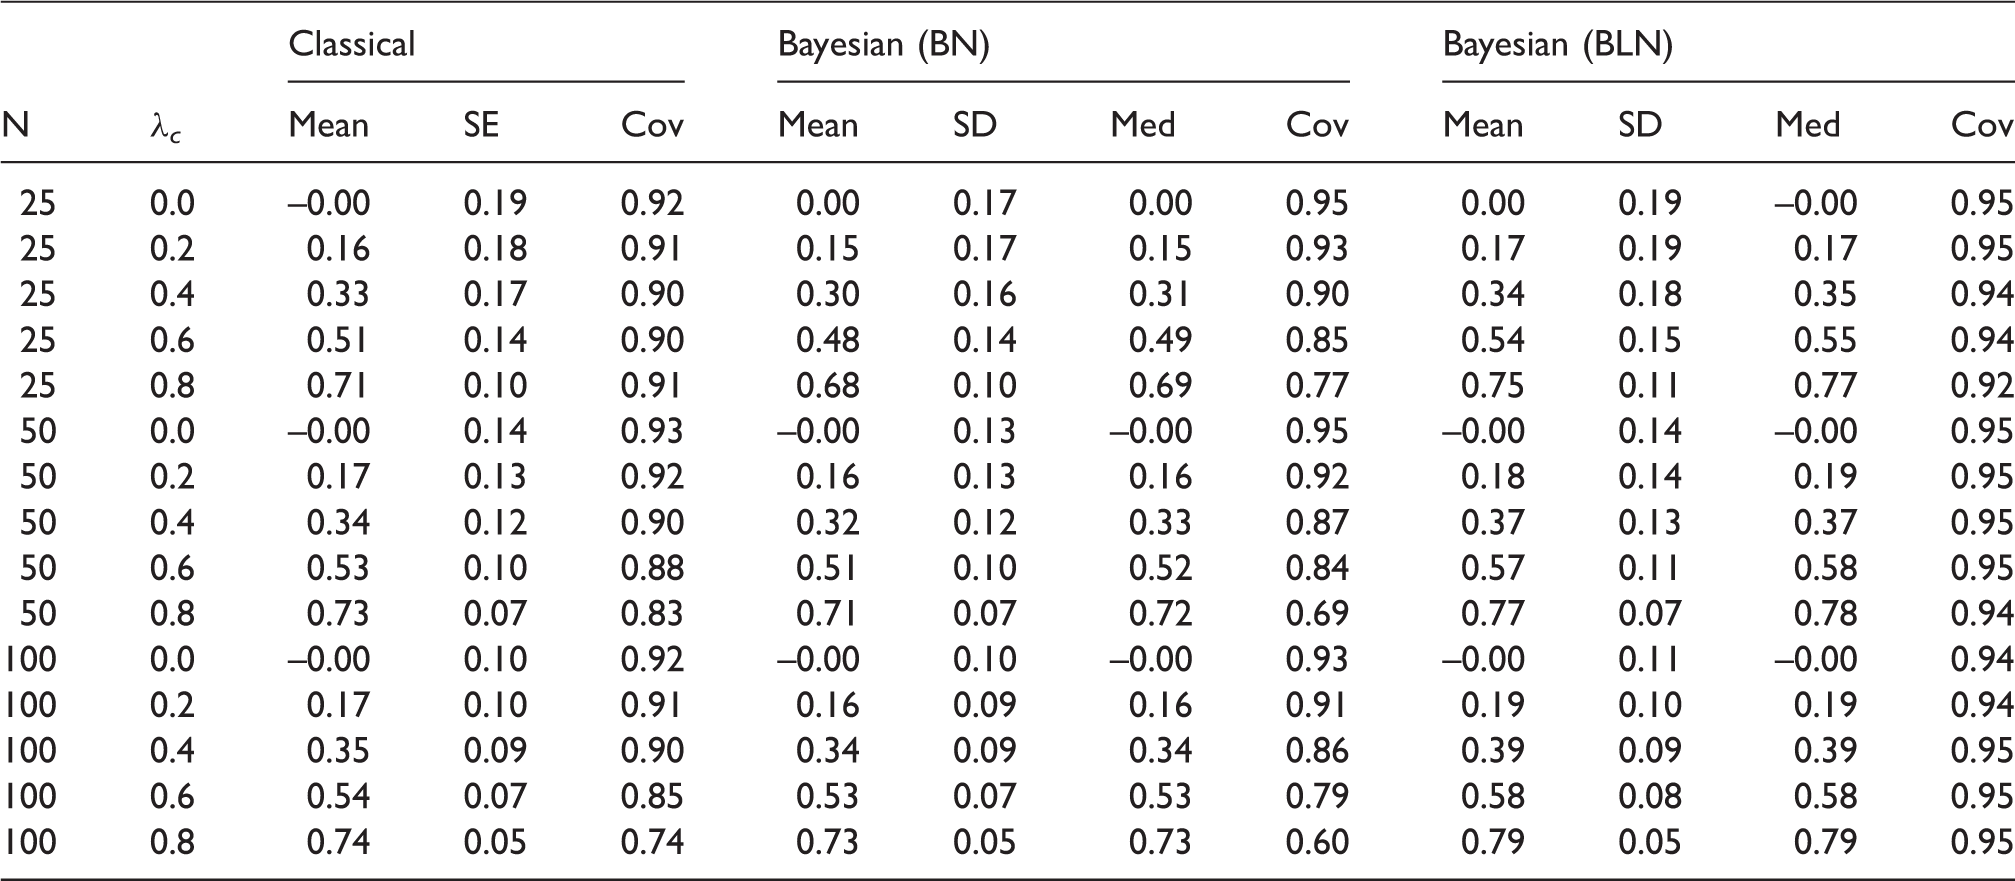
Both scorers have a LN(2,1) distribution (10 point-scale). In the column Bayesian (BN), the posterior distribution of the CCC is estimated under a bivariate normal distribution while it is estimated under a bivariate logit-normal distribution in the column Bayesian (BLN). Cov = coverage.
Simulations – Bounded coarsened scales: Scenario 2.
Both scorers have a LN(0,3) distribution (10 point−scale). In the column Bayesian (BN), the posterior distribution of the CCC is estimated under a bivariate normal distribution while it is estimated under a bivariate logit-normal distribution in the column Bayesian (BLN). Cov = coverage.
7.2 Percentage scales
Simulations – Percentage scales: Scenario 1.
Both scorers have a LN(2,1) distribution. In the column Bayesian (BN), the posterior distribution of the CCC is estimated under a bivariate normal distribution while it is estimated under a bivariate logit-normal distribution in the column Bayesian (BLN). Cov = coverage.
Simulations – Percentage scales: Scenario 2.
Both scorers have a LN(0,3) distribution. In the column Bayesian (BN), the posterior distribution of the CCC is estimated under a bivariate normal distribution while it is estimated under a bivariate logit-normal distribution in the column Bayesian (BLN). Cov = coverage
8 Examples
Posterior predictive checks (PPC) were used to assess the model fit in two different ways. First, we verified that the marginal probability distribution of each scorer followed a LN distribution as predicted by the BLN model using a chi-square test.
22
Second, a multivariate model checking was done according to the method of Crespi and Boscardin.
23
The method consists in simulating a large number, (e.g. R = 500), of bivariate observations
8.1 COCO study
COCO study – Compliance scores (mean (SD), median) given by the patient and the physician according to demographic and treatment characteristics (N = 1025).
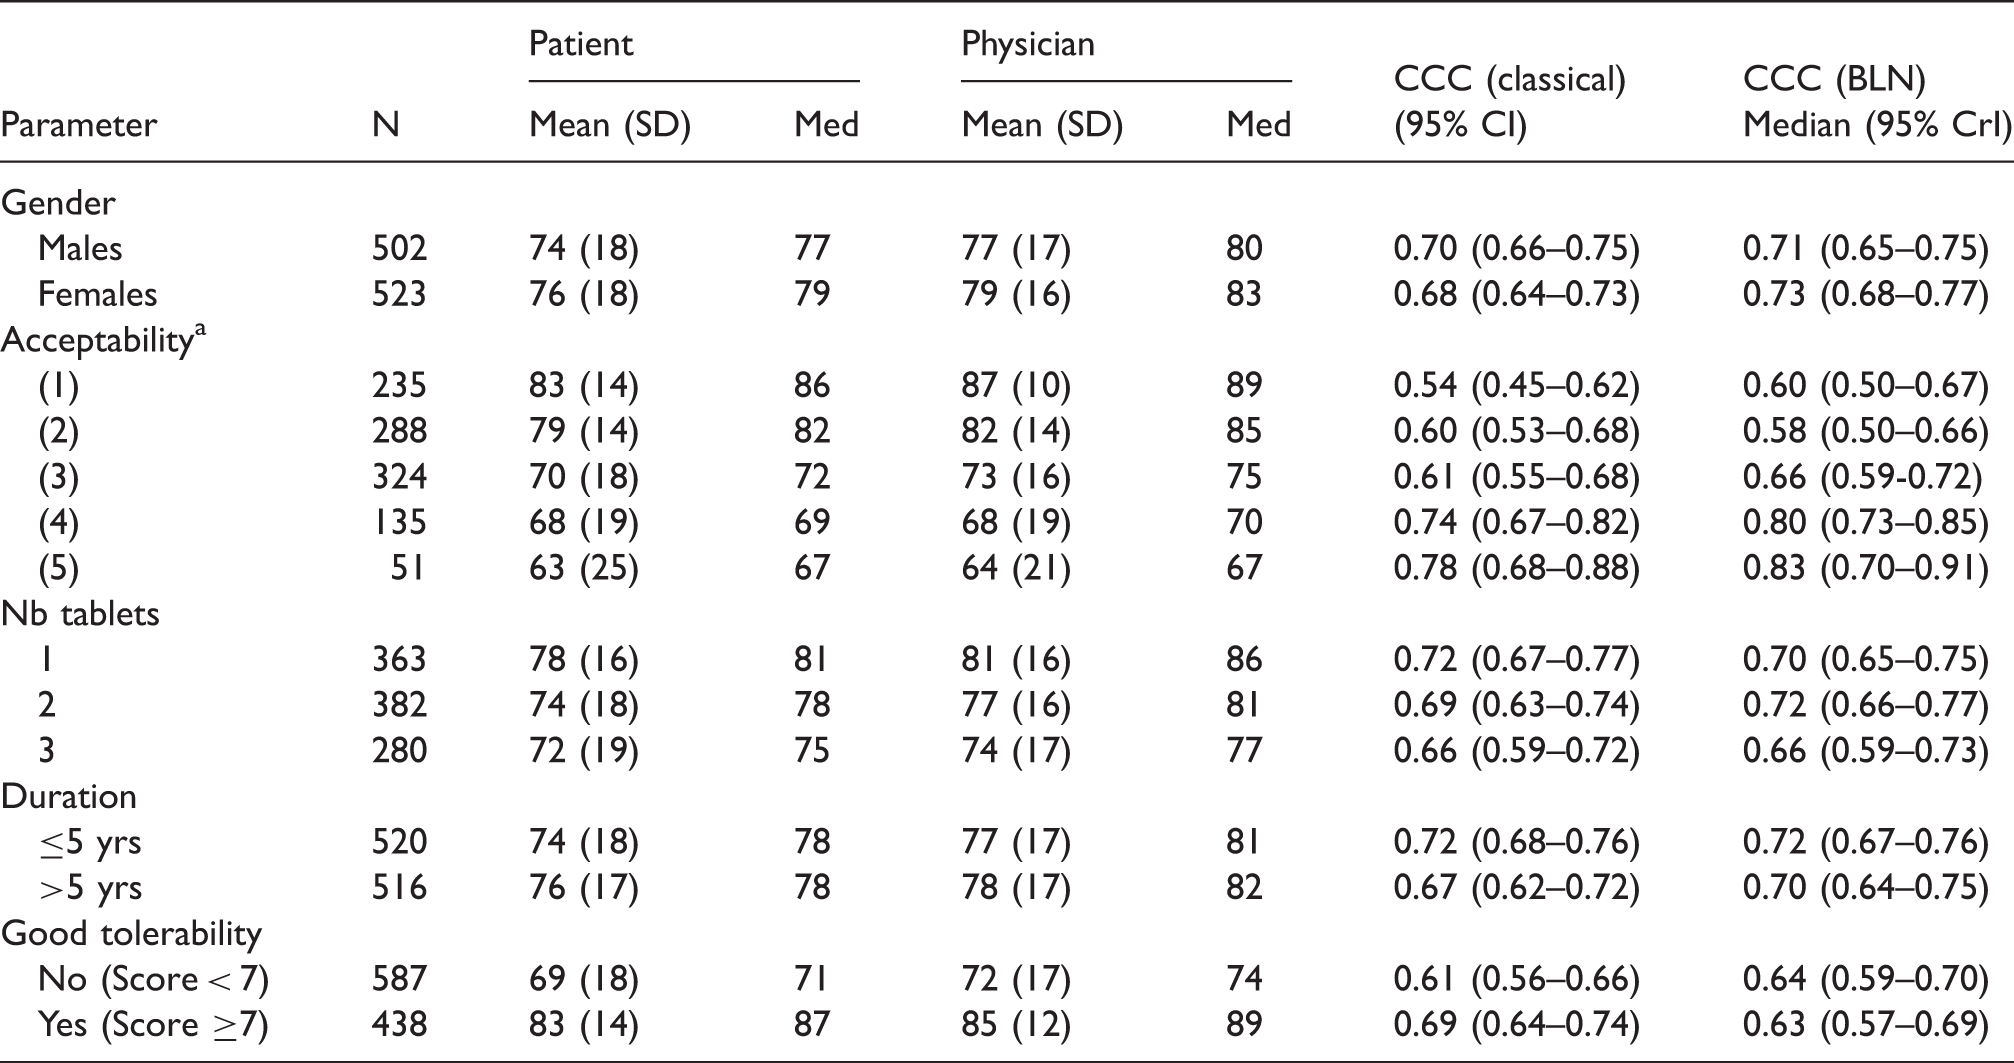
The classical CCC is given with 95% confidence interval along with the posterior median (95% equal tailed credibility interval) of the CCC obtained with the BLN model.
(1): No problem, (2): acceptable, (3): Annoying but acceptable, (4): Just acceptable, (5): Not acceptable.
COCO study – Summary measures for the posterior distribution of the parameters of the models for the means, the variances and the CCC under the bivariate logit-normal approach.
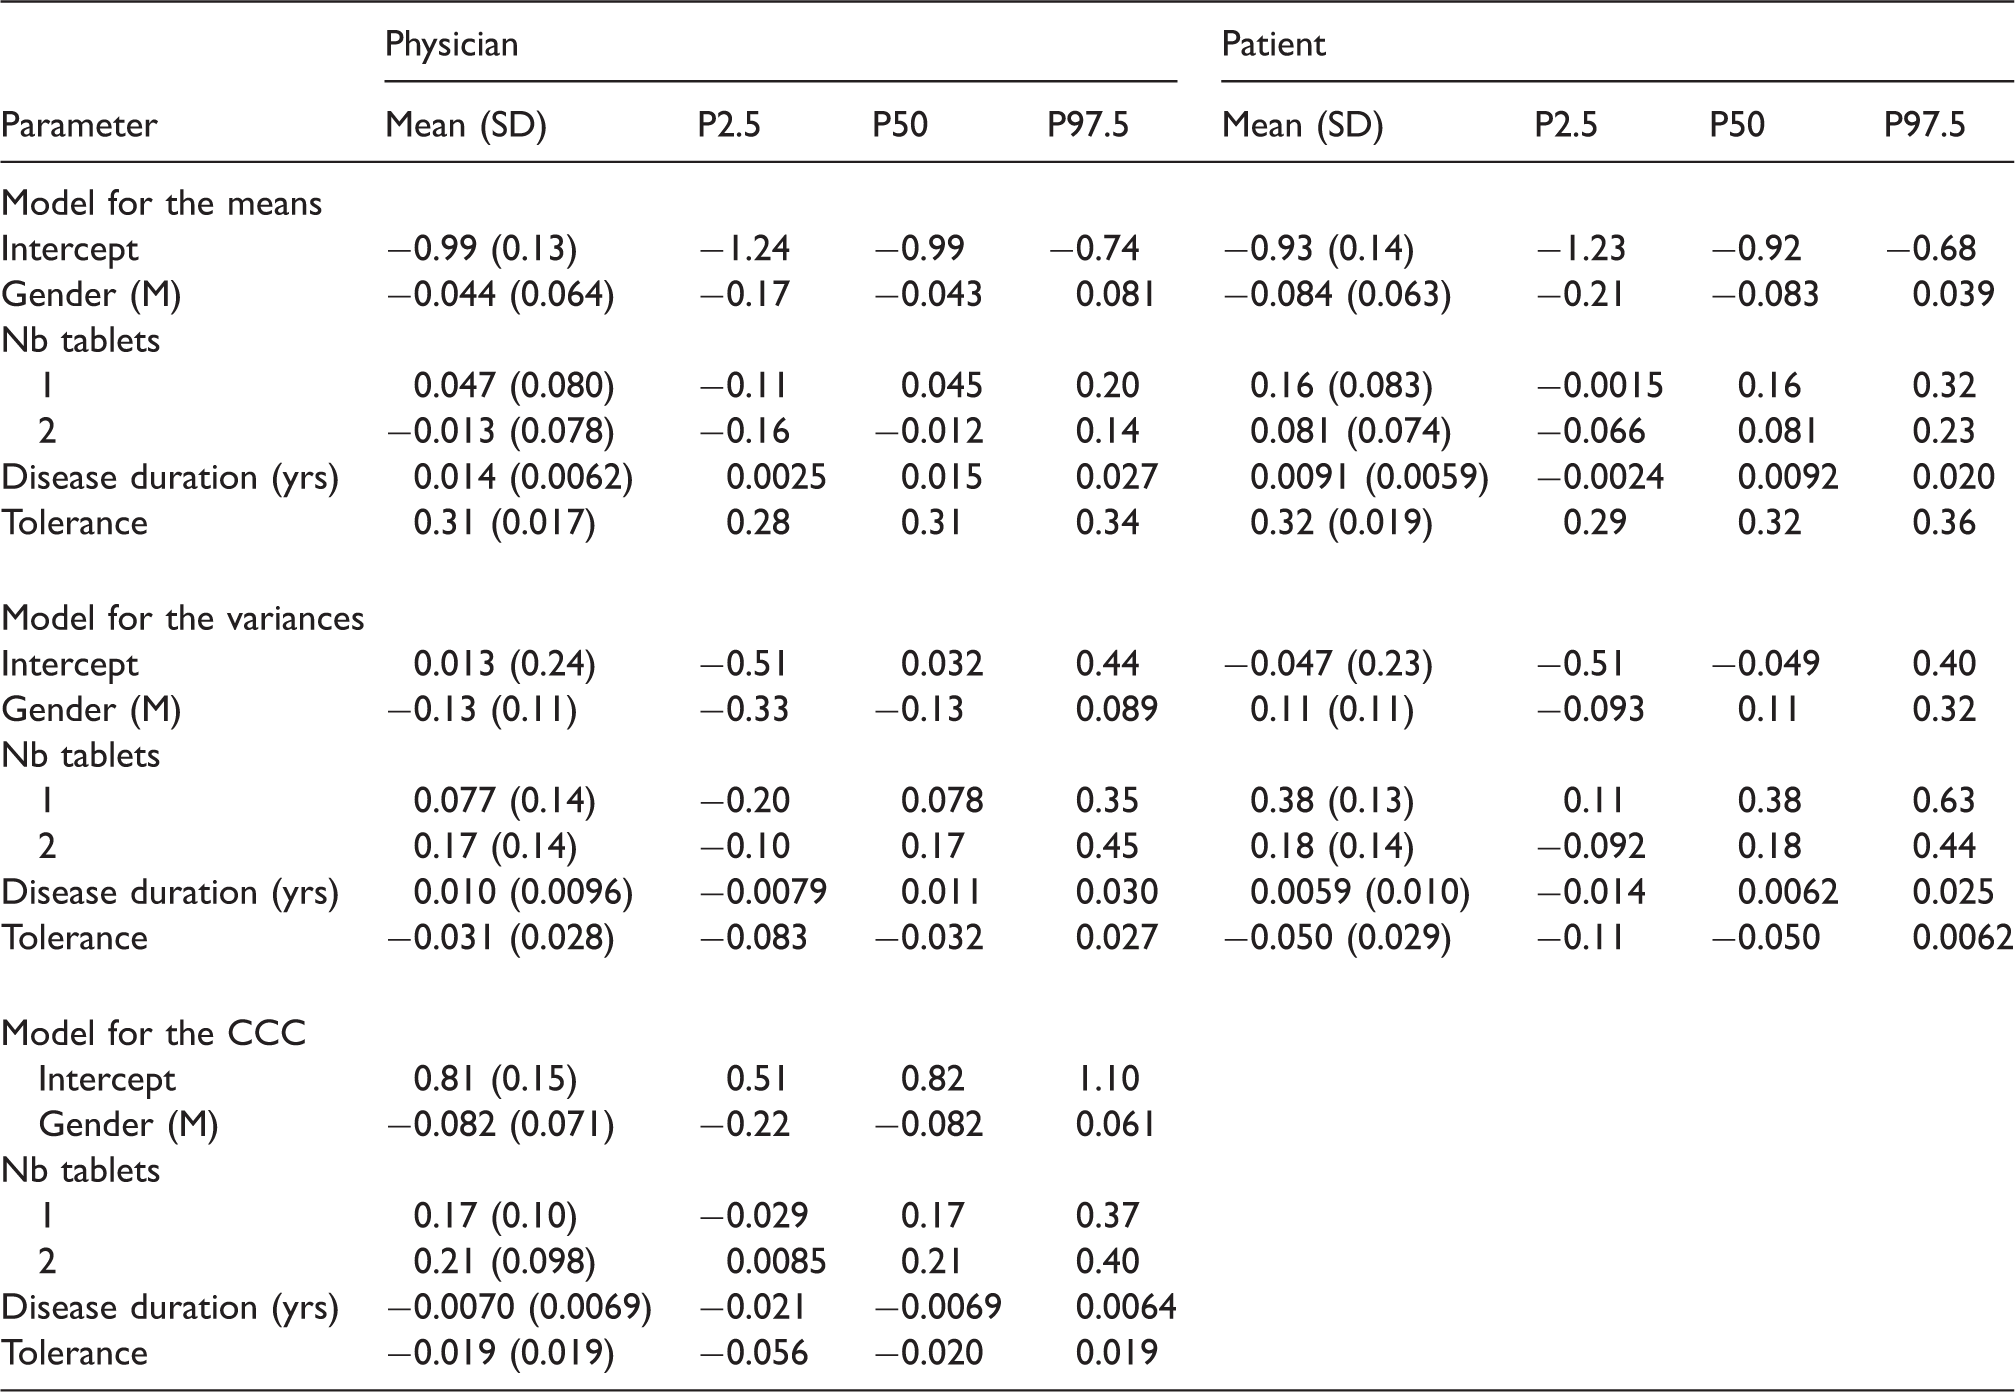
As seen in Table 6, the compliance score given by the physician was positively associated with the disease duration and the tolerance while the score given by the patient was only positively associated with the tolerance. While the variability of the physician compliance assessments was not associated to any of the covariates, the variability in the compliance scores given by the patient was higher with one tablet than with three tablets. The agreement level was higher when the treatment involved two tablets instead of three tablets and nearly higher when it involved one tablet instead of three tablets.
The univariate PPC provided a posterior predictive p-value of 0.88 for the physicians and 0.65 for the patients, indicating no evidence of lack of fit. A QQ-plot for the uniformity of the p-values obtained with the Mann–Whitney test is given in Figure 5. There was also no evidence of lack of fit from the Kolmogorov–Smirnov test for the uniformity of the p-value (p = 0.47).
COCO study. QQ-plot for the uniformity of the p-values obtained for the multivariate posterior predictive check.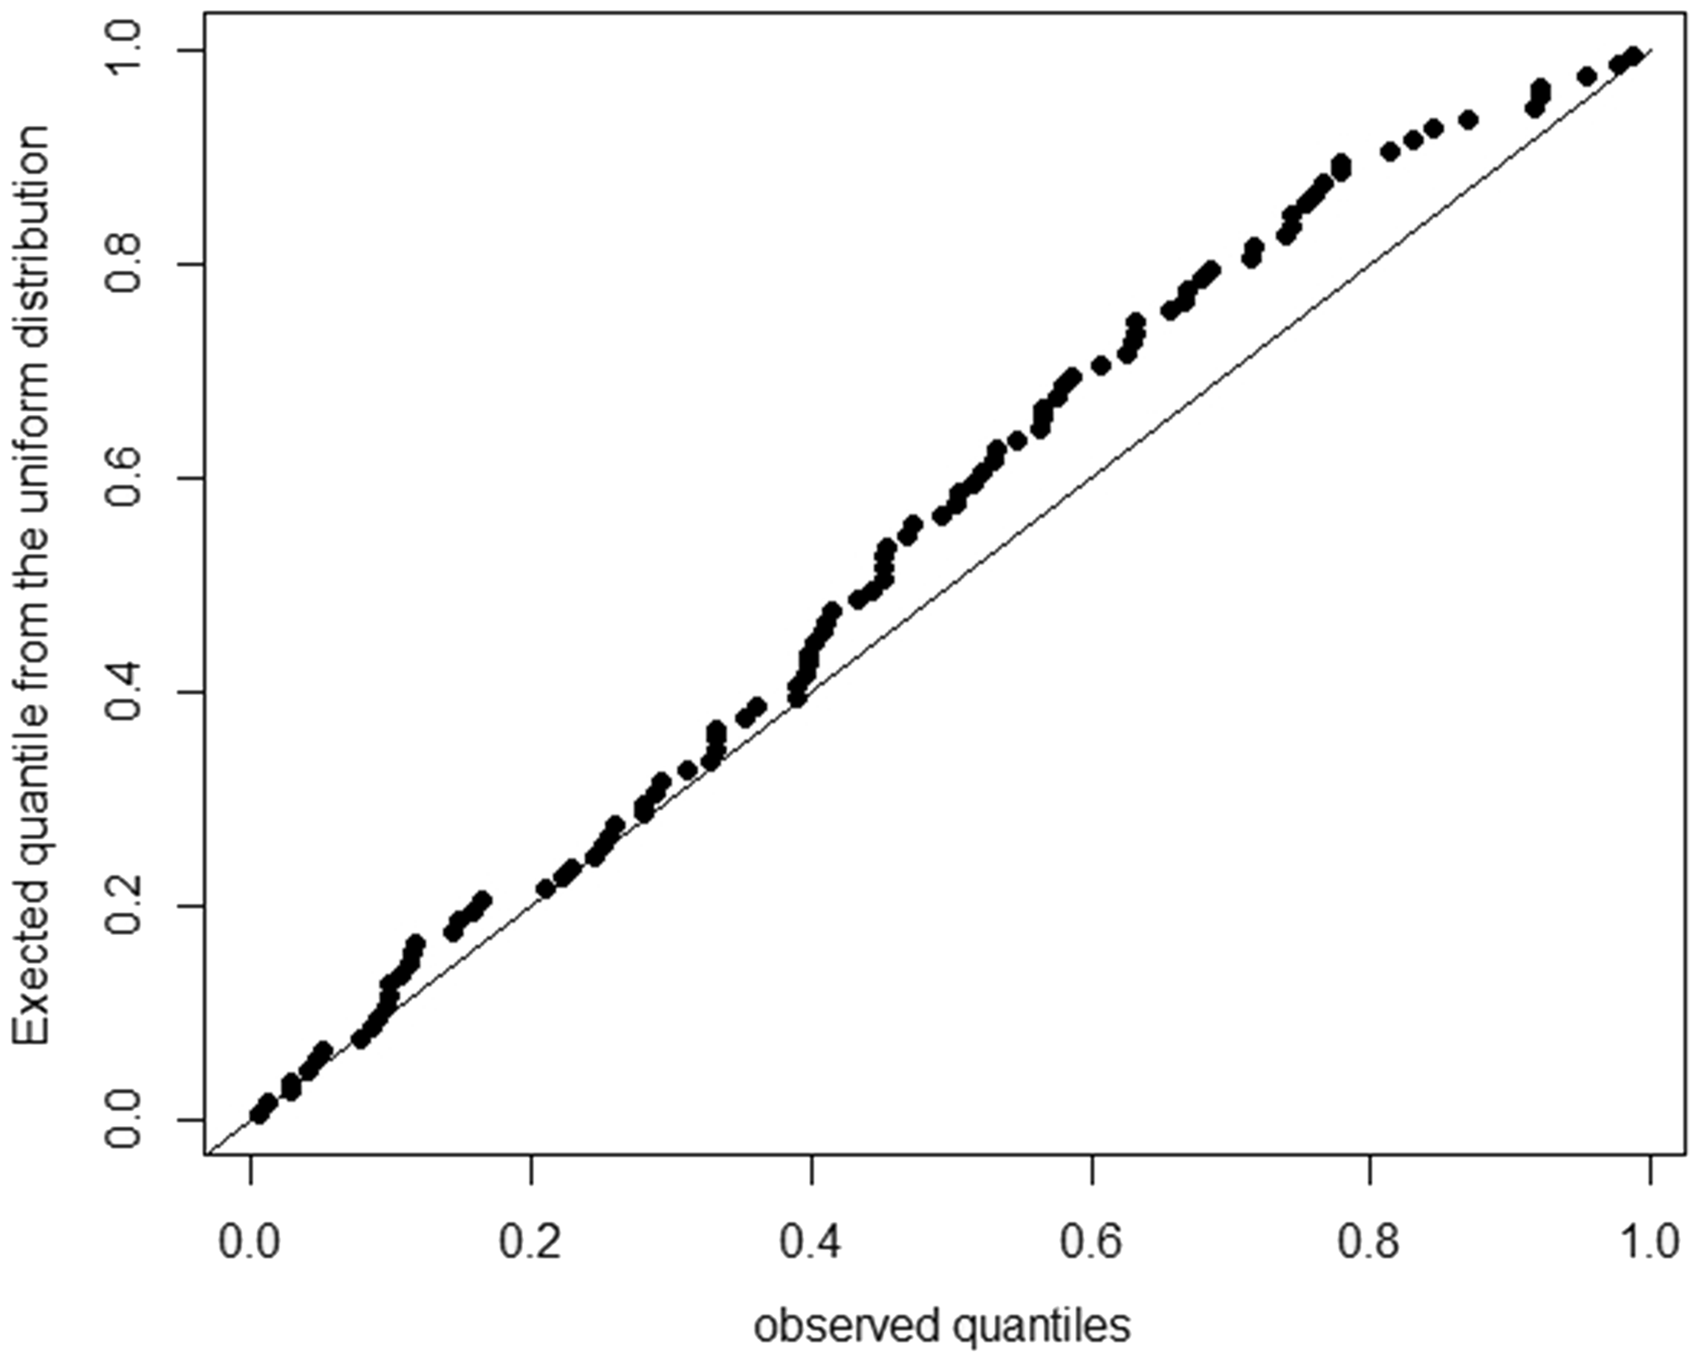
8.2 PETRA study
PETRA study – Percentage of positive joints according to the disease activity (N = 63).
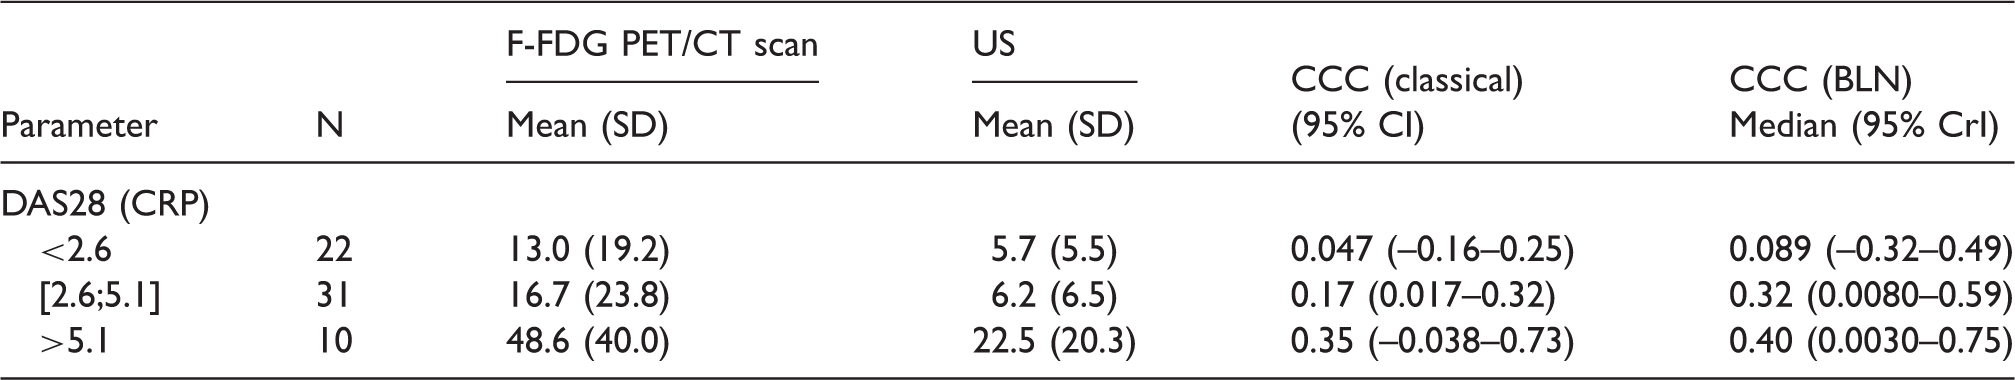
The classical CCC (95% confidence interval) and the posterior median (95% equal-tailed credibility interval) of the CCC obtained with the BLN approach.
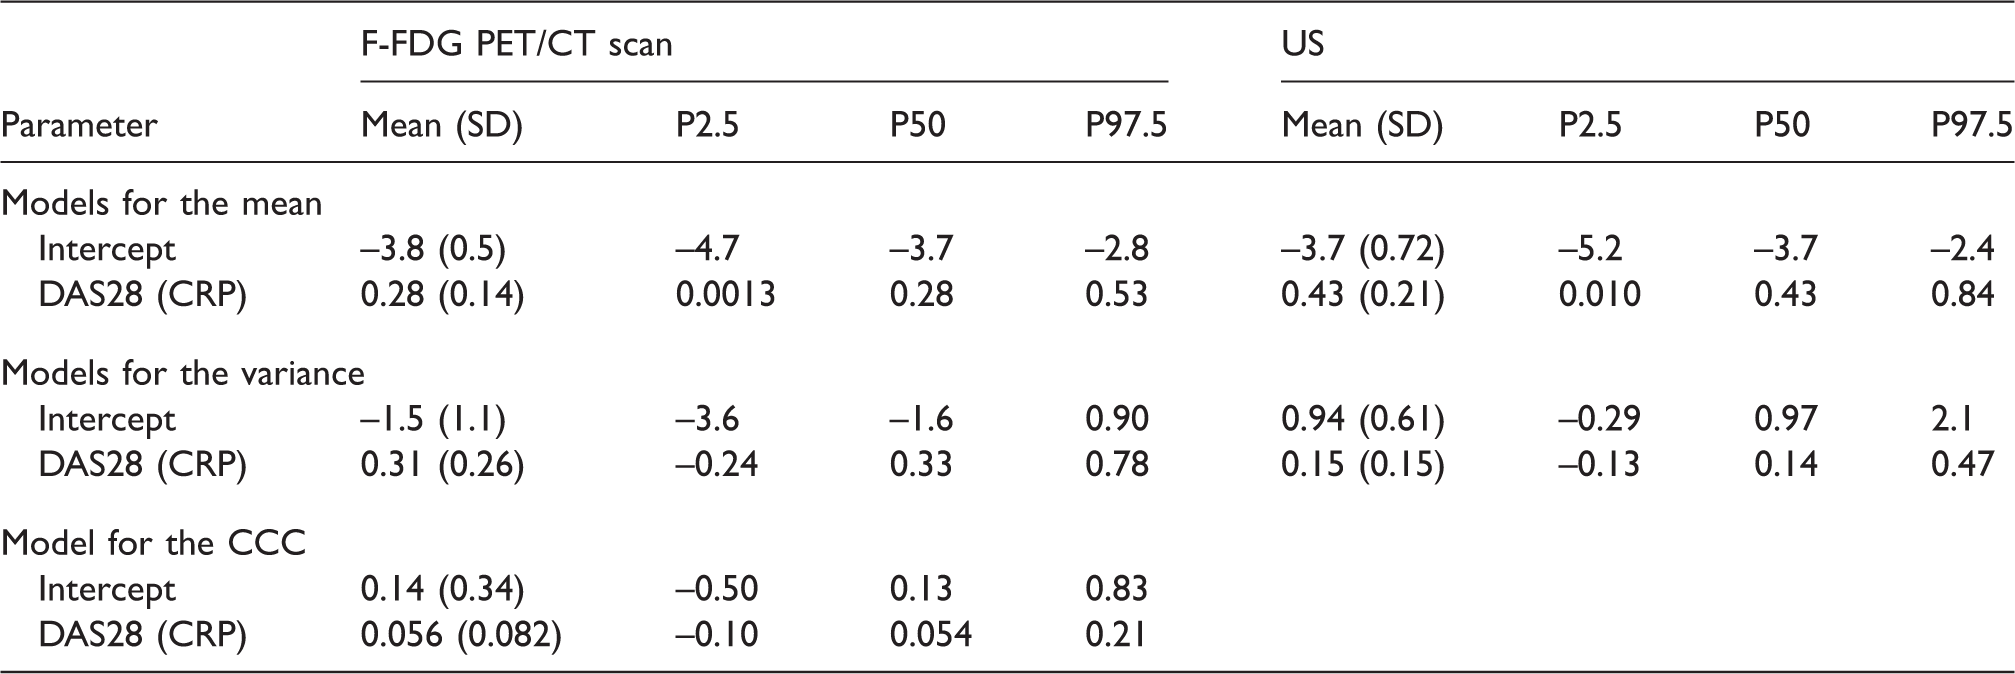
PETRA study – Summary measures for the posterior distribution of the parameters of the models for the means, the variances and the CCC under the bivariate logit-normal approach.
The overall posterior mean of the CCC is 0.474 (SD: 0.096), very close to the posterior median (0.475). Ninety percent of the differences between the F-FDG PET/CT and US percentages were less than 46.4% (17.3–75.5). Under the normality assumption, the posterior mean of the CCC is 0.327 (SD: 0.063) with a posterior median of 0.328. These agreement levels are not satisfactory and can be explained by the fact that the F-FDG PET/CT detects more positive joints in the small joints of the hands than the US.
The univariate PPC provided a posterior predictive p-value of 0.61 for the F-FDG PET CT scan and 0.76 for the US, indicating no evidence of lack of fit. A QQ-plot for the uniformity of the p-values obtained with the Mann–Whitney test is given in Figure 6. There was also no evidence of lack of fit from the Kolmogorov–Smirnov test for the uniformity of the p-value (p = 0.21).
PETRA study. QQ-plot for the uniformity of the p-values obtained for the multivariate posterior predictive check.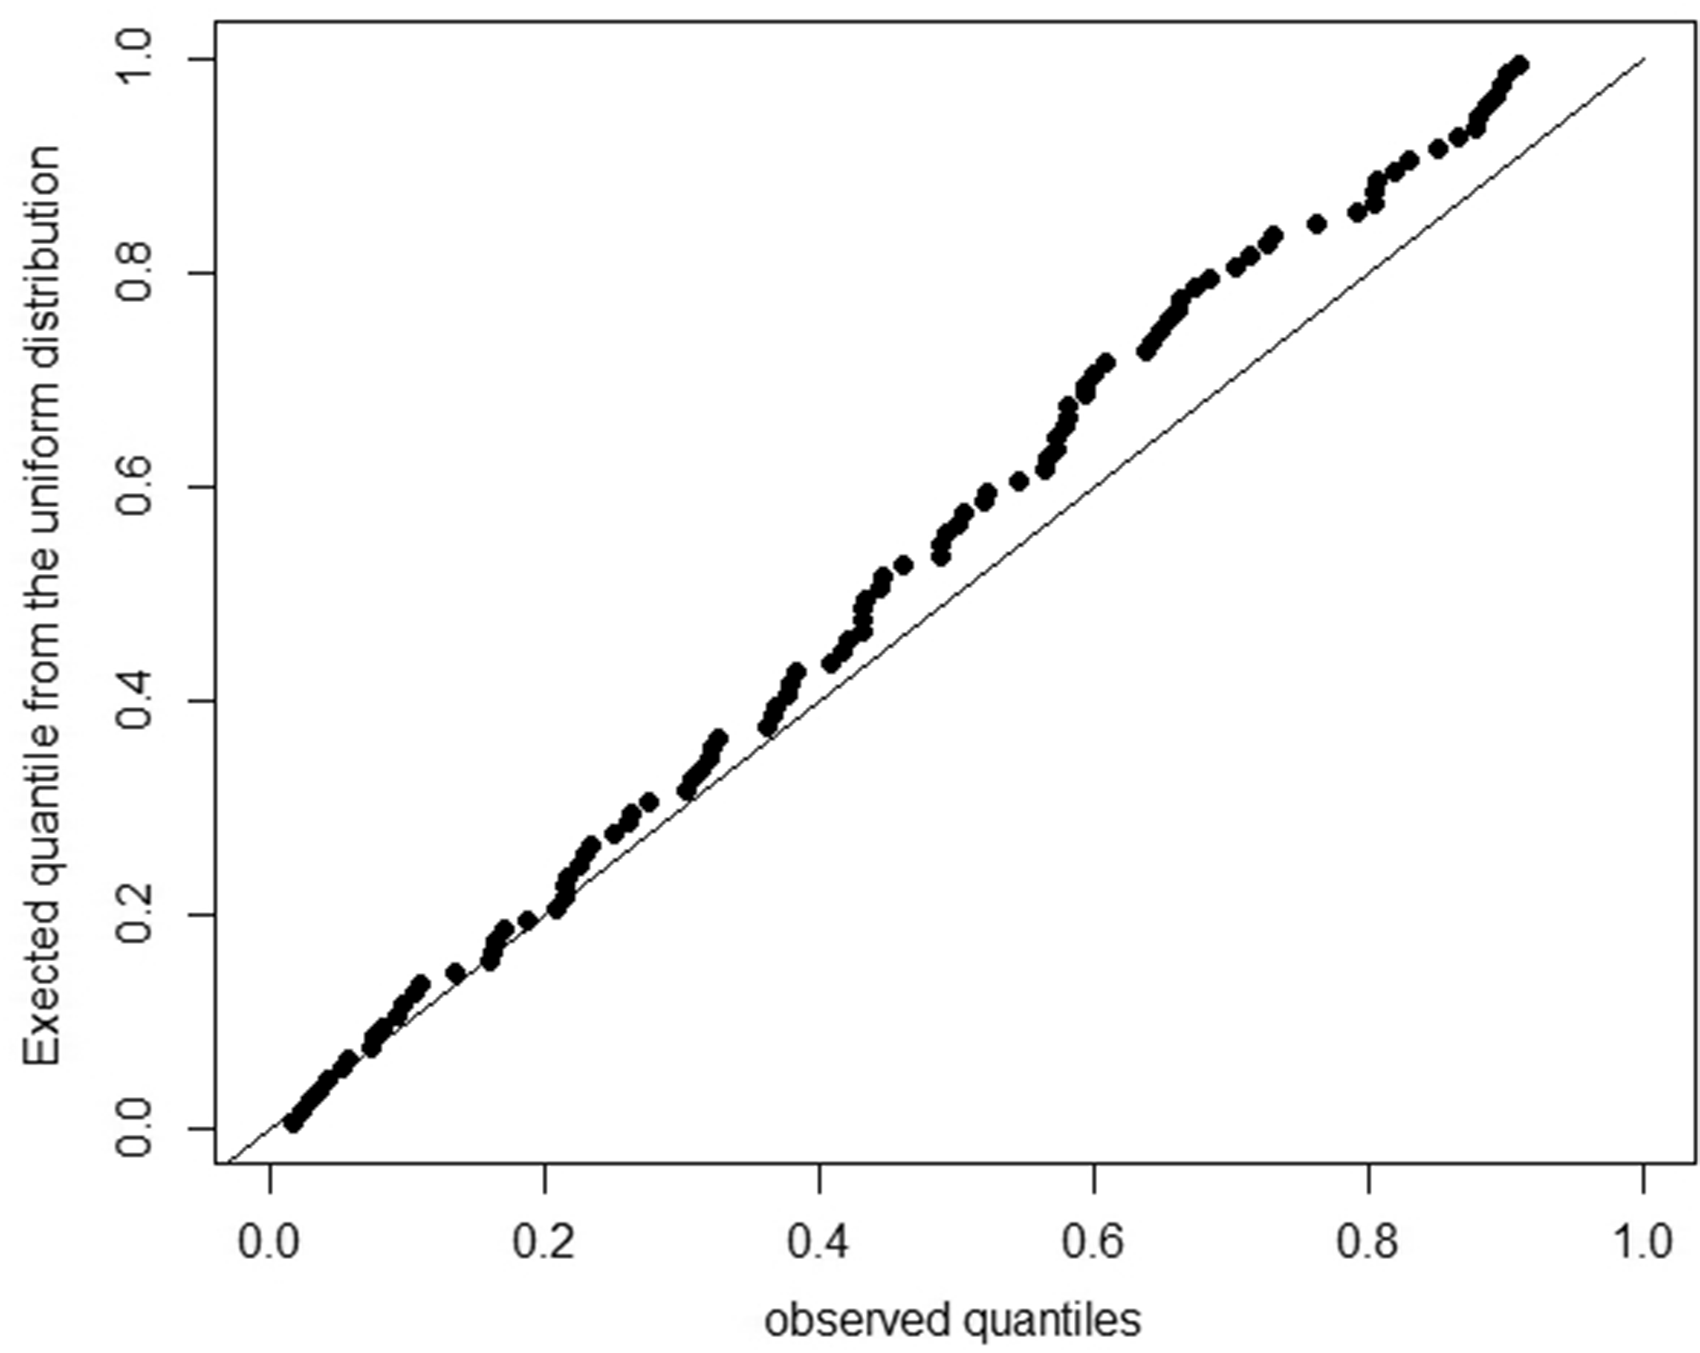
9 Discussion
Bounded scales, with visual analog scales as most famous example, are common in medical and behavioral sciences. In this paper, we developed a methodology to study the agreement (or the correlation) between two assessments made on a bounded scale in a Bayesian framework. In particular, the method is developed under two settings: (1) when the scores are coarsened versions of a latent score following a BLN distribution or (2) when the scores are binomial with the true probabilities following a BLN distribution. When the bounded score is continuous, a direct logit transformation of the scores was proposed. This method permits to directly evaluate the impact of categorical and continuous covariates on agreement levels and can be implemented in standard Bayesian softwares, like WinBUGS or JAGS. The programs and the data to analyse the COCO and the PETRA studies are available as web supplemental material. The CCC was related to covariates using Fisher Z transform link and the variance using a log-linear model. These link functions are commonly used but can be replaced by other link functions, as long as they ensure estimation of the parameters within the parameter space boundaries.
In the coarsened setting, a CCC based on the means, the variances and the correlation of the scores on a latent scale was defined. The correlation obtained on the latent scale is close to the concept of the polychoric correlation coefficient, with two distinctions. First, a bivariate LN distribution is assumed on the latent scale instead of a bivariate normal distribution. Second, the thresholds used on the bounded scale to define the coarsened scores are given a priori instead of being estimated. In the percentage case, the correlation obtained on the transformed scale is close to the Pearson correlation coefficient obtained after a logit transformation of the data. The CCC is often criticized because, like the ICC, it depends on the range of the scores observed on the scale. In particular, given the same scores difference between two scorers, the CCC can be high in heterogeneous populations and low in homogeneous populations. 5 However, in the present setting, we can expect that most often a large range of possible scores will be covered (including the boundaries) because the scale is bounded. For example, in the COCO study, the scores vary between 1 and 100 on the 100 mm VAS scale and in the PETRA study the percentages vary between 0 and 100%.
In the case of bounded coarsened scores and percentages, the simulations showed on one hand very good coverage levels for the BLN approaches. Note that an approximation to the bivariate normal cumulative probability distribution was used in the coarsened case. Inference based on the classical CCC, on the other hand, showed poorer coverage levels as the value of the CCC increases. This can be explained by (1) an asymmetric sampling distribution of the CCC near the boundaries −1 and 1, breaching the assumption of normality and rendering the use of symmetric confidence intervals less appropriate and (2) the fact that the classical CCC is based on the mean and the variance of the scores, which could not be appropriate to describe skewed distribution. Using the bivariate normal Bayesian approach with equal-tailed credibility intervals does not improve the coverage levels showing the inappropriateness of the additional bivariate normal assumption.
The LN distribution can be used to describe a variety of distributions obtained on bounded scales, from U- to J-shapes. However, the adequacy of the LN distribution should be checked, at least visually, like in Figures 1 and 2 because the LN distribution does not cover all possible patterns that can be encountered in daily practice. Alternatively to the LN distribution, one may think of using a bivariate beta distribution instead of a BLN distribution on the latent scale, especially if the distribution of the scores shows some uniform pattern. This is a topic for future research.
The total deviation index (TDIx), giving a boundary including x% of the differences between the two scorers was used for illustrative purposes. This index was originally based on the normality assumption of score differences 25 but non-parametric estimates were developed. 26 This index completes the information given by the CCC. 25 Modeling this index directly according to a set of covariates should be possible 25 and could be a topic for future research.
In the COCO study, the number of tablets slightly influenced the agreement level between the physician and the patient assessment of compliance. One explanation could be that compliance is more difficult to define when the treatment complexity increases. This asks for a clear definition of compliance when conducting studies on drug efficacy, particularly if the treatment is complex. In the PETRA study, the agreement between the F-FDG PET/CT and the US scan was not satisfactory because the F-FDG PET/CT was more sensitive in the small joints of the hands. The implication of the presence of synovitis according to F-FDG PET/CT and US on the patient health should therefore be studied separately.
In conclusion, we proposed a method to directly evaluate the effect of covariates on the level of agreement on bounded scales. This could, for example, help researchers in improving the definition of concepts, as with compliance in the COCO study or help in comparing methods, like in the PETRA study. Extension of the method to multilevel data and several scorers is a topic for future research.
Footnotes
Acknowledgements
The authors are grateful to Dr. Michel Malaise and Dr. Charline Rinkin (Rheumatology Department, CHU of Liège, Liège, Belgium), for providing the PETRA data.
Declaration of conflicting interests
The author(s) declared no potential conflicts of interest with respect to the research, authorship, and/or publication of this article.
Funding
The author(s) disclosed receipt of the following financial support for the research, authorship, and/or publication of this article: This research is part of project 451-13-002 funded by the Netherlands Organisation for Scientific Research.
Supplemental material
Supplemental material is available for this article online.
Appendix 1
References
Supplementary Material
Please find the following supplemental material available below.
For Open Access articles published under a Creative Commons License, all supplemental material carries the same license as the article it is associated with.
For non-Open Access articles published, all supplemental material carries a non-exclusive license, and permission requests for re-use of supplemental material or any part of supplemental material shall be sent directly to the copyright owner as specified in the copyright notice associated with the article.