
Abstract
The concordance index is often used to measure how well a biomarker predicts the time to an event. Estimators of the concordance index for predictors of right-censored data are reviewed, including those based on censored pairs, inverse probability weighting and a proportional-hazards model. Predictive and prognostic biomarkers often lose strength with time, and in this case the aforementioned statistics depend on the length of follow up. A semi-parametric estimator of the concordance index is developed that accommodates converging hazards through a single parameter in a Pareto model. Concordance index estimators are assessed through simulations, which demonstrate substantial bias of classical censored-pairs and proportional-hazards model estimators. Prognostic biomarkers in a cohort of women diagnosed with breast cancer are evaluated using new and classical estimators of the concordance index.
1 Introduction
After determining if predictors of censored survival data are significant, a common objective is to measure their predictive strength on a scale that is not sample dependent. A plethora of statistics have been suggested. Some have attempted to transfer the concept of R2 from linear regression to censored data.1,2 In this article we consider use of the concordance index for censored data.
The first part of the paper reviews the concordance index for predictors of censored survival data. The second part develops concordance index estimators that are valid when the strength of the predictor becomes diminished with follow up. Our proposals are compared with classical methods using computer simulations and a breast cancer prognostic biomarker example.
2 Concordance index
The concordance index was initially developed to estimate the degree to which a randomly chosen observation from one distribution was larger than one chosen independently from another distribution.
3
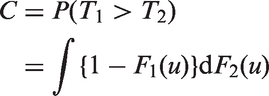
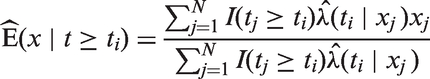
When T1 and T2 are continuous independent random variables with cumulative distribution functions F1 and F2 the concordance index is

For a one-parameter family {TZ} of random variables indexed by real number Z from distribution {FZ}, a concordance index that quantifies the degree of association between TZ and Z is defined as

CZ and C are not the same when Z is a two-point distribution, but they are linearly related. Consider where Z = 1, 2 (e.g. respectively cases and controls, or treated and untreated) and P(Z = 1) = P(Z = 2) = 0.5. Then
In the rest of the paper we focus on estimators of C and CZ for right-censored data.
3 Estimator review
3.1 Censored-pairs estimators
The concordance indices (1) and (2) have been extended to censored data by ignoring pairs when the smaller survival time is censored and using a normalising constant to account for these uninformative pairs.10,11 While such statistics can be useful for comparing different models on the same data set, Efron
12
noted that Gehan’s approach
10
was dependent on the censoring distribution, and so was not not a universal measure of P(T1 > T2). Others have noted that Harrell’s approach
11
likewise depends on the censoring distribution.
13
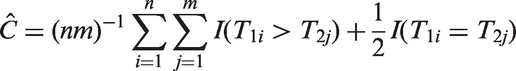
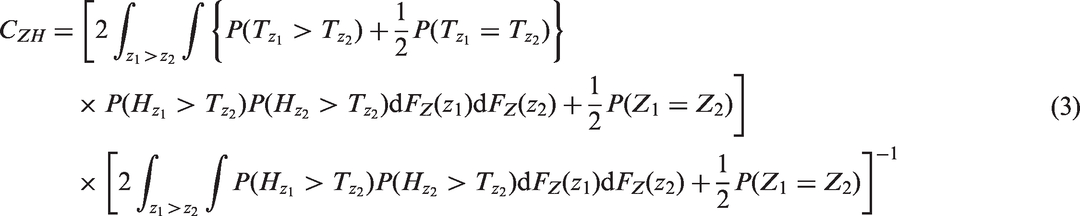
If the censoring random variable HZ is conditionally independent of TZ given Z, so that the observed survival function is (1−FTZ)(1−FHZ), then from equation (2), the censored-pairs concordance index is given by
3.2 Efron’s estimator of C
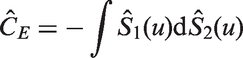

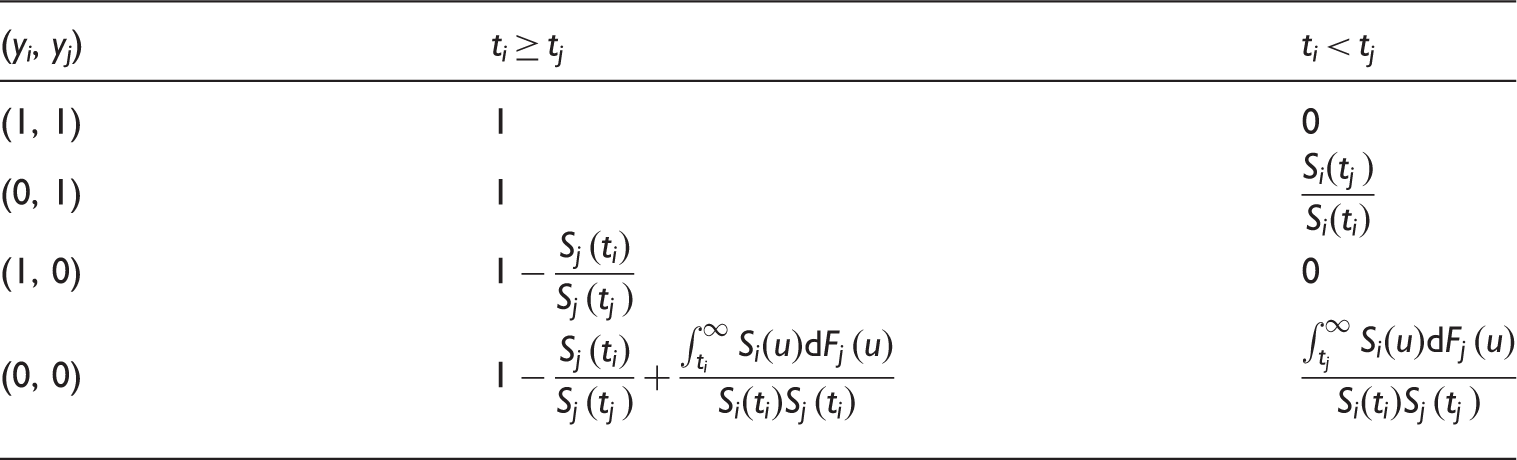
Values of Efron’s Q(ti, tj, yi, yj) for the concordance statistic. Note that for the two-sample estimator of C the 1 and 2 subscripts have been dropped, so that for example ti represents t1 i and tj is t2 j , similarly Si is S1 etc. This notation is used so that the table generalises to estimators of CZ.
3.3 Uno’s estimator of CZ
Uno and colleagues
13
developed a censored-pairs estimator of the concordance index (2) based on inverse probability weighting. Their solution uses a Kaplan–Meier estimate of the censoring distribution SH, treating it as independent of Z and TZ, and re-weights the censored-pairs contribution when ti > tj to be
However, the resulting estimator is only completely independent of the censoring distribution if, as above for the Efron estimator, the maximal follow up for all patients is to a time τ such that the marginal survival distribution S(τ) = P(T > τ) = 0. If not, then the censored-pairs approach will converge to a quantity greater than CZ. Informally, this is because the individuals with high Z have the event first whether or not hazards also converge with time. More formally, this may be seen by re-expressing CZ as


3.4 Proportional-hazards model
A common approach is to estimate linear predictors of outcomes with censored event times using a proportional-hazards model. Here an estimator of the concordance index that does not depend on the censoring distribution or follow up was achieved by Gönen and Heller.
16
If TZ has hazard of form 


4 New estimators
4.1 Motivation
The methods reviewed above are not universal when the predictor loses strength with time, and may depend on the length of follow up. In particular, formulas (8) and (9) depend implicitly on the validity of the proportional-hazard assumption. Further developments would be useful because hazards are often observed to converge, so that the effect of a predictive factor diminishes as follow-up time increases. This issue is pervasive in applications 5 . For example, in breast cancer epidemiology, many prognostic factors are based on characteristics of the tumour that lose relevance once an individual has survived a period of time 17 . We next propose modifications to the Efron and the proportional-hazard estimators, before introducing a more parsimonious approach.
4.2 Modified two-sample estimator
Recall that when there is censoring due to incomplete follow up, Efron’s estimator may be very unstable. The following modification of Table 1 solves this problem by accounting for when the last time in each group is censored.
Denote 

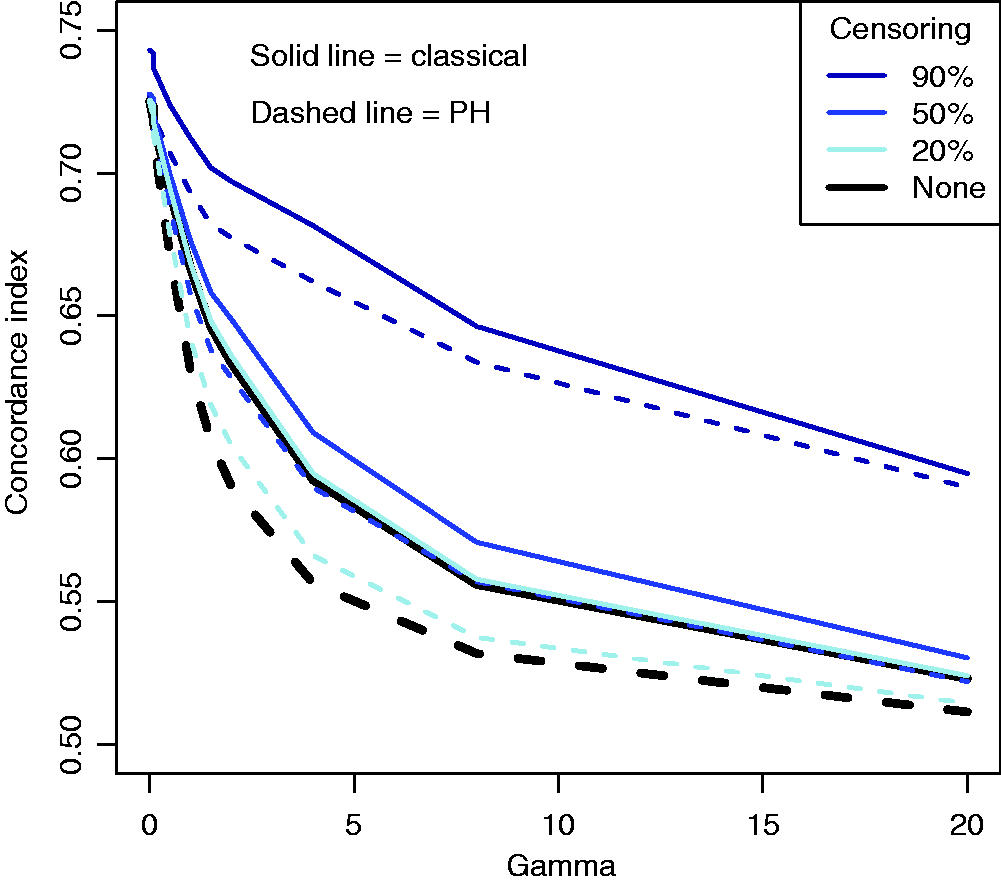
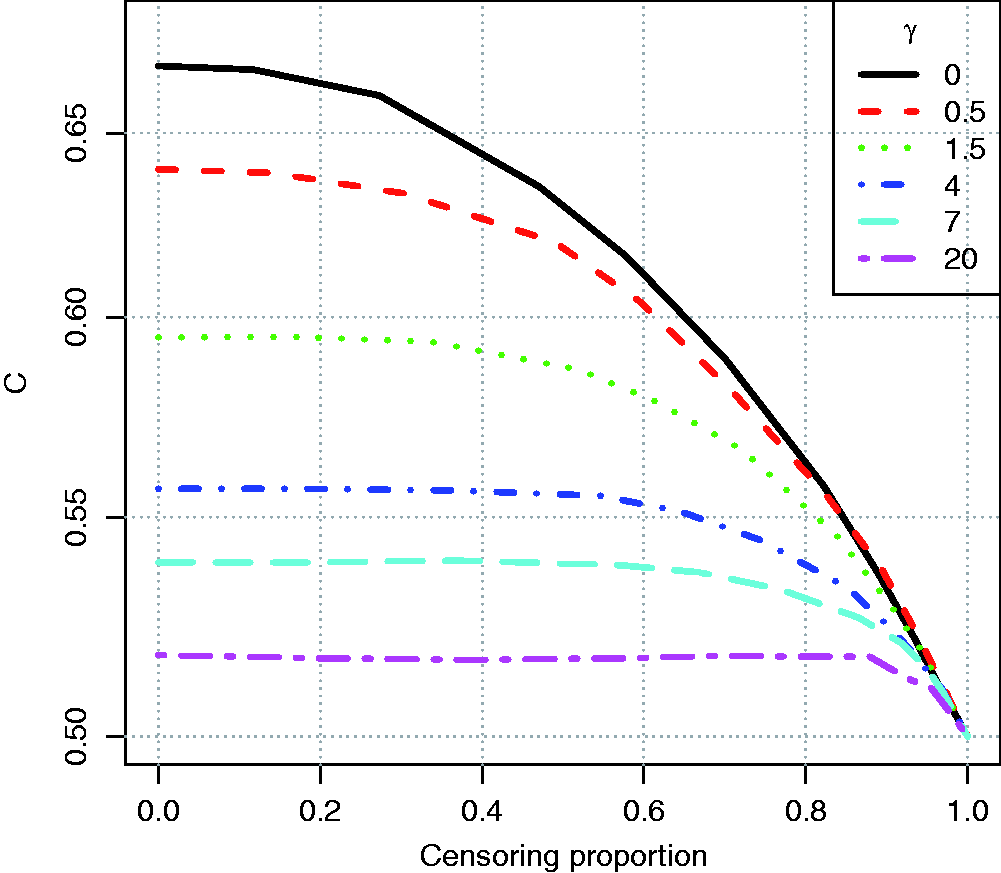
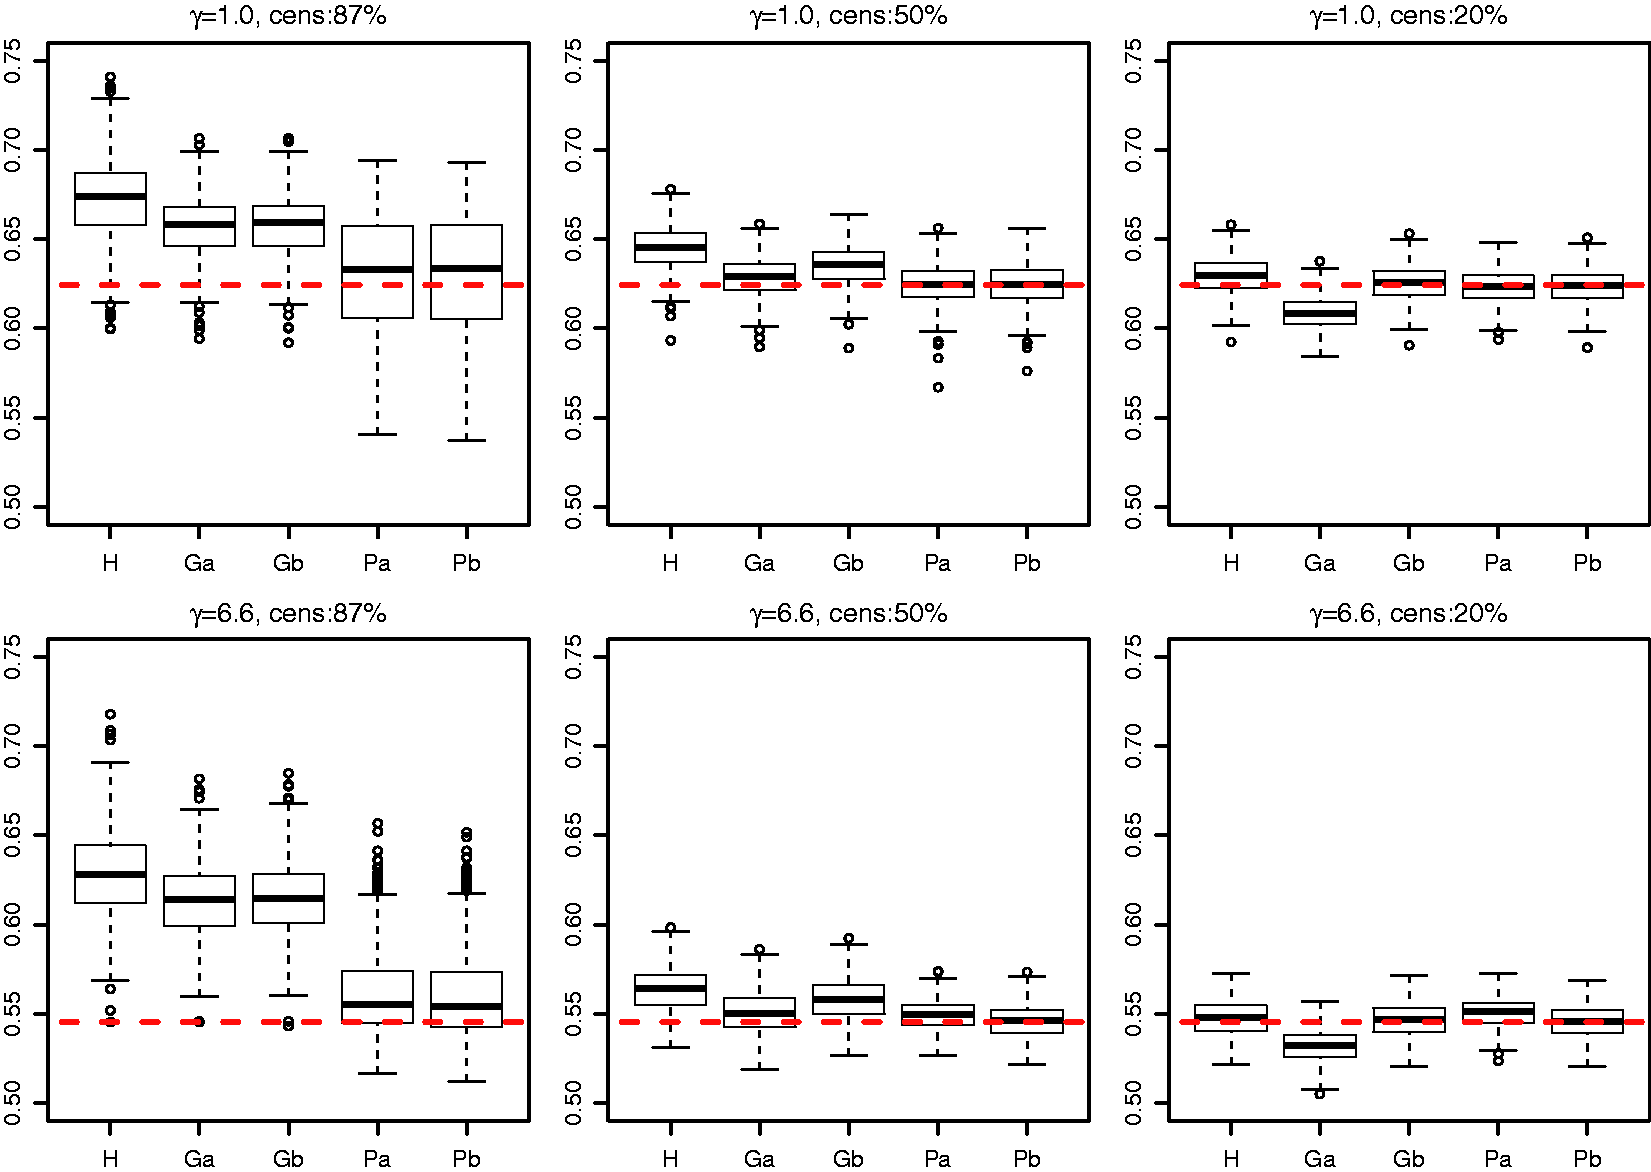
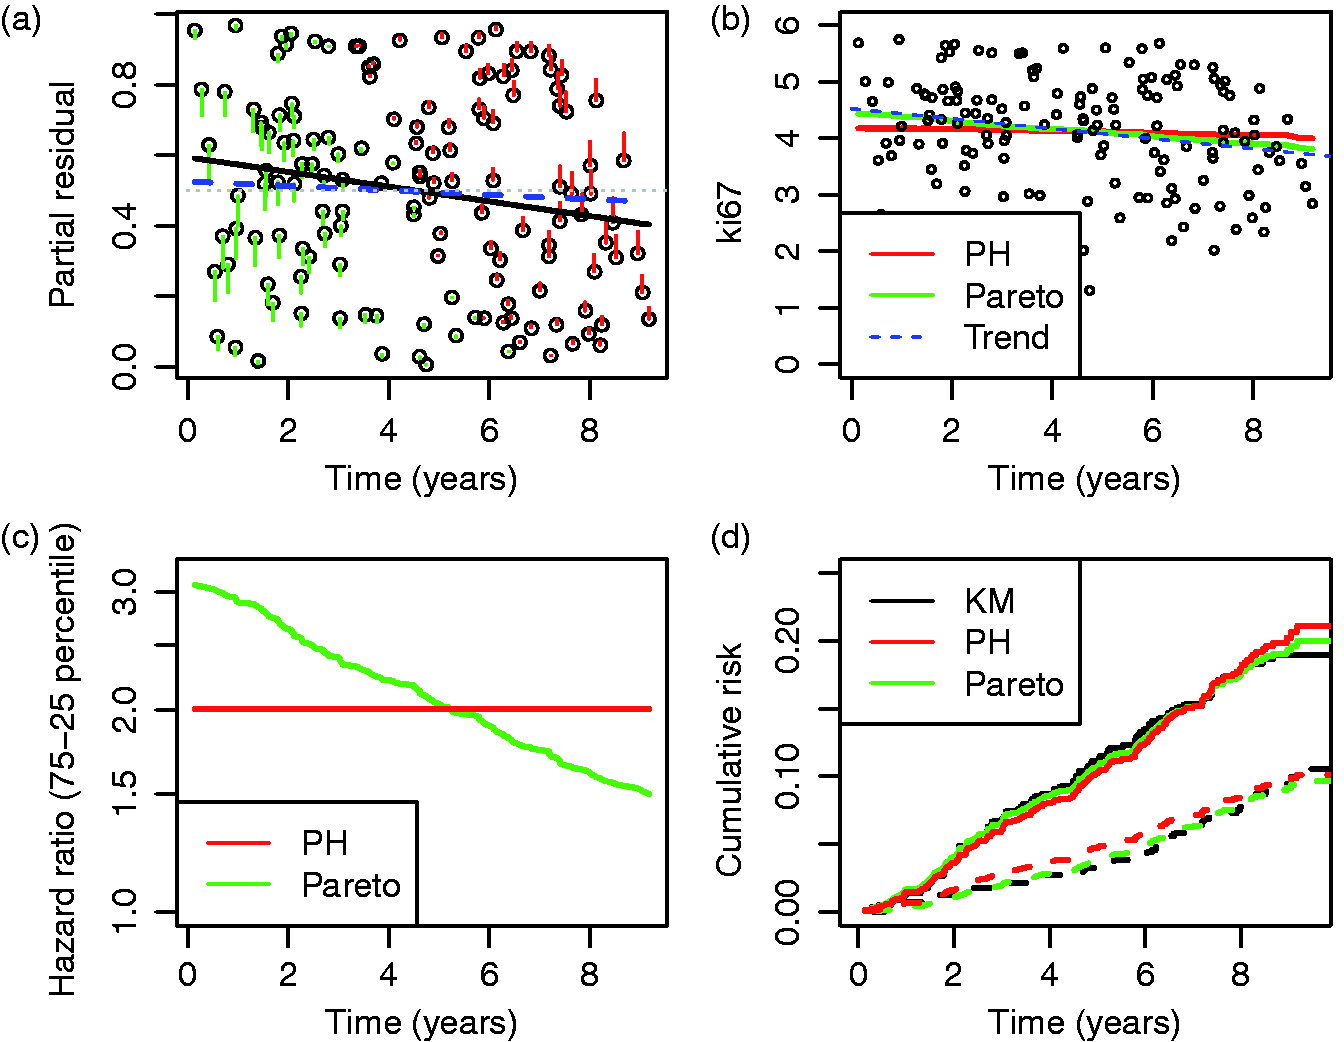
As the original Efron estimator, the modified estimator is not a universal measure when censoring is due to incomplete follow up because it depends on tmax, but it is more stable than the Efron estimator because it does not depend on which group has the longest surviving censored member. It is not consistent for the concordance index if Illustration of the effect of converging hazards and censoring on concordance index estimators. Solid lines (—) use the classical censored-pairs approach, and the proportional-hazards model estimator is dashed (– – –). The true concordance index for this model is when there was no censoring (— black). Illustration of the effect of censoring on the two-group concordance statistic estimator. The lines show the concordance index under a Pareto model, with the γ parameter shown in the key. Concordance index estimates from simulations and true value (– – –). H: censored-pairs estimator; Ga: proportional-hazards estimator (10); Gb: hybrid proportional-hazards estimator based on (11); Pa: Pareto estimator using model fit; Pb: hybrid Pareto estimator using Table 1. Pareto model fit in example. Plot (a) is Schoenfeld partial residuals from a proportional-hazards (o) and Pareto model (end of line linked to o). Least squares trend lines of the residuals are shown for the proportional-hazards (—) and Pareto models (– –); the line at 0.5 indicates good model fit (- - -). Plot (b) compares the expected Ki67 at each event from the two models and least squares trend line. Plot (c) shows the fitted hazard ratios. Plot (d) is the estimated cumulative risk for a binarised Ki67 in the data (KM, Kaplan–Meier) and the models (— above median, – – – less than or equal to median). Plot of two-sample concordance index against type I censoring time (tmax) for binarized Ki67 and HER2 from the example. Point-wise 95% confidence intervals (empirical bootstrap) are also shown.
4.3 Modified proportional-hazards model estimator
A problem with the estimator of Gönen and Heller
16
is that if there is no censoring but proportional hazards do not hold, then the estimator will not agree with the classical approach. A partial solution to this is to modify the approach of Efron and write

One might consider allowing 
4.4 Pareto model
A parsimonious approach is to use a simple one-parameter model to account for varying degrees of convergence by introducing an unobserved additive covariate (frailty) to the proportional-hazards model, independent from other covariates, with a log-gamma distribution with mean one and variance γ.
18
This leads to a transformation model based on the Pareto distribution, so that if the baseline hazard and cumulative hazard are given by λ0(t) and Λ0(t) respectively, then an individual with covariate 

Technical aspects of estimation and inference are considered in the appendix.
4.4.1 Concordance index
Computation of the Pareto concordance index involves a formula with γ, the {Z} and the baseline cumulative hazard function 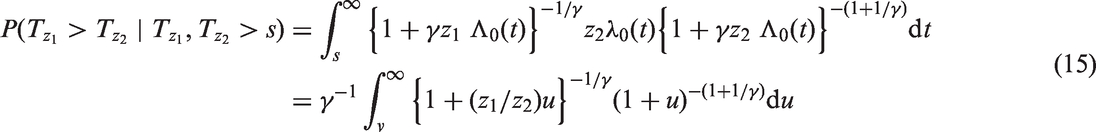
4.4.2 Goodness-of-fit
We lastly consider model goodness-of-fit, partly because the Pareto concordance index is not needed when a proportional-hazards assumption is appropriate. One method is an asymptotic score test for when a Pareto model is taken as the alternative hypothesis to proportional hazards.
19
Another approach in this line is to apply a likelihood-ratio test for γ = 0,
20
with adjustment for model-boundary testing.
21
Schoenfeld residuals
22
are sometimes used, and in the general setting are defined for all 

5 Simulations
5.1 Bias
A simulation was used to demonstrate issues with existing methodology when there are converging hazards. Twenty-thousand individuals were simulated with survival times from a Pareto distribution; the rate for an individual was the exponent of a random normal covariate with unit mean and variance multiplied by a frailty sampled from a gamma distribution with mean one and variance γ. Type I censoring was considered, so that events occurred before a maximal follow-up time based on the expected proportion censored. For exposition we show 90%, 50% and 20% censoring. For ∼10-year follow up, heavy censoring might correspond to survival such as for distant recurrence in women diagnosed with estrogen-receptor positive breast cancer; 25 mid-range censoring (∼50%) might be seen for survival following disease such as an acute myocardial infarction event; 7 light censoring occurs when survival rates are low, for example, for survival following complete resection of non-small-cell lung cancer. 5 In all simulation scenarios there is no difference between the censored-pairs estimators of Harrell or Uno because everyone is censored at the same time. Concordance indices using a proportional-hazards model and the censored-pairs statistic were calculated and compared with the true index, obtained using a simulation without censoring.
The results in Figure 1 show that for this model the proportional-hazard estimate was conservative when there was no censoring, but had positive bias when censoring was more than about 50%. The classical estimator substantially overestimated the concordance index when censoring was 50% or more; this bias was more pronounced for heavy censoring as the frailty variance γ increased.
A second simulation was used to demonstrate the dependence of the two-sample estimator on follow up. Ten-thousand individuals were simulated in two groups, with survival time from an exponential distribution with rate one or two, compounded with a gamma frailty with variance γ, which was chosen to show the effect of a change from constant hazards (γ = 0) to when they converge very quickly (γ = 20). Censoring was generated by allowing individuals to be enrolled into a study at different times according to a uniform distribution between [0.00, 0.05], and then they were censored at a maximum follow-up time. The results in Figure 2 show that the two-sample statistic was conservatively biased when there was heavy censoring. Considering the chart from right (heavy censoring due to censoring) to left (no censoring), one can see that the concordance index estimate increased with more follow up (later censoring) until the covariate had ceased to influence survival due to converging hazards. The plot shows that the statistic is actually better when there are converging hazards, since it will converge to the true value with less follow up.
5.2 Comparison of estimators
A final simulation was used to compare estimators of CZ. Survival times were from a Pareto distribution that was the exponent of a standard random normal covariate (x) multiplied by 0.7 (i.e. z = exp(βx) with β = 0.7) and compounded by a frailty sampled from a gamma distribution with mean one and variance γ. Two choices of γ were considered (1.0 and 6.6) and three levels of censoring (follow up to time with expected censoring percentage 87%, 50% and 20%). The sample size was 1125 and 500 replications were used. The Pareto model was fitted by maximizing the profile likelihood (see Appendix).
The reason for choosing β = 0.7, γ = 6.6, 87% censoring and n = 1125 is that these correspond to an example in the next section (Table 3(b), Ki67). We also considered γ = 1 in order to assess a scenario where the proportional-hazards assumption is violated more slowly, and partly for theoretical interest because it corresponds to a proportional-odds model. The censoring levels were varied to help assess the estimators as more follow up is accrued.
Simulation estimation results for two scenarios of γ.
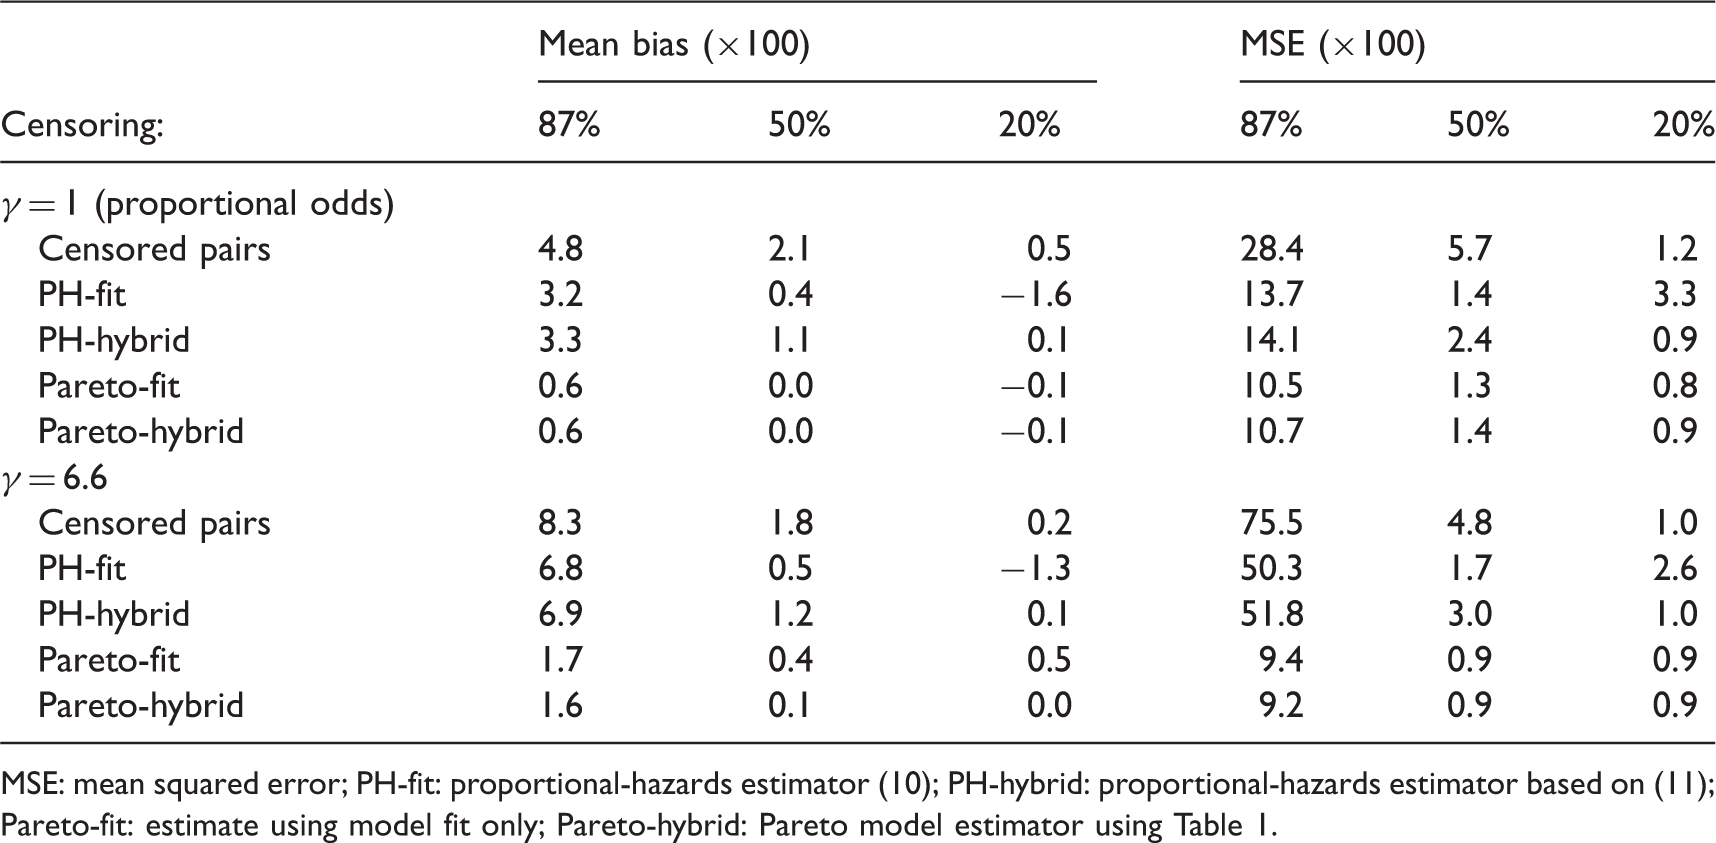
MSE: mean squared error; PH-fit: proportional-hazards estimator (10); PH-hybrid: proportional-hazards estimator based on (11); Pareto-fit: estimate using model fit only; Pareto-hybrid: Pareto model estimator using Table 1.
Some differences were seen between a proportional-hazards concordance index based solely on model fit and the hybrid approach using Table 1. As expected the hybrid approach worked best for light censoring. It was worse under 50% censoring for the proportional-hazards model because it shifted the estimate towards the Harrell estimate, and the censored-pairs estimators are expected to be anti-conservative unless follow up is to a point where survival is zero (c.f. Figure 1). Thus, we do not recommend the hybrid approach unless censoring is light.
6 Example
The example uses a sample of 1125 women with oestrogen-receptor positive breast cancer, of whom 145 had a distant recurrence after a median 8.5-years follow up in a clinical trial (ATAC trial, ISRCTN registration numer ISRCTN18233230). This sample from the transATAC study (approved by the South-East London Research Ethics Committee (REC ref no. 971037)) were previously used to show that some immunohistochemical (IHC) biomarkers added useful information to classical clinical prognostic factors. 25 For demonstration and insight we focus next on some of the individual biomarkers used in the IHC risk score. We do not present results from the hybrid estimators because censoring is heavy, but there was little difference because model assumptions dominate the calculations (87% of women were censored).
Table 3 shows some univariate concordance index estimates. The following points are of note. First, the two-sample estimates were different than the other form of concordance index. Second, Harrell’s and Uno’s statistics were closer to each other than the proportional-hazards and Pareto model statistics. This is likely due to the bias from follow up, as discussed earlier. Third, Pareto estimates were substantially lower than the proportional-hazards model when
Estimated univariate concordance indices and model coefficients from example.
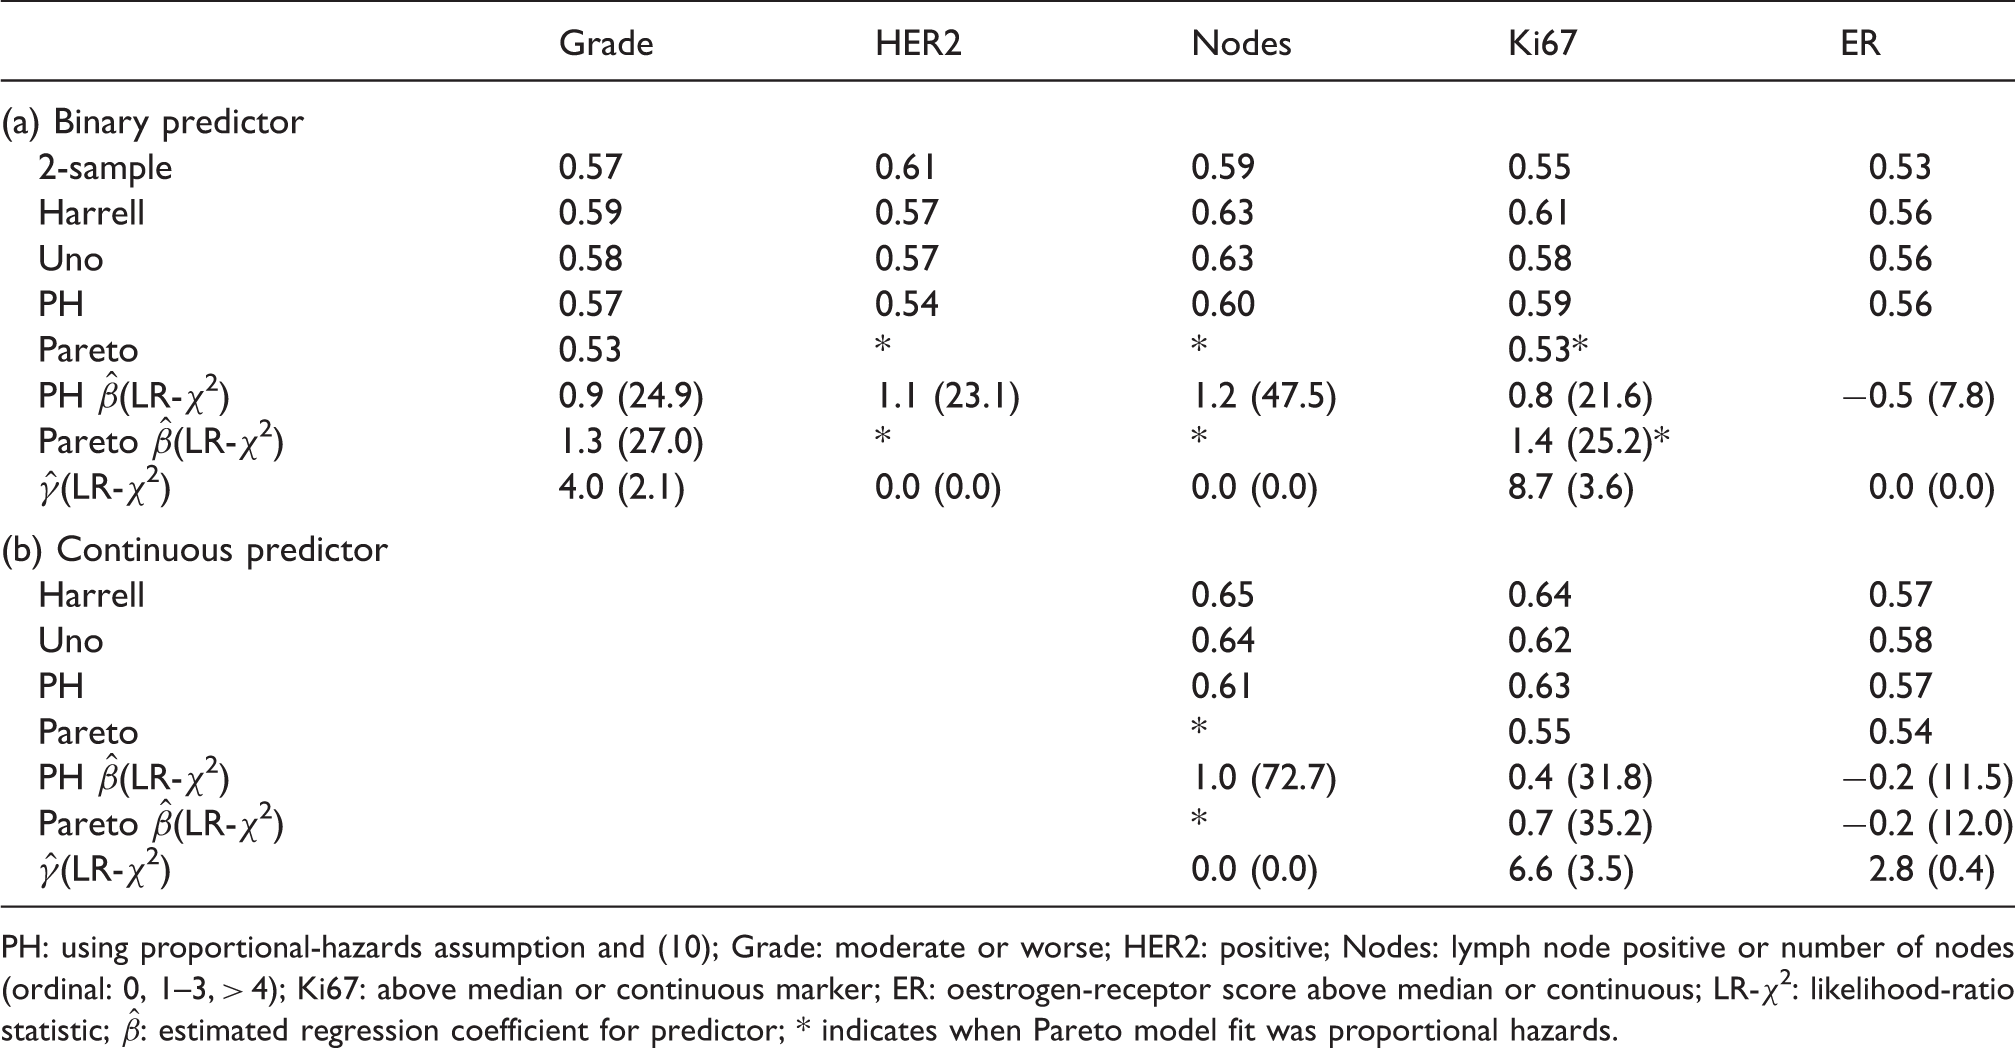
PH: using proportional-hazards assumption and (10); Grade: moderate or worse; HER2: positive; Nodes: lymph node positive or number of nodes (ordinal: 0, 1–3, > 4); Ki67: above median or continuous marker; ER: oestrogen-receptor score above median or continuous; LR-χ2: likelihood-ratio statistic;
Number of events in each year, split by Ki67 median (low/high).
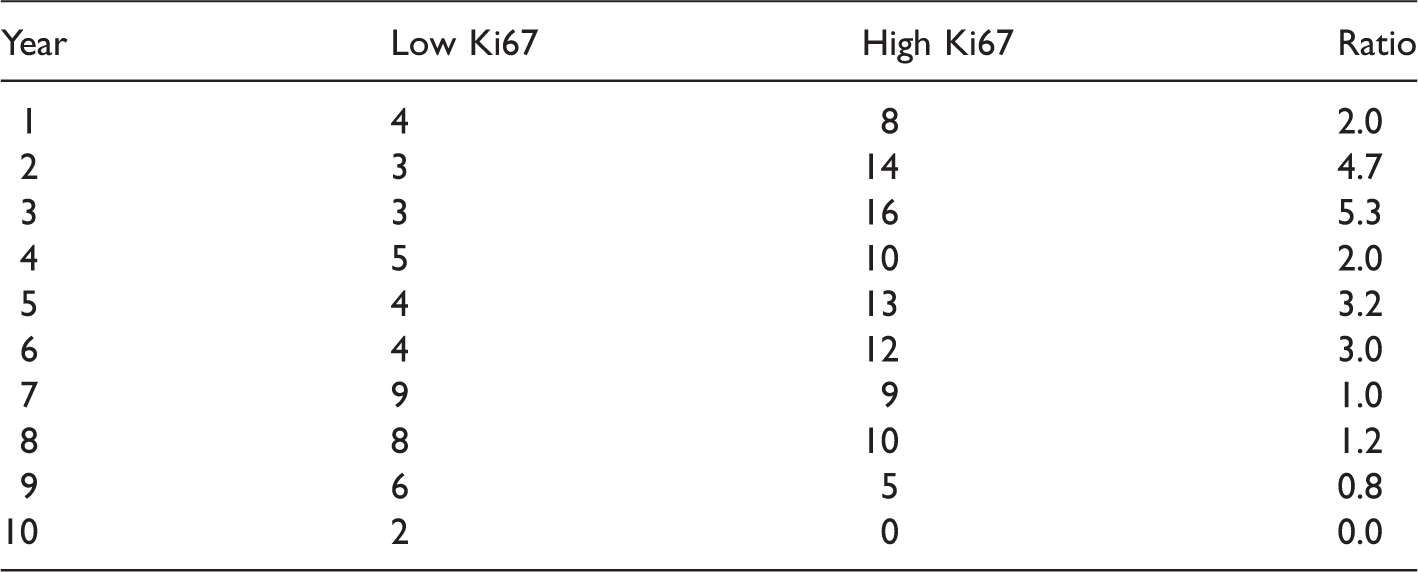
A goodness-of-fit test of the Pareto model is suggested by Figure 4(a), where most of the change in partial residuals between the proportional-hazards and Pareto model were in the first and last three years. Applying a two-sample Kolmogorov–Smirnov test of equality in distribution between the residuals in years ≤ 3 vs > 6 for the proportional-hazards model was rejected (D = 0.28, two-sided P = 0.03). The trend line shows that the Pareto model fitted somewhat better, and the same test did not reject a fit of the Pareto model (D = 0.22, P = 0.17). Thus the data showed some evidence to support the Pareto model fit, which was certainly better than proportional hazards, and the lower concordance index estimate than from a proportional-hazards model or the other approaches.
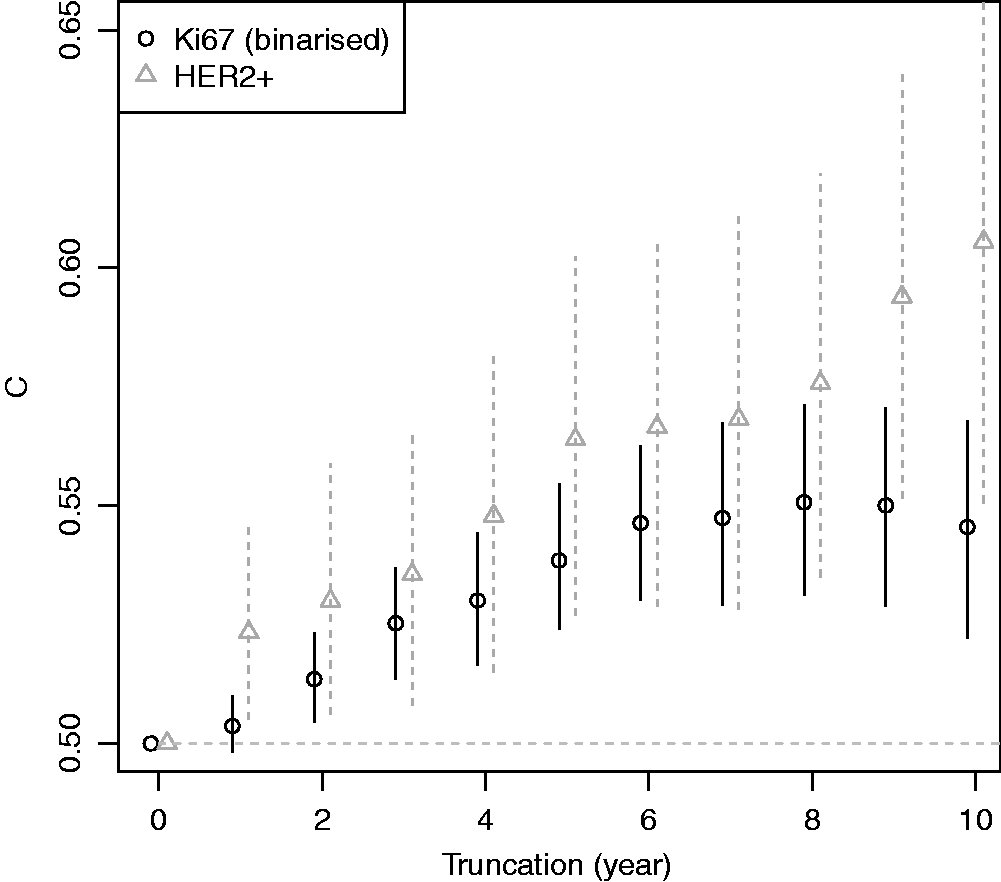
Figure 5 plots the two-sample concordance index for binarised Ki67 by censoring time. The concordance index increased, and then appeared to plateau after six years. Thus one might surmise that the two-sample estimate from 10-year follow up is unlikely to increase for this variable with further follow up due to converging hazards (c.f. Figure 2). HER2 positivity is included for comparison, where the estimated concordance index increased with follow up, in better agreement with a proportional-hazards assumption.
7 Conclusion
The concordance index is routinely used to measure how well a variable predicts the time to a censored event. However, current estimators depend on the extent of follow up and many predictors using survival data lose their discriminatory power with follow up time. To account for this phenomenon we developed a concordance index based on a Pareto model. This semi-parametric model accounts for converging hazards, but leaves a baseline hazard function unspecified. In simulations under the model it was substantially less biased than other estimators. In a breast-cancer application the ordering of prognostic biomarker concordance index estimates changed when converging hazards were modelled, reflecting that some predictors are more useful for longer-term predictions than others. Our semi-parametric concordance index estimator is recommended for predictors of censored survival data when there is evidence of converging hazards.
Footnotes
Declaration of conflicting interests
The author(s) declared no potential conflicts of interest with respect to the research, authorship, and/or publication of this article.
Funding
The author(s) disclosed receipt of the following financial support for the research, authorship, and/or publication of this article: This work was funded by Cancer Research UK (grant number C569/A16891).