
Abstract
Predicting outcomes that occur over time is important in clinical, population health, and health services research. We compared changes in different measures of performance when a novel risk factor or marker was added to an existing Cox proportional hazards regression model. We performed Monte Carlo simulations for common measures of performance: concordance indices (c, including various extensions to survival outcomes), Royston’s D index, R2-type measures, and Chambless’ adaptation of the integrated discrimination improvement to survival outcomes. We found that the increase in performance due to the inclusion of a risk factor tended to decrease as the performance of the reference model increased. Moreover, the increase in performance increased as the hazard ratio or the prevalence of a binary risk factor increased. Finally, for the concordance indices and R2-type measures, the absolute increase in predictive accuracy due to the inclusion of a risk factor was greater when the observed event rate was higher (low censoring). Amongst the different concordance indices, Chambless and Diao’s c-statistic exhibited the greatest increase in predictive accuracy when a novel risk factor was added to an existing model. Amongst the different R2-type measures, O’Quigley et al.’s modification of Nagelkerke’s R2 index and Kent and O’Quigley’s
Keywords
1 Introduction
Predicting the occurrence of an adverse event or outcome over time is an important issue in clinical, population health, and health services research. Time-to-event outcomes occur frequently in the biomedical literature. 1 The Cox proportional hazards regression model is the method most frequently used to assess the effect of patient characteristics on the risk of the occurrence of a time-to-event outcome. Clinical prediction models allow clinicians to accurately assess patient prognosis and permit effective risk stratification of patients.
There is a growing interest in identifying novel risk factors or markers (e.g. genetic factors, biomarkers, lifestyle characteristics or patient characteristics) that add important prognostic information above and beyond that contained in conventional clinical prediction models. The importance of novel risk factors or markers is often quantified by the change in model performance when a novel risk factor is added to an existing risk prediction model. Several measures have been proposed to quantify the predictive performance of a Cox proportional hazards regression model. These include extensions of concordance or c-statistics, R2-type coefficients, and Royston’s D index. Furthermore, extensions of the integrated discrimination improvement (IDI) to survival models have been developed for quantifying the incremental increase in prediction accuracy due to the inclusion of novel risk factors in an existing model. 2
In a recent paper, we examined the sensitivity of different measures of model performance to the inclusion of a novel risk factor or marker to an existing clinical prediction model when outcomes are binary. 3 Several articles have reported extensive comparisons of the performance and properties of different measures of model performance for predicting survival outcomes.2,4–9 While the statistical properties of these performance measures have been extensively studied, there is a paucity of research comparing the sensitivity of these different performance measures for survival models to the inclusion of novel risk factors or markers. The objective of the current paper was to explore changes in popularly used measures of model performance for survival outcomes when a novel risk factor or marker is added to an existing Cox proportional hazards regression model. To address this objective, we performed an extensive set of simulations reflecting scenarios that reflect current epidemiological research on new risk factors. Of note, our focus was solely on the numerical impact of adding new predictors on the selected measures of model performance and not on selecting the most appropriate measures of model performance or investigating their limitations.
The paper is structured as follows: in Section 2 we describe different measures of predictive accuracy for use with survival models. In Section 3 we describe the design of an extensive set of Monte Carlo simulations to examine the effect of adding a novel risk factor to an existing reference model on different measures of model performance for Cox proportional hazards models. In Section 4 we report the results of these simulations. In Section 5, we present a case study illustrating the application of these different methods for assessing the added utility of a heart failure mortality point-scoring system in predicting the hazard of death in patients hospitalized with heart failure. Finally, in Section 6 we summarize our findings and place them in the context of the existing literature. In particular, we compare and contrast our findings on the effect of adding novel risk factors on different measures performance for use with survival outcomes with previously published work on the effect of adding novel risk factors on different performance measures for use with binary outcomes.
2 Measures of predictive accuracy for time-to-event analyses
In this section we briefly review different measures of model performance that have been proposed for use with time-to-event models: concordance (c) statistics, Royston’s D-index, R2-type measures, and Chambless’ adaptation of the IDI for survival outcomes.
2.1 Notation and terminology
Let TS denote the outcome variable denoting time to the occurrence of the event of interest, and Z denote a vector of p explanatory variables. Observed data for the ith subject consist of the following triple: (T
i
, δ
i
, Z
i
) (
The Cox proportional hazard regression model can be written as
2.2 Concordance statistics for time-to-event outcomes
When outcomes are binary, the c-statistic is the probability that a randomly selected subject who experienced the outcome has a higher predicted probability of experiencing the outcome than a randomly selected subject who did not experience the outcome. It can be calculated by taking all possible pairs of subjects consisting of one subject who experienced the outcome of interest and one subject who did not experience the outcome. The c-statistic is the proportion of such pairs in which the subject who experienced the outcome had a higher predicted probability of experiencing the event than the subject who did not experience the outcome (i.e. out of all possible pairs in which one subject experiences the outcome and one subject does not experience the outcome, it is the proportion of pairs that are concordant).10,11 Different adaptations of the c-statistic have been proposed for use with time-to-event outcomes in which censoring may occur.8,9,12 Let Pi denote the model-based predicted probability of the occurrence of an event prior to time τ and let Di be an event indicator at time τ (i.e. Di = 1 if the ith subject experienced the event prior to time τ and Di = 0 otherwise).
Chambless and Diao proposed a time-varying extension of the conventional c-statistic to survival outcomes that most closely reflects the definition in the setting with binary outcomes.
13
At a given time τ, one considers all possible pairs of subjects consisting of one subject who experienced the event prior to time τ, and one subject who had not experienced the event by time τ. Chambless and Diao’s time-varying c-statistic is defined to be the proportion of all such pairs in which the subject who experienced the event prior to time τ had a greater predicted probability of experiencing the event prior to time τ compared to the subject who had not experienced the event prior to time τ. We denote this approach by AUC(CD). Formally,
The most commonly used extension of the c-statistic to survival analysis was proposed by Harrell et al.
14
and was extensively studied by Pencina and D’Agostino.
12
They formally defined
In Harrell’s definition of the c-index, pairs are excluded if the subject with the shorter follow-up time was censored. Thus, the AUC(H) depends on the censoring mechanism, which is not a desirable property. To address this limitation of AUC(H), Uno et al. proposed an alternative estimator of Harrell’s concordance index that uses an inverse probability of censoring weights.8,9
Finally, Gönen and Heller proposed a concordance index (which we denote as GHCI) that is a reversal of the above definitions of the c-statistic.
15
The theoretical definition of their concordance index is
Strictly speaking, the GHCI is not a c-statistic. However, we include it in this sub-section since it is a concordance-type index. We will use the term c-statistic when we are referring to one of AUC(H), AUC(CD), or AUC(U). We will use the term concordance or concordance statistics when we are referring to one of the three c-statistics or to the GHCI.
2.3 Royston’s D-index
Royston and Sauerbrei proposed a measure of prognostic separation in survival data that has been referred to as D.
16
D measures prognostic separation of survival curves and is closely related to the standard deviation of the prognostic index. The prognostic index for each subject is defined to be the linear predictor from the fitted Cox proportional hazards model. Ranking the prognostic index across the sample, one assigns to the ith subject the ith expected standard normal order statistic in a sample of the same size. Using a Cox proportional hazards model, one then regresses the original time-to-event outcome on the expected standard normal order statistics. Royston’s D-index is defined to be the estimated regression coefficient multiplied by
2.4 R2-type measures
A large number of different R2-type measures for use with survival models have been proposed.16–30 Comprehensive reviews of these different measures are provided by Choodari-Oskooei et al.,4,5 Hielscher et al.,
6
and by Schemper and Stare.
7
Most of these R2-type measures attempt to mimic the definition of R2 for linear models:
Choodari-Oskooei et al. suggest that a measure of explained variation should satisfy four properties: (i) independence from censoring (i.e. the measure is not affected by the degree of censoring in the data), (ii) monotonicity (i.e. that the measure of predictive accuracy takes on higher values as the magnitude of the effect of a covariate on the outcome increases), (iii) interpretability, and (iv) robustness against influential observations.
5
Based on these criteria, Choodari-Oskooei et al. suggest that two measures of explained variation should be used: Kent and O’Quigley’s
In another review, Hielscher et al. suggested that two different measures of explained variation be used: An R2 based on the Integrated Brier Score (IBS),
For binary prediction models, the Brier score is the mean squared prediction error. The IBS, an extension of this concept to survival outcomes, is defined as
Schemper and Henderson’s integrated measure of predictive accuracy is defined as
Two different R2-type measures, which fall into Choodari-Oskooei et al.’s miscellaneous class, are based on the likelihood ratio statistic for comparing the full model with the null model. Allison suggested
2.5 IDI
Pencina et al. suggested that the improvement in predicting the probability of the occurrence of a binary outcome due to the addition of a novel risk factor to an existing risk-prediction model can be summarized using the IDI.
33
Given a new regression model that includes a novel risk factor and an older regression model in which this risk factor is omitted, the IDI is estimated as

Chambless et al. proposed a time-varying extension of the IDI to survival outcomes, based on the observation that the original IDI is related to the change in the proportion of variance explained between the model with and without the novel risk factor (
2.6 Software
We used R software (version 2.15.2, R Foundation for Statistical Computing, Vienna, Austria) to simulate the random datasets. AUC(CD), AUC(U), and GHCI were estimated using the AUC.cd, UnoC, and GHCI functions in the survAUC package. The IBS of Graf et al.,
3 Methods – Monte Carlo simulations
An extensive series of Monte Carlo simulations was performed, similar in design to those in a recent study examining this issue in the context of binary outcomes and logistic regression models. 3 Our simulations incorporated the following design elements: (i) an existing prediction model that related a continuous risk factor to the hazard of the occurrence of a time-to-event outcome with a given predictive accuracy (i.e. the ‘reference model’), (ii) the addition of either a novel binary or continuous risk factor to the existing model, (iii) variations in the magnitude of the correlation between the existing continuous risk factor and the novel risk factor, (iv) variations in the prevalence of the novel binary risk factor, (v) variation in the magnitude of the hazard ratio relating the novel risk factor to the hazard of the occurrence of the outcome, (vi) scenarios with a high degree of censoring (low observed event rate) versus scenarios with a low degree of censoring (high observed event rate), (vii) censoring occurring due to administrative censoring versus censoring occurring due to study dropout or loss to follow-up.
We describe one scenario in detail and then describe briefly how this scenario was modified in subsequent scenarios. For each of 1000 subjects, we randomly generated a continuous predictor variable denoting an established risk factor from a standard normal distribution:
Two Cox proportional hazards models were fit in each simulated dataset: a regression model consisting of only the continuous risk factor x1 and a regression model consisting of the continuous risk factor x1 and the novel binary risk factor x2. The predictive accuracy of each of the two models was determined using the different methods described in the preceding section. The change in predictive accuracy was then determined across 1000 simulated datasets (each consisting of 1000 subjects). For those measures of predictive accuracy that are time varying (AUC(CD), AUC(u), and Chambless’ IDI), we estimated model performance at τ = t0, where t0 is as defined earlier. Similarly, the IBS was determined over the maximum duration of follow-up.
In the Monte Carlo simulations, the following factors were varied: (1) the proportion of subjects for whom an event was observed to occur: 0.10 versus 0.75 (low versus high rate of observed events); (2) exp(α1) (the hazard ratio for the continuous risk factor): from 1 to 3 in increments of 0.2; (3) the prevalence of the novel binary risk factor: 0.10, 0.25, and 0.50; (4) exp(α2) (the hazard ratio for the novel binary risk factor): 1.10, 1.25, 1.50, and 2.0. We thus examined 264 (2 × 11 × 3 × 4) different scenarios in which the novel risk factor was binary and was independent of the existing continuous risk factor. Each statistical method was applied to the same simulated datasets, so that the simulated datasets did not vary between the statistical methods.
We modified the above scenario by inducing a correlation between the existing continuous risk factor and the novel binary risk factor. We examined two different scenarios characterized by different degrees of correlation between the existing continuous risk factor and the novel binary risk factor. To do so, we simulated two continuous risk factors from a standard bivariate normal distribution with correlation ρ between the two components. The first component was used as the existing continuous risk factor. We categorized the second component at a given threshold, and defined the novel binary risk factor to be present if the second component lay above the threshold, and to be absent if the second component lay below the threshold. The threshold was selected so that the prevalence of the novel binary risk factor was as described earlier (0.1, 0.25, and 0.50). The simulations then proceeded as described earlier. In the first modification, ρ was set to 0.5, while in the second modification, ρ was set to 0.8.
The above three sets of simulations examined changes in predictive accuracy due to the inclusion of a novel binary risk factor to a Cox proportional hazards model that consisted of an existing continuous risk factor. We modified the original scenario to examine changes in model performance due to the inclusion of a novel continuous risk factor. In this fourth set of simulations, the novel risk factor was simulated from a standard normal distribution. Furthermore, it was generated so as to be independent of the continuous existing risk factor. The hazard ratio for the continuous novel risk factor took on the following values: 1.1, 1.25, 1.5, and 2. We thus examined 88 different scenarios (two degrees of censoring × 11 hazard ratios for the existing continuous risk factor × four hazard ratios for the novel continuous risk factor). The simulations then proceeded as described earlier.
The above sets of simulations used data-generating processes that induced administrative censoring, with either 25 or 90% of subjects being censored due to study termination (all subjects whose survival time exceeded t0 had their event time censored at time t0). We then repeated each of the above scenarios in which the novel risk factor was independent of the existing continuous risk factor (due to space and time constraints, we did not examine the scenarios in which the two risk factors were correlated), with censoring induced by loss to follow-up or study dropout. We induced study dropout so that some subjects dropped out prior to the true event time. We determined each subject’s dropout status from a Bernoulli distribution with parameter Pdropout. Subjects who were selected as dropping out had a dropout time selected from a uniform (0,TS) distribution, where TS denotes the subject’s true event time. We examined two different values of Pdropout: 0.25 and 0.90, so that 25% and 90% of subjects were subject to censoring due to study dropout, with the event being observed for the remaining subjects. The simulations then proceeded as described earlier.
4 Results – Monte Carlo simulations
We report our results separately for the four scenarios defined by the nature of the novel risk factor (binary versus continuous) and its correlation with the existing continuous risk factor. Results are reported in detail for the first setting and more briefly for the remaining settings.
4.1 Binary risk factor independent of existing continuous risk factor
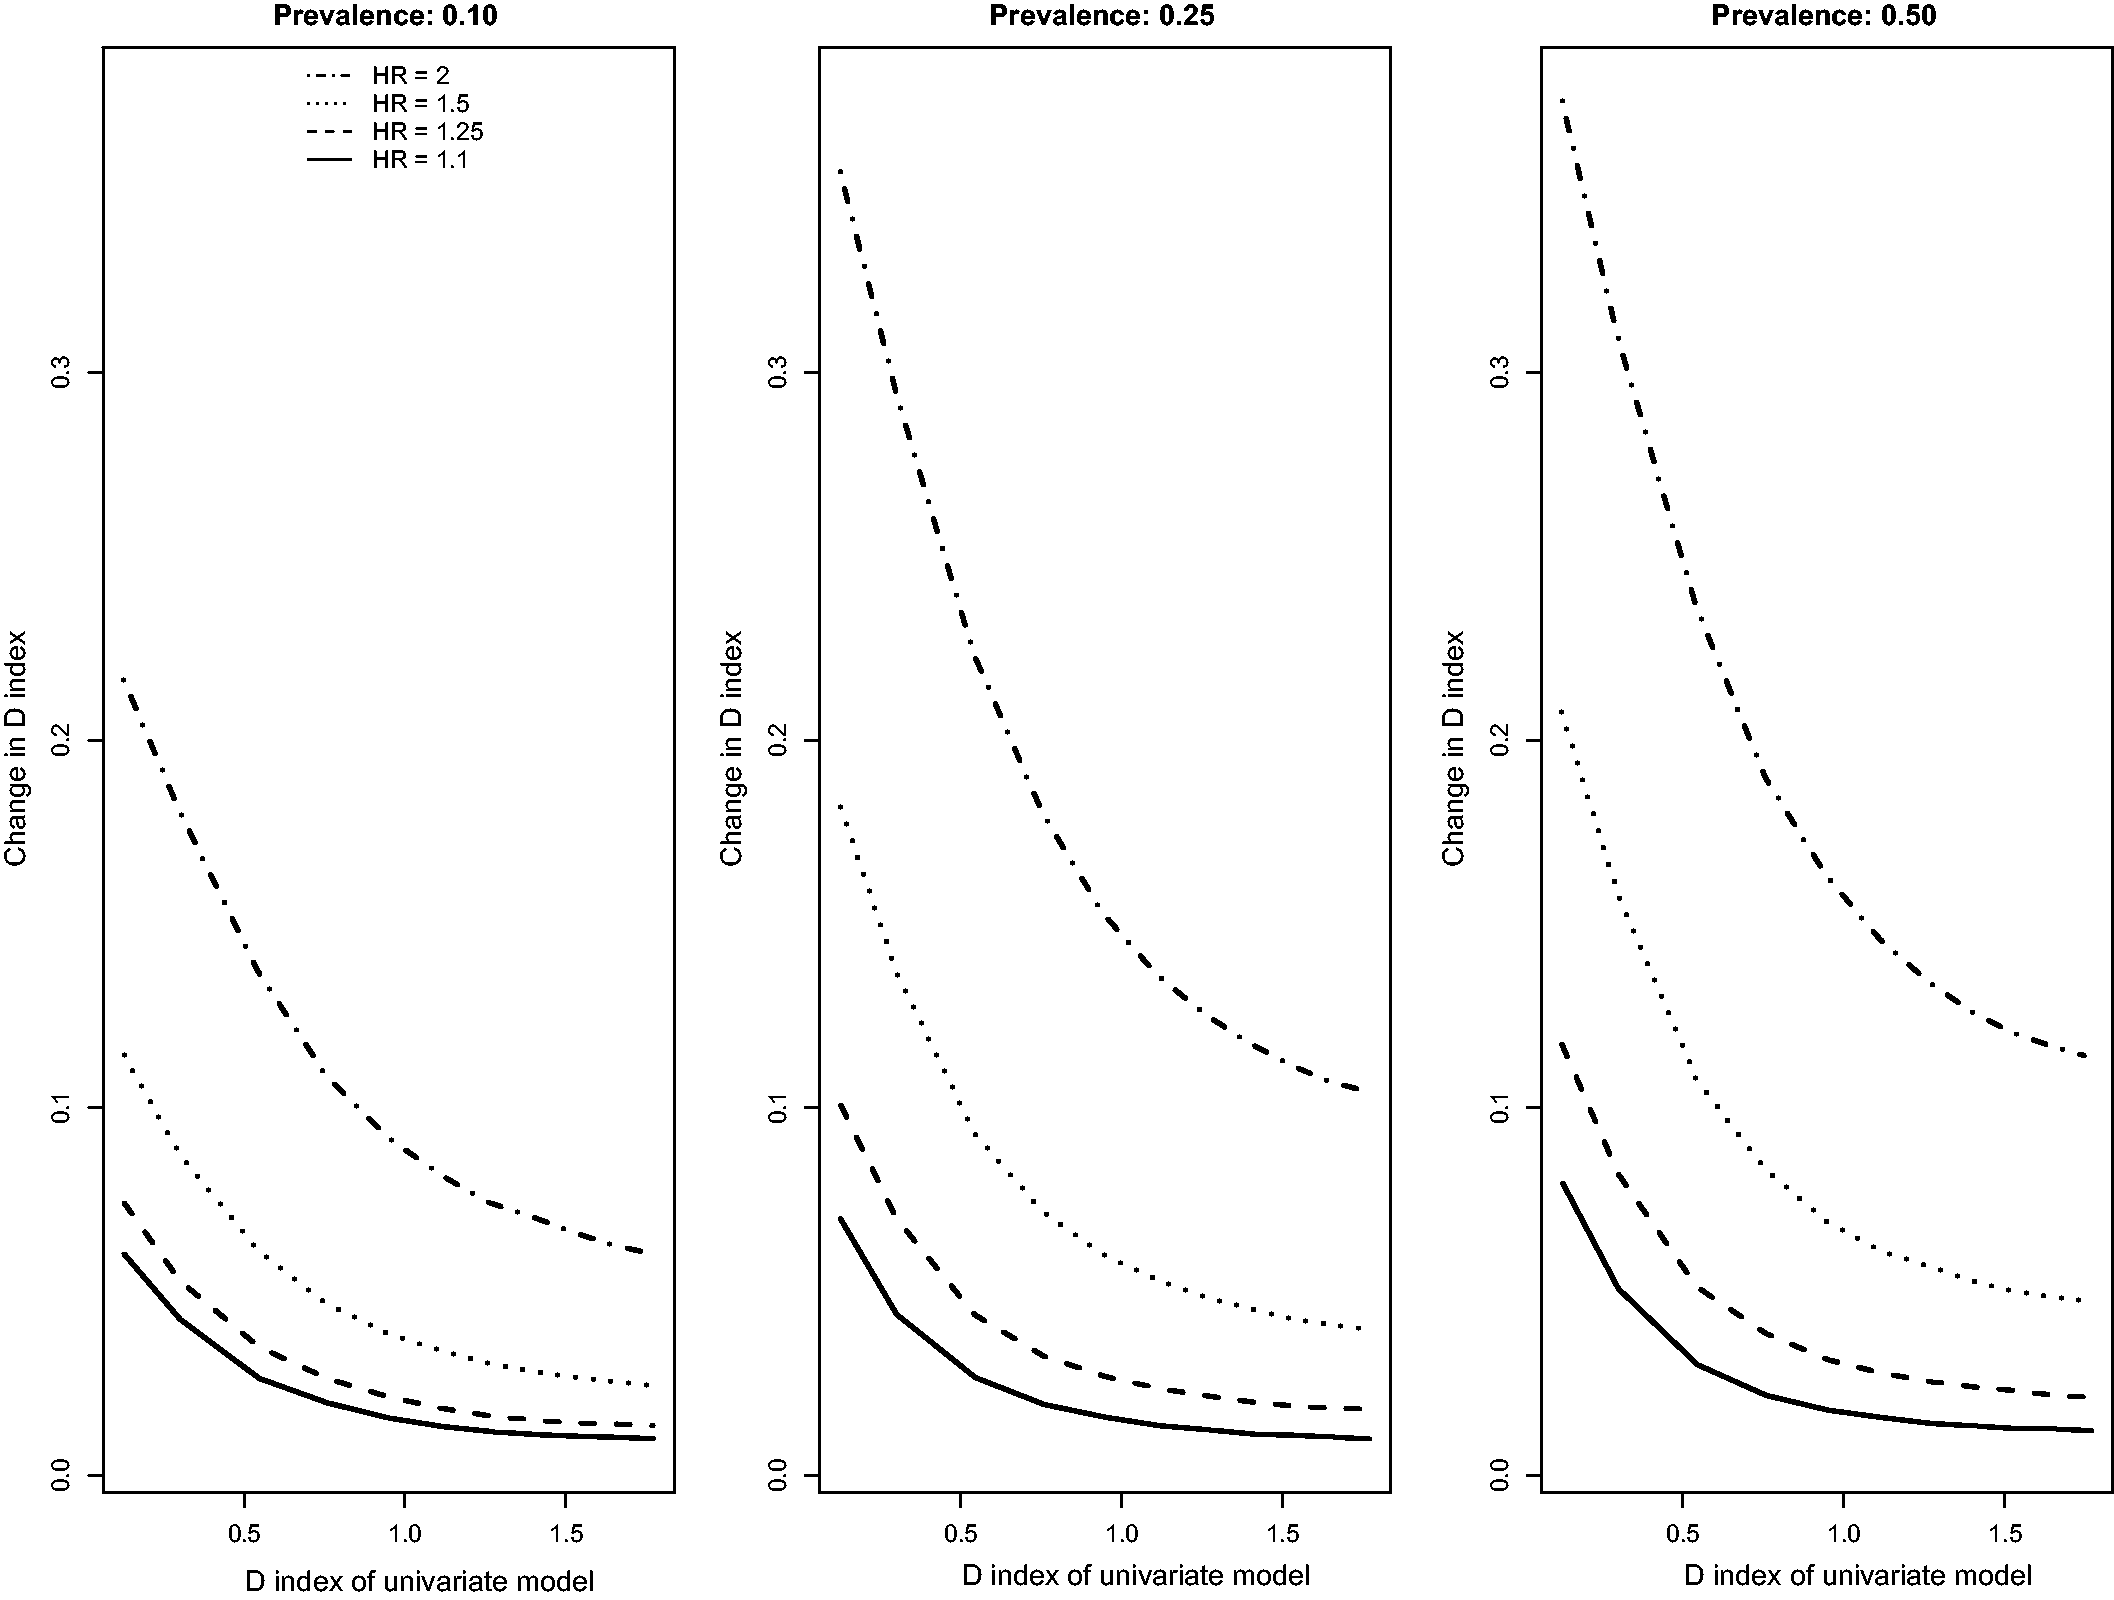
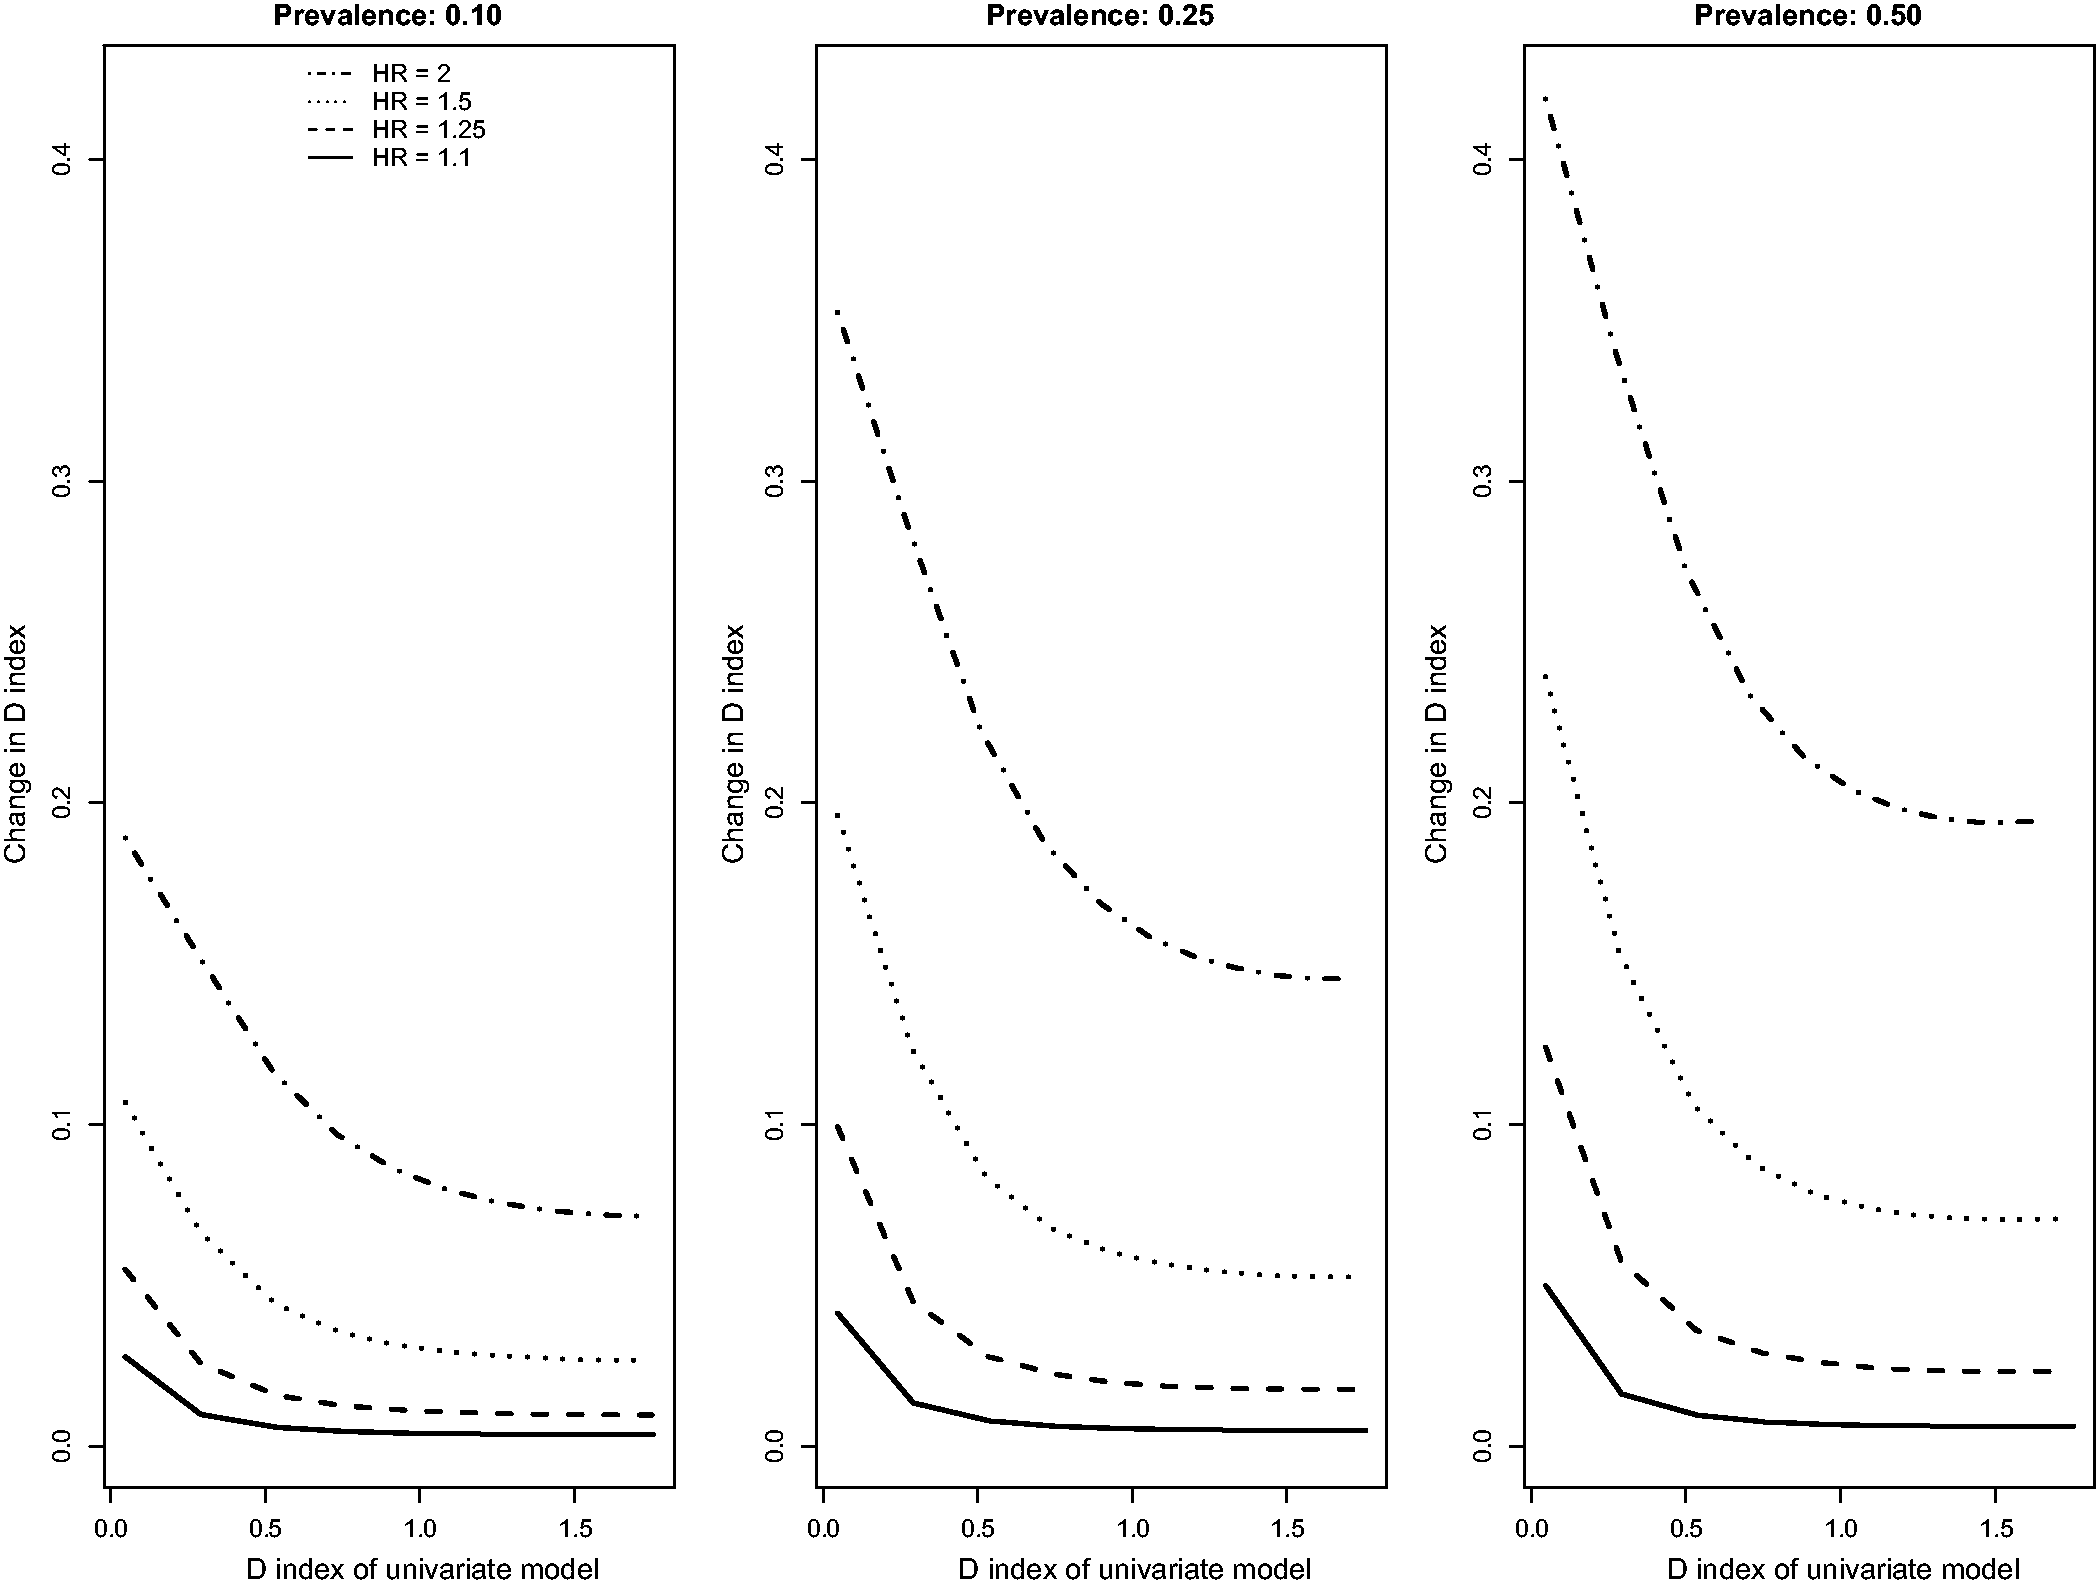
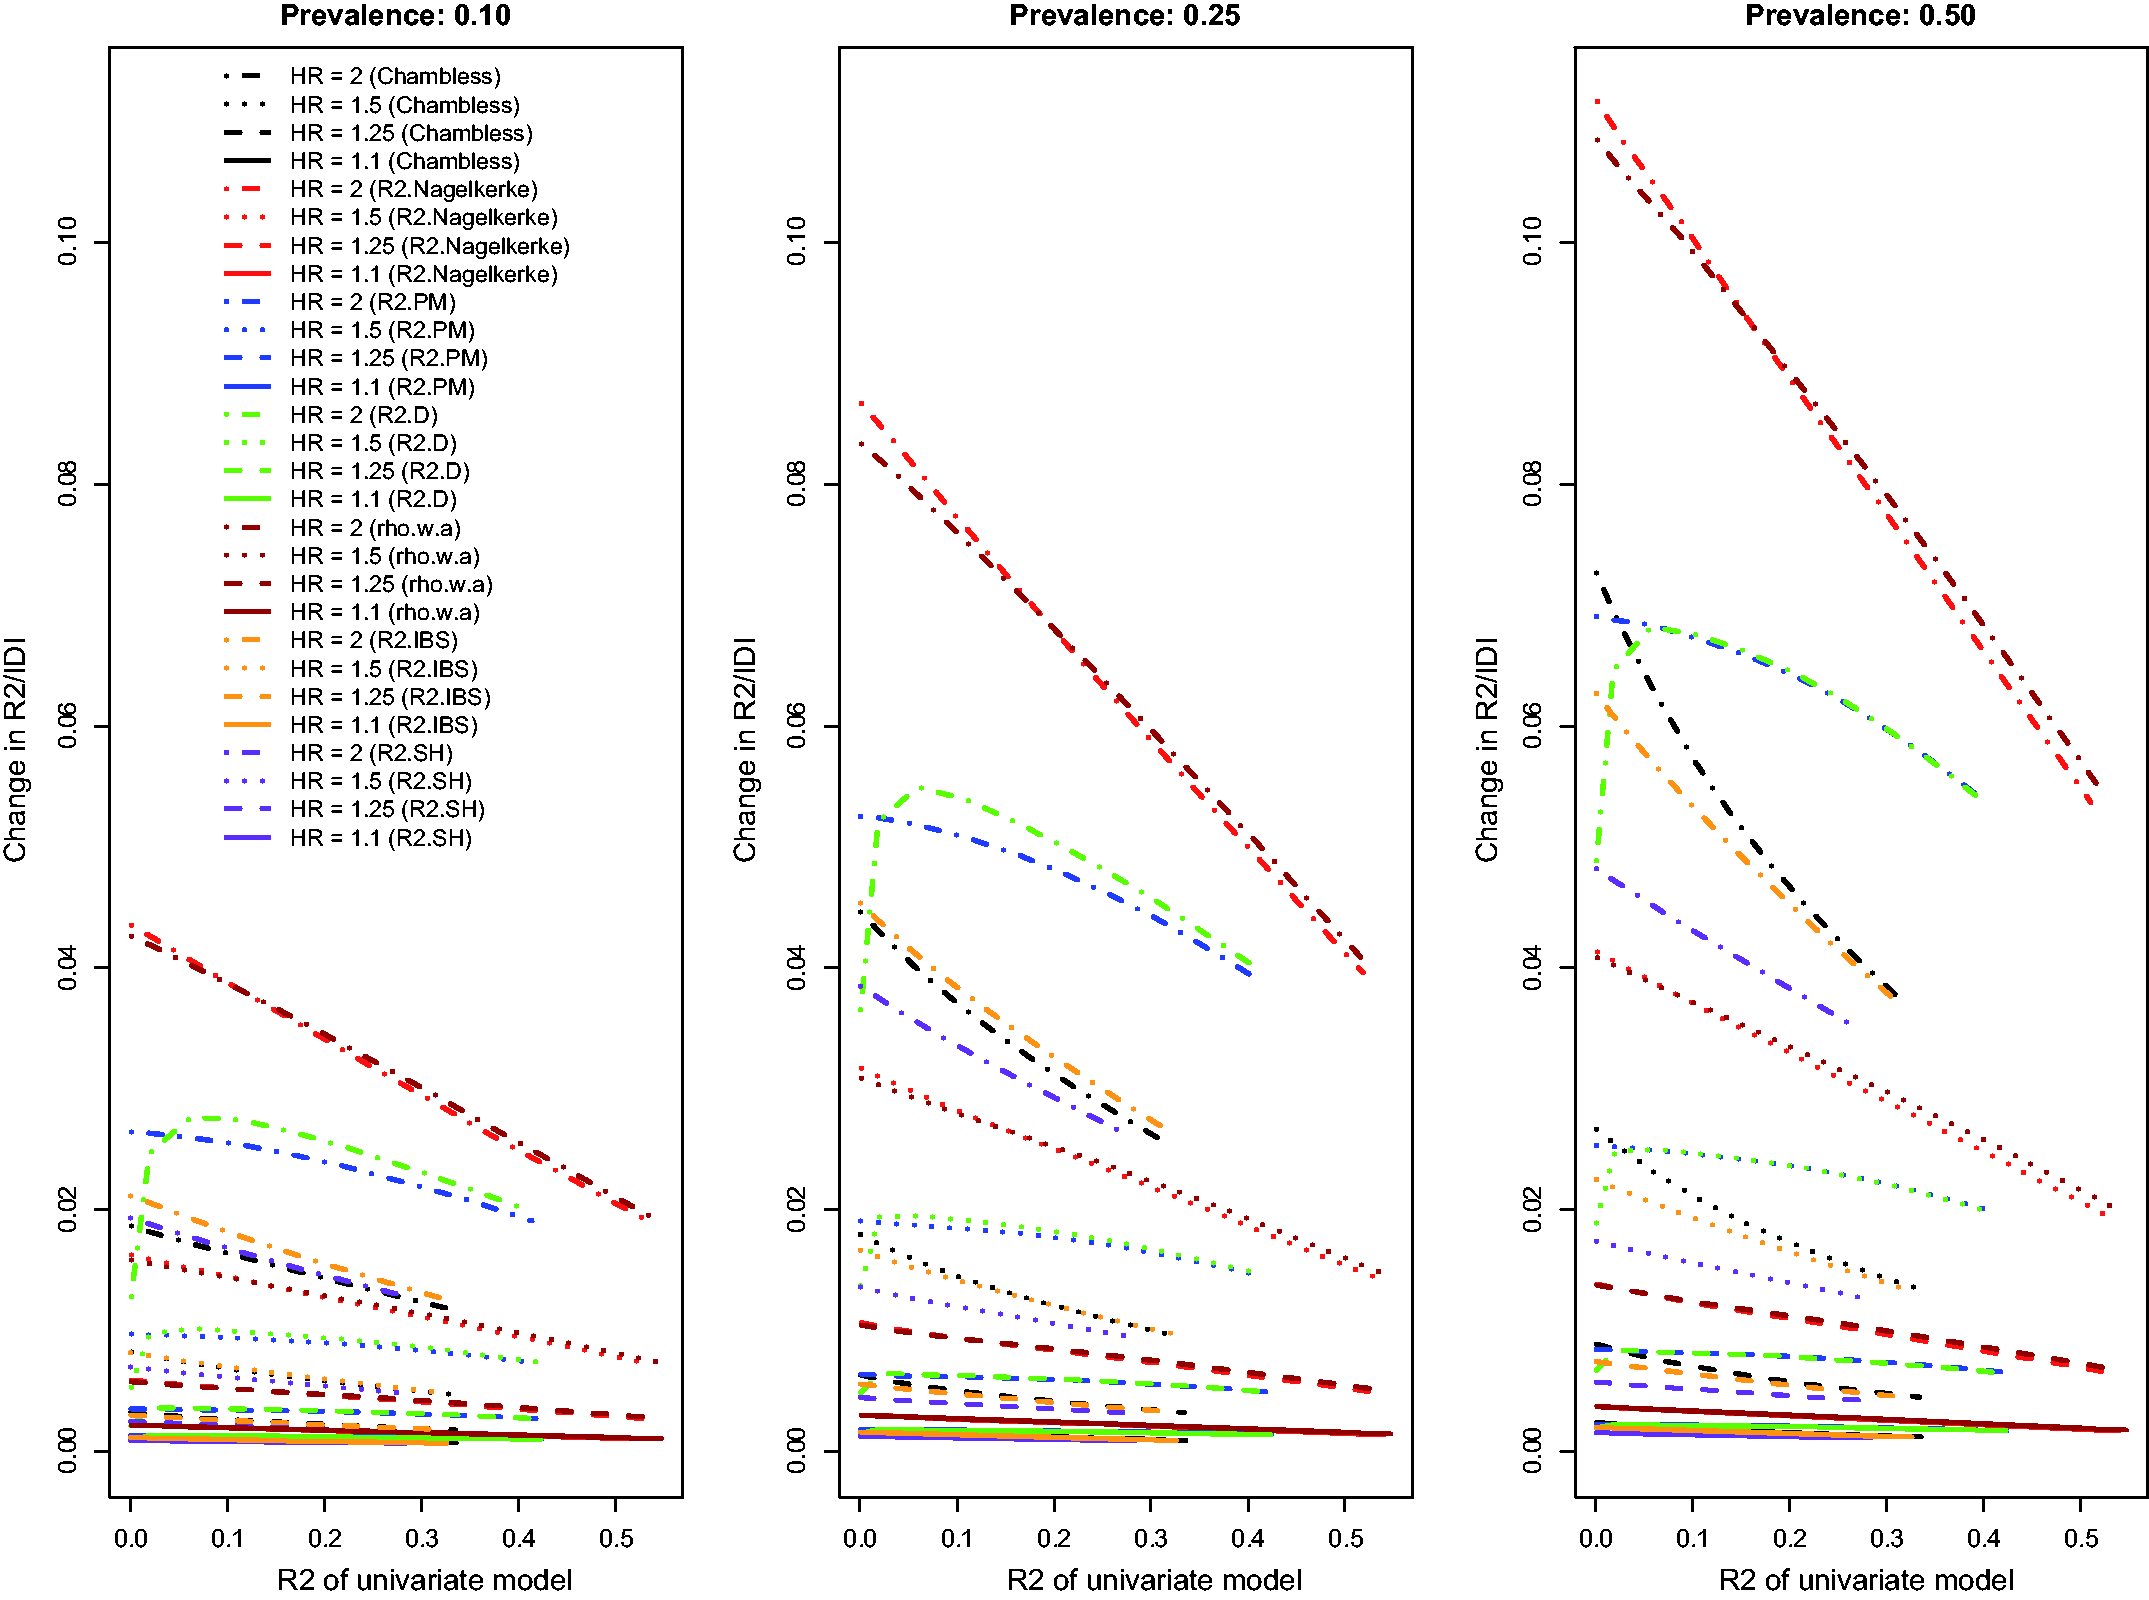
Results for the scenarios with an independent binary risk factor that is uncorrelated with the existing continuous risk factor, in which there was a low event rate (i.e. high rate of censoring), and in which censoring was due to administrative censoring are reported in Figures 1 to 3. In Figure 1, we report the changes for the four concordance statistics (AUC(H), AUC(CD), AUC(U), and GHCI) when the novel binary risk factor was added to the regression model. Several observations merit comment. First, improvements in concordance due to the inclusion of the binary risk factor decreased as the concordance of the reference model increased. Second, improvements in concordance increased as the hazard ratio of the novel binary risk factor increased. Third, improvements in concordance due to the addition of the novel binary risk factor increased as the prevalence of the binary risk factor increased. Fourth, improvements in AUC(H) were essentially identical to improvements in AUC(U). Fifth, improvements in the AUC(CD) were modestly greater than improvements in the other three concordance measures while improvements in GHCI were modestly lower than improvements in the other three concordance measures. Changes in Royston’s D index due to the inclusion of the novel binary risk factor displayed similar patterns (Figure 2).
Relationship between change in c-statistic and c-statistic of univariate model (low event rate – uncorrelated binary). Relationship between change in D index and D index of univariate model (low event rate – uncorrelated binary). Relationship between change in R2 and R2 of univariate model (low event rate – uncorrelated binary).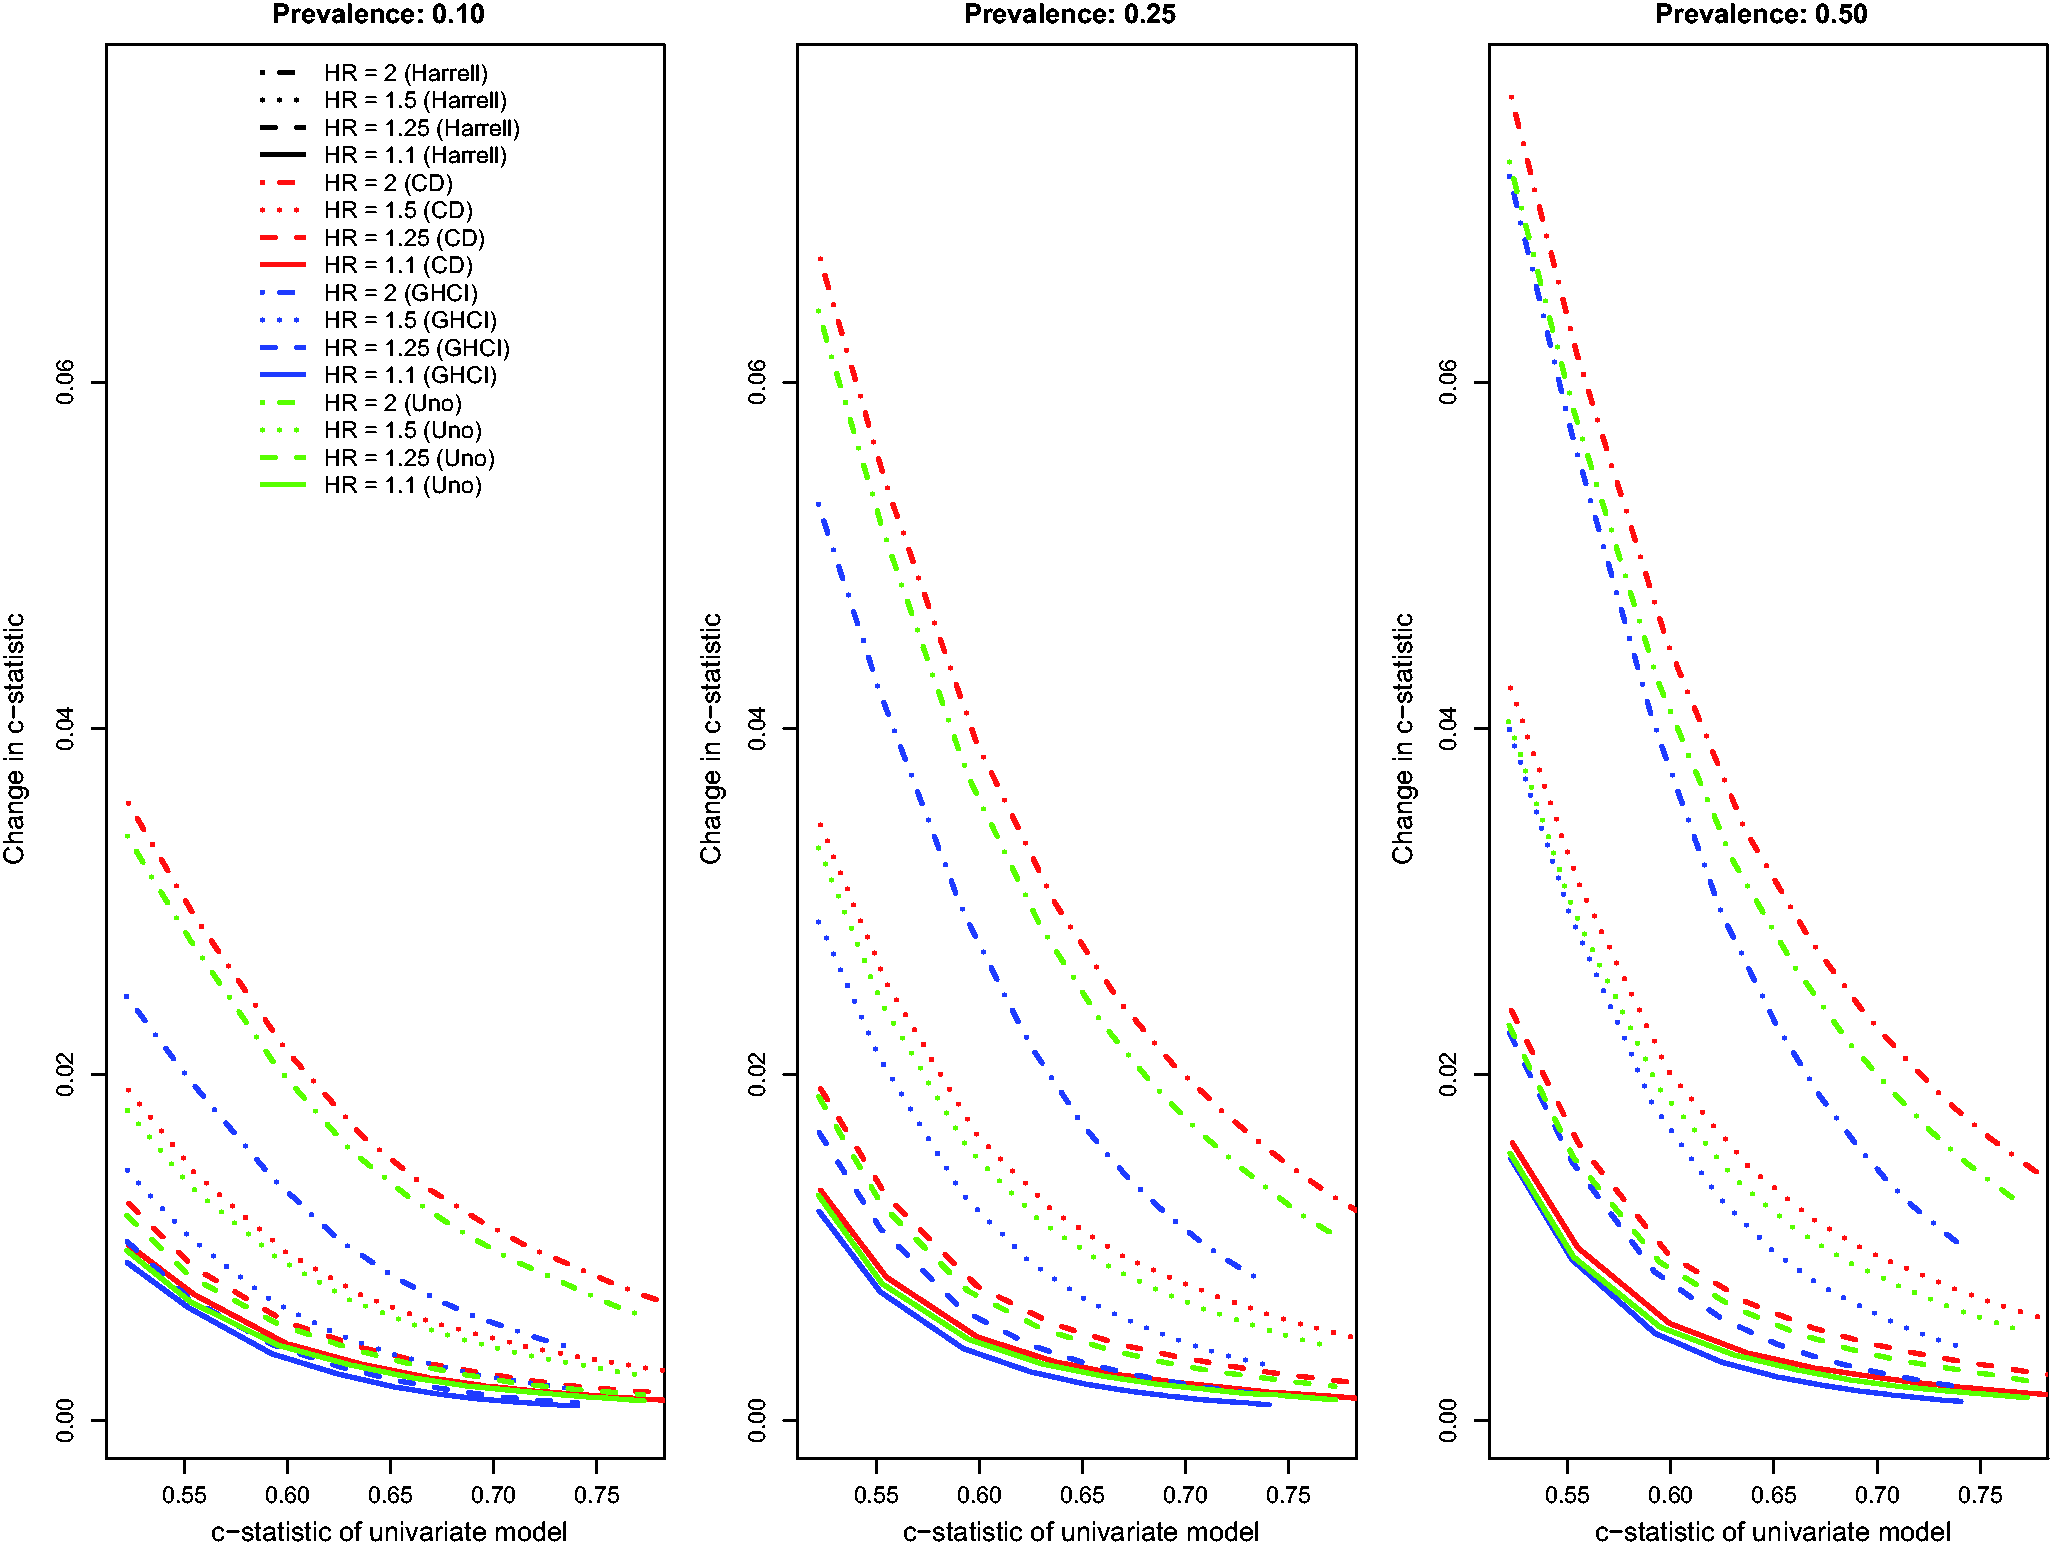
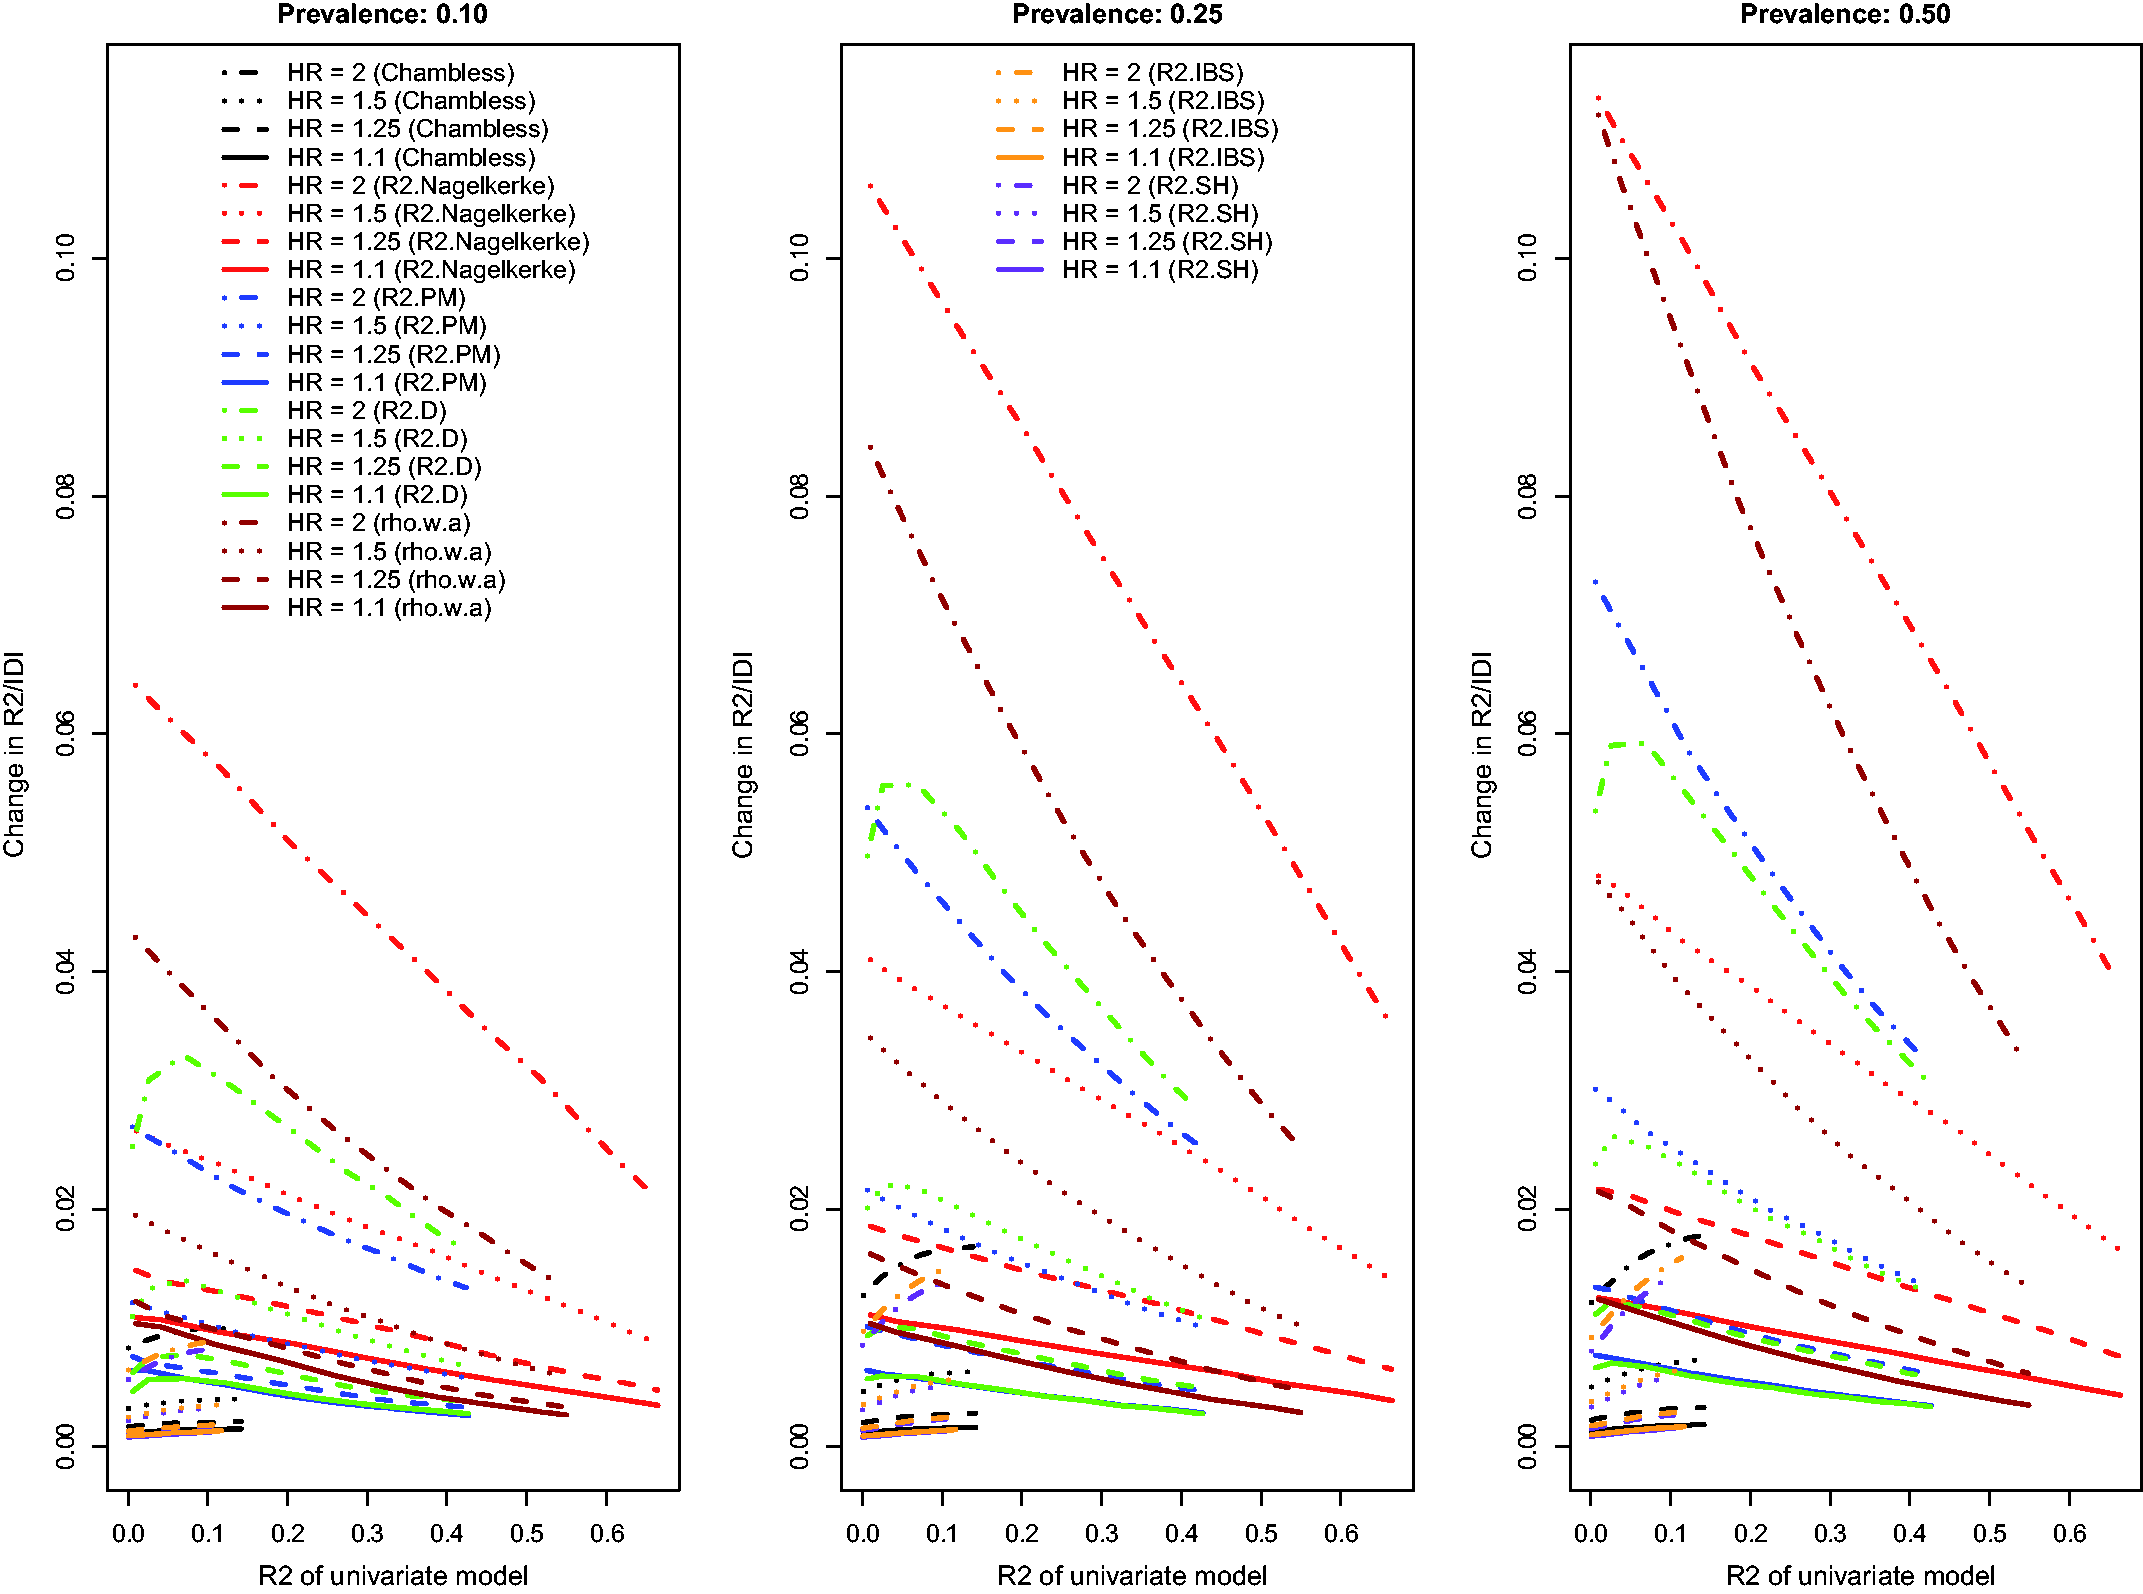
The relationship between the change in each R2-type measure and the R2 of the univariate model is described in Figure 3. Because Chambless characterized the IDI as a difference in R2-type measures, we have superimposed on this figure the relationship between Chambless’ IDI and Chambless’ estimate of R2 for the reference model. Three of the R2-type measures (the adapted Nagelkerke
The above findings pertain to the settings with a low observed event rate (i.e. the outcome was observed to occur for approximately 10% of subjects, with the remainder being subject to administrative censoring). Results for the settings with a high observed event rate (i.e. the outcome was observed to occur for approximately 75% of subjects, with the remainder being subject to administrative censoring) were similar to those observed in the setting with a low observed event rate (Figures 4 to 6). However, the absolute increase in concordance due to the inclusion of the novel binary risk factor tended to be greater when the observed event rate was high compared to when it was low. Second, differences between AUC(CD) and the other three concordance measures were amplified, while differences between GHCI and AUC(H) and AUC(U) were attenuated. The increase in the observed event rate tended to magnify the absolute increase in Royston’s D index, albeit to a lesser degree than for the concordance indices. The differences between the previously observed results for Relationship between change in c-statistic and c-statistic of univariate model (high event rate – uncorrelated binary). Relationship between change in D index and D index of univariate model (high event rate – uncorrelated binary). Relationship between change in R2 and R2 of univariate model (high event rate – uncorrelated binary).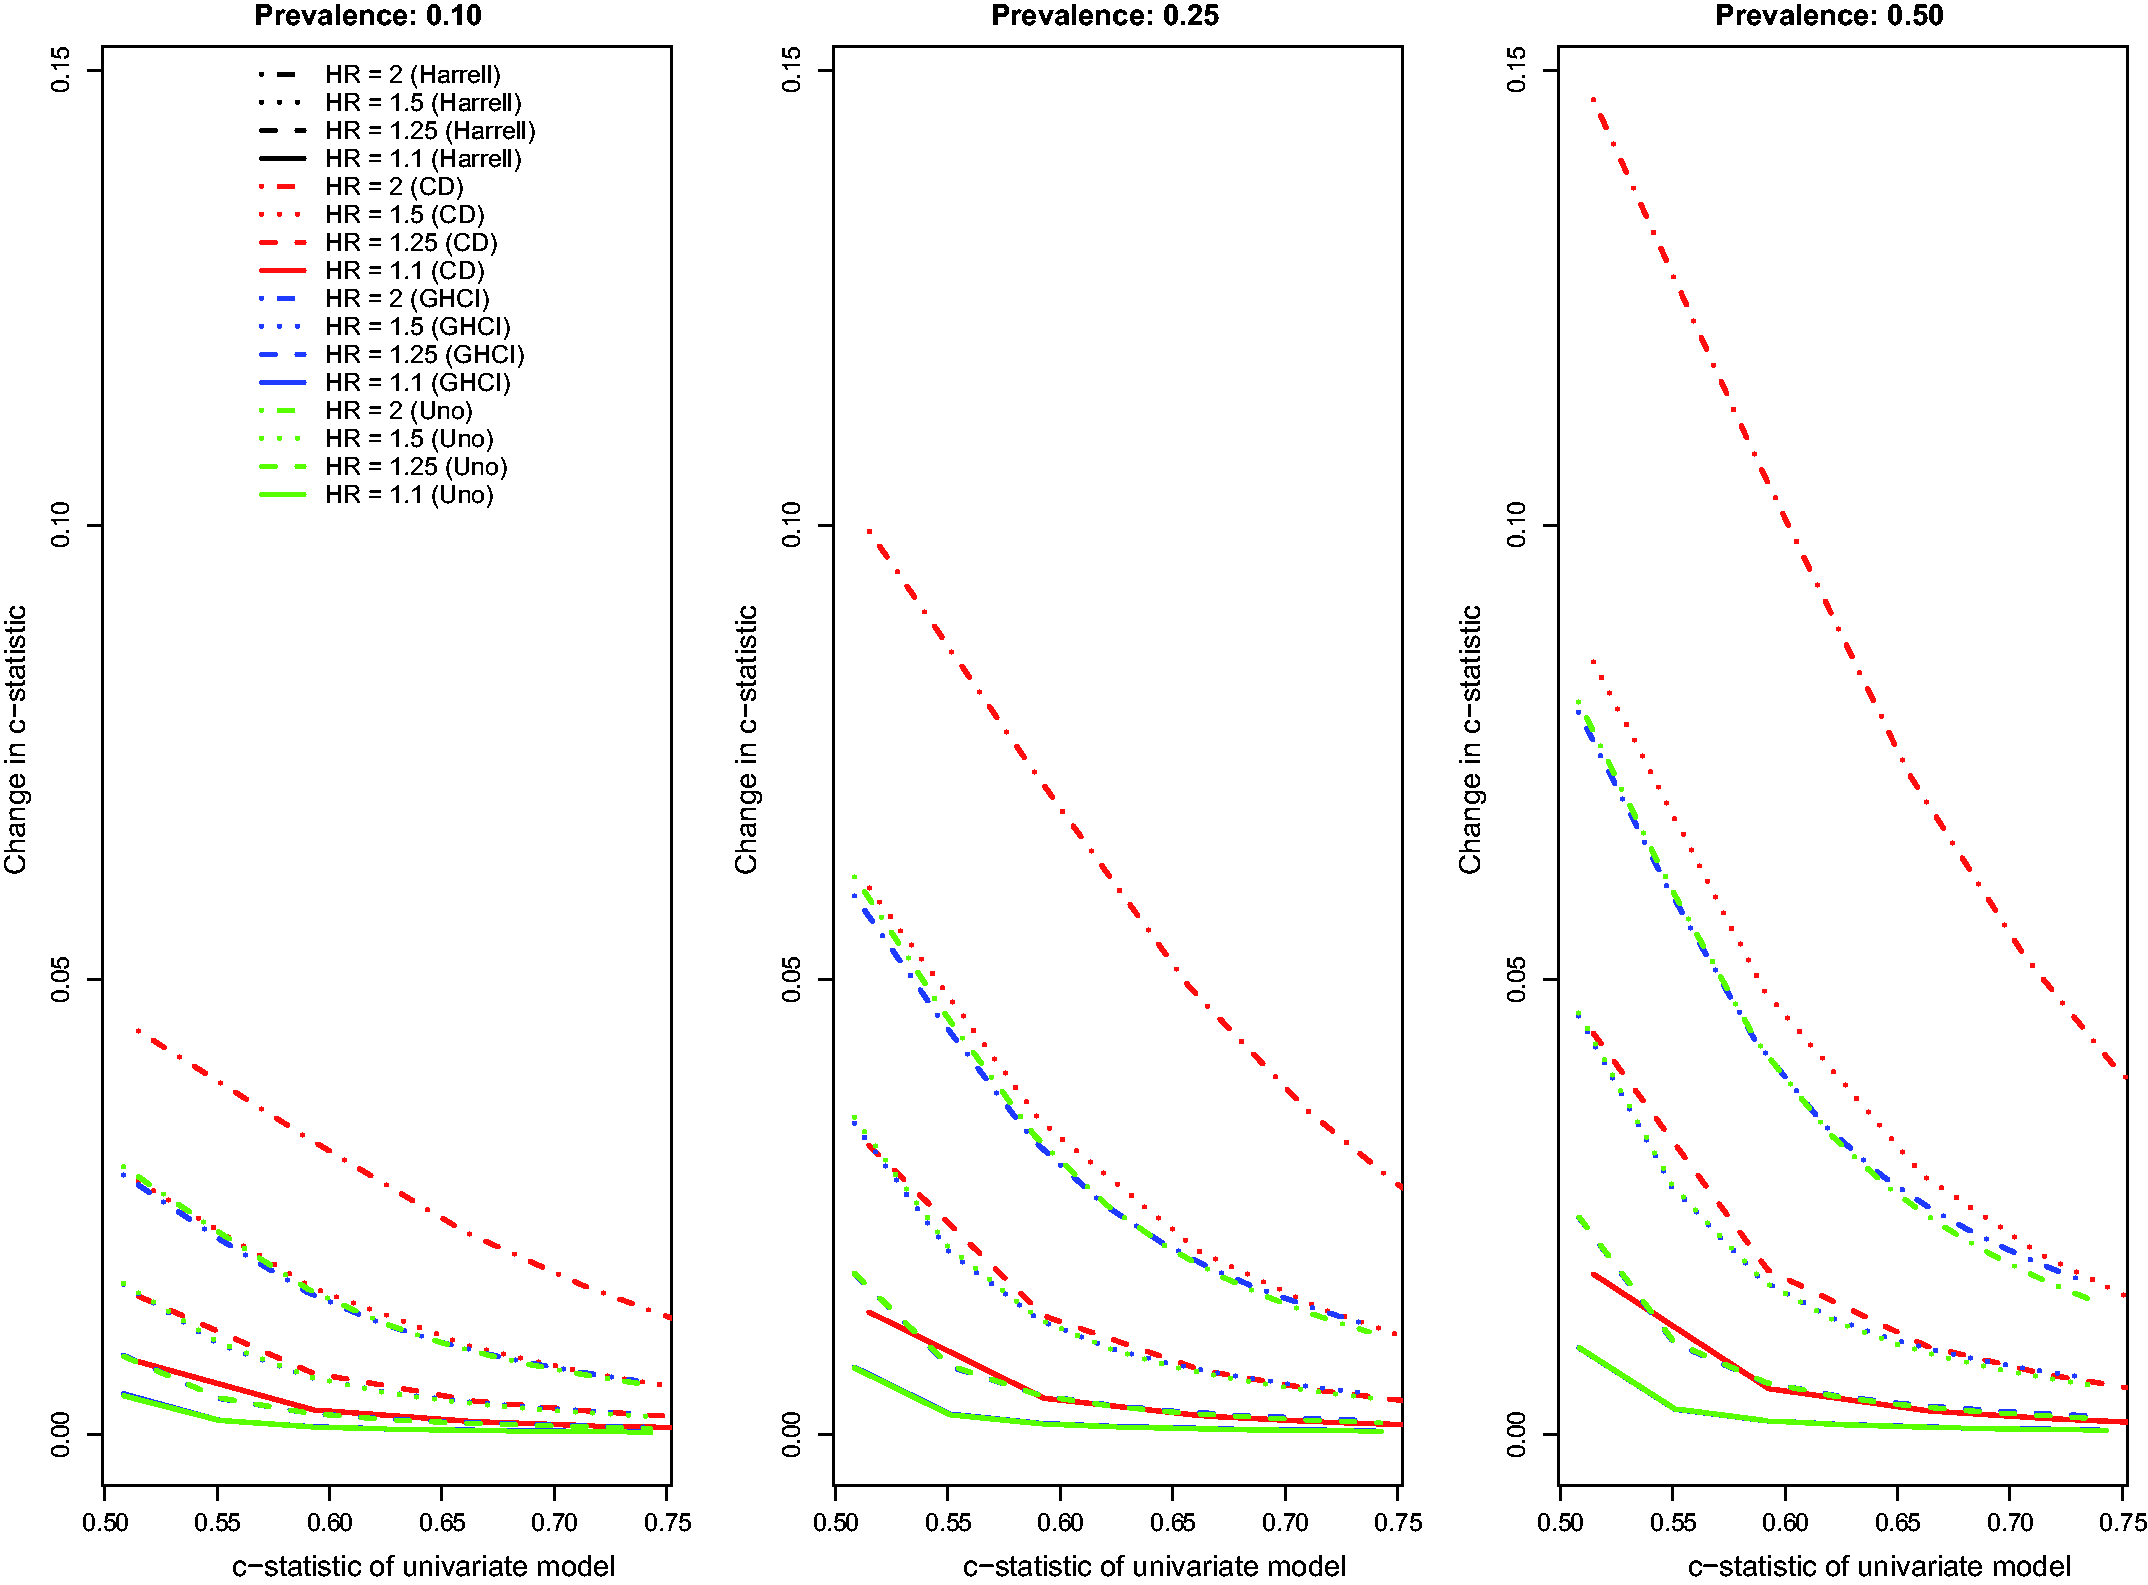
When censoring was due to study dropout and event rates were high, results were qualitatively similar to those described earlier in the settings with administrative censoring. One noticeable change was that, in the presence of censoring due to study dropout, the effect of a novel marker was more pronounced on
4.2 Binary risk factor correlated with the existing continuous risk factor
We considered four different sets of scenarios in which the novel binary risk factor was correlated with the existing continuous risk factor and in which subjects were subject to administrative censoring (low observed event rate versus high observed event rate; correlation of 0.5 versus correlation of 0.8). Results were qualitatively similar to those described above (results for the scenarios with a high observed event rate and a correlation of 0.5 are described in Figures A to C in the online supplemental material (available at http://smm.sagepub.com), the other results are not provided). The primary exception was that the changes in concordance and Royston’s D index did not decrease smoothly as the predictive accuracy of the reference model increased. Instead, there was some jaggedness evident in the lines. In the presence of a low event rate, a low prevalence (10%) of the binary risk factor, and a high correlation between the binary risk factor and the continuous risk factor, then some of the R2 measures (in particular
4.3 Continuous risk factor independent of existing continuous risk factor
Results for the setting with a continuous novel risk factor that is uncorrelated with the existing continuous risk factor, and in which there was a low observed event rate due to administrative censoring, were similar to those noted in Section 4.1 (Figure 7). For the IDI, Relationship between change in model accuracy and model accuracy of univariate model (low event rate – uncorrelated continuous). Relationship between change in model accuracy and model accuracy of univariate model (high event rate – uncorrelated continuous).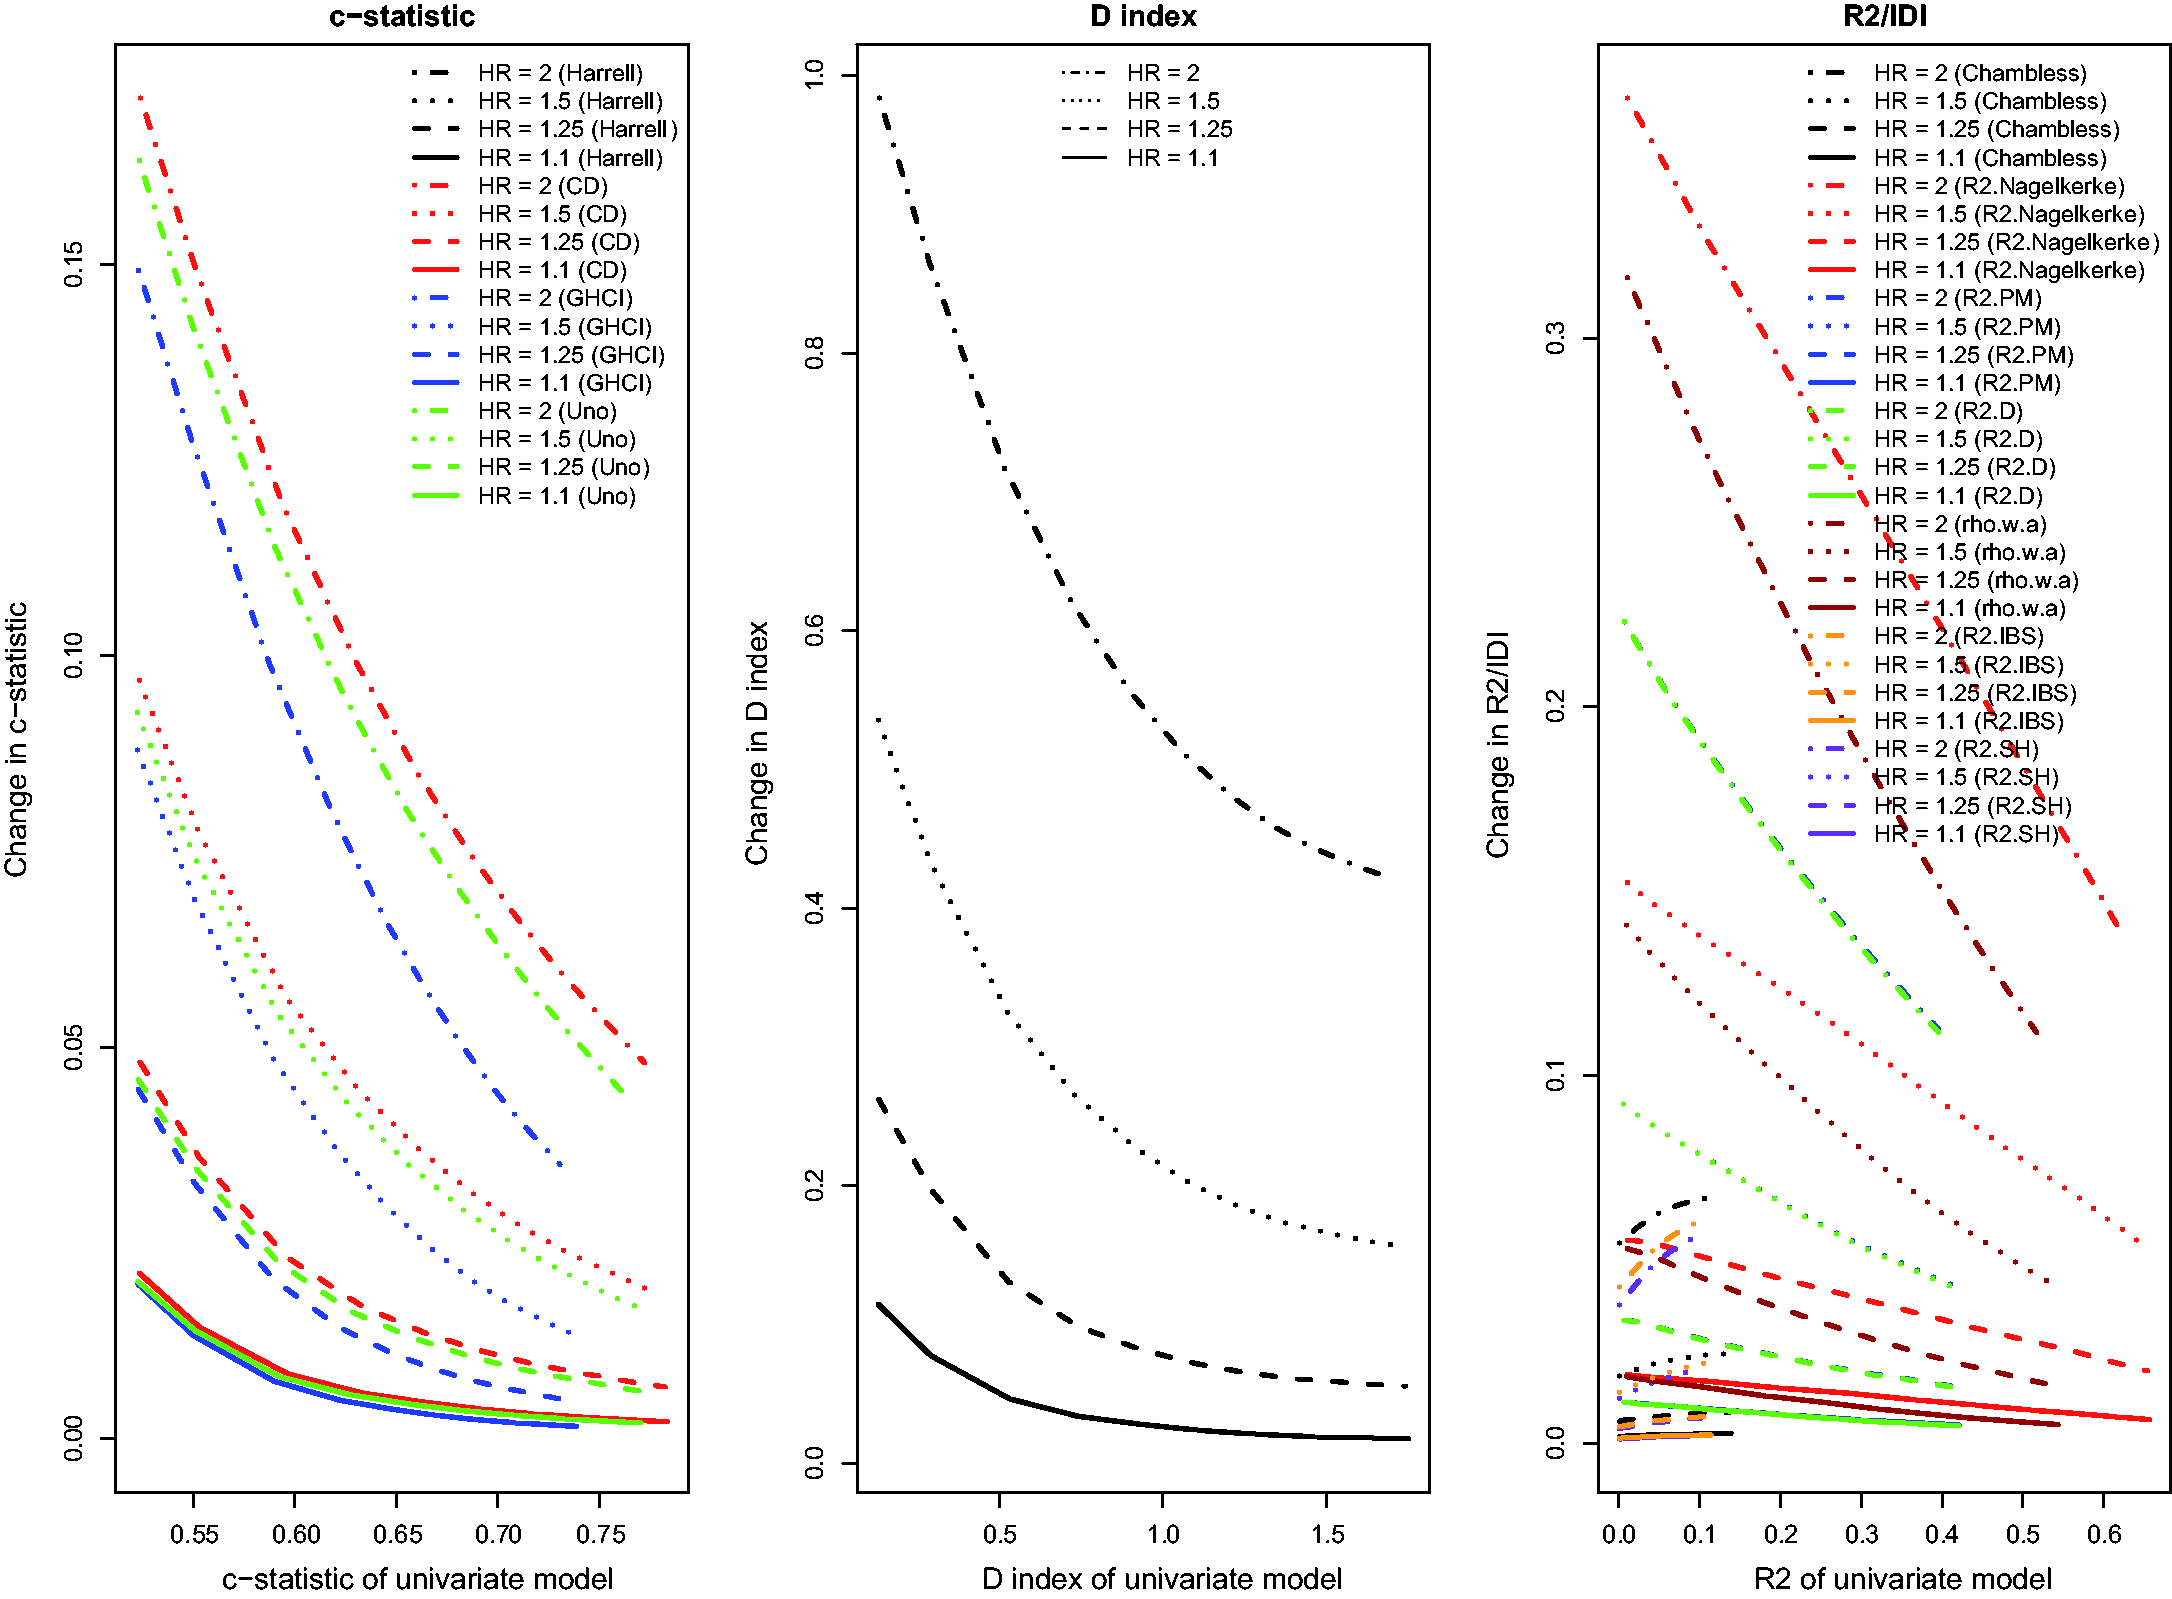
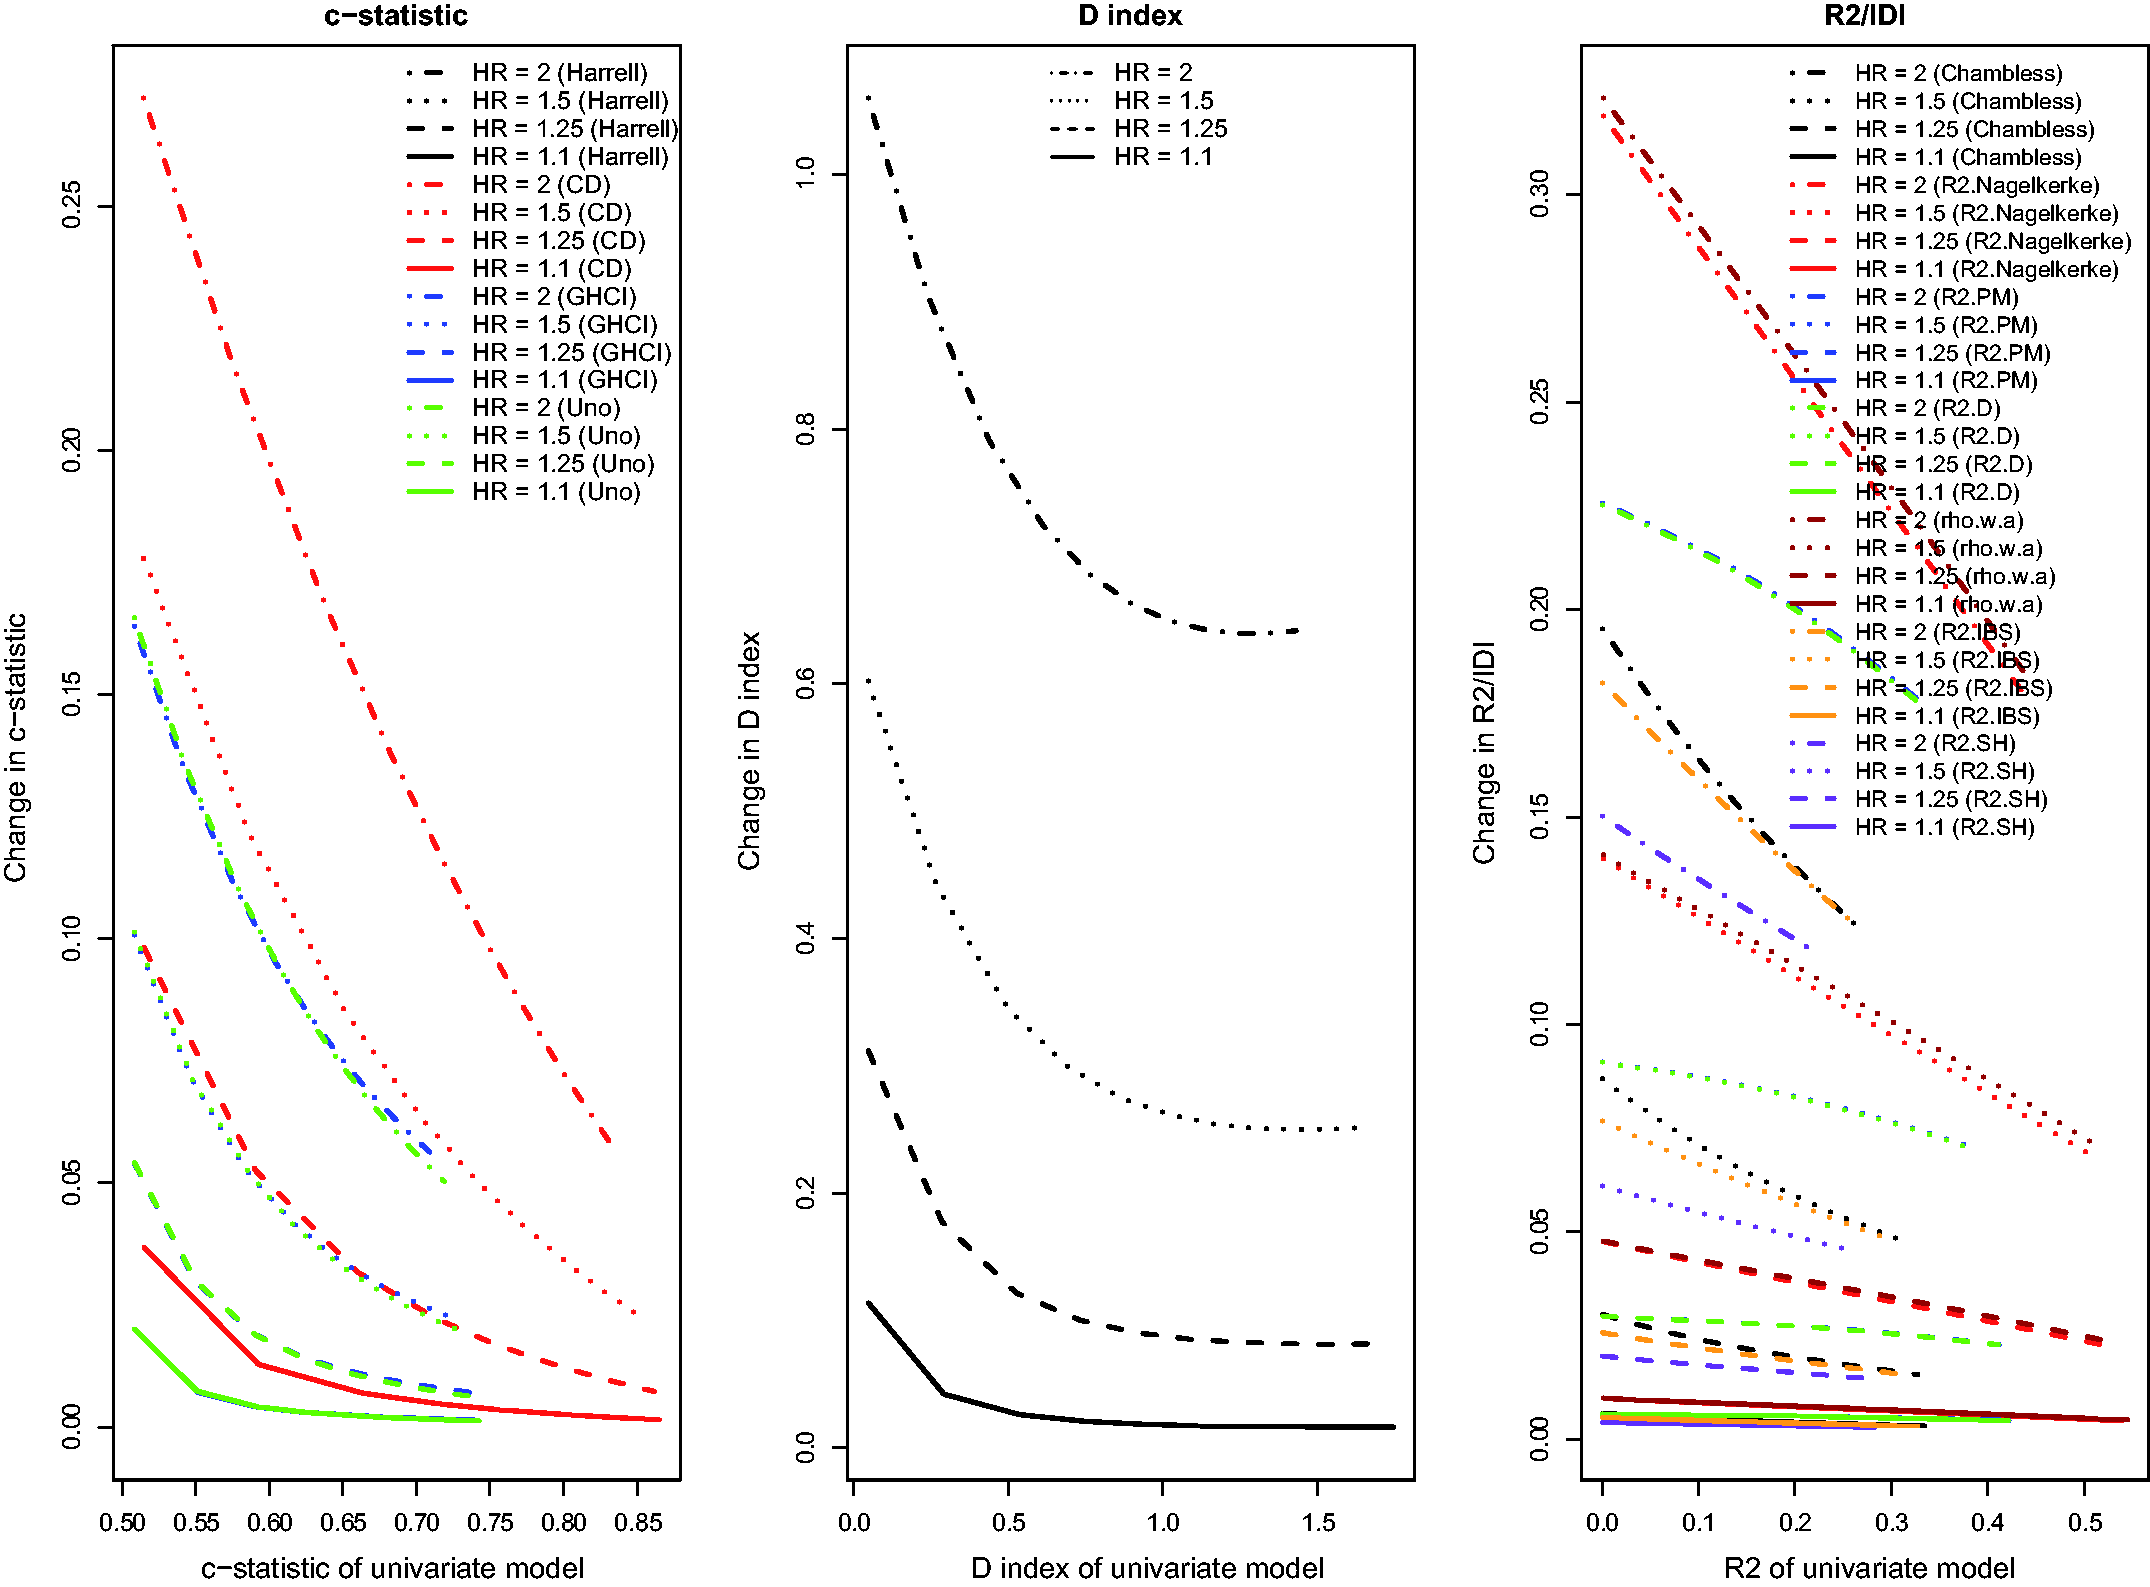
When censoring was due to study dropout, rather than to administrative censoring, results tended to be qualitatively similar, with only minor deviations from those described in the previous paragraph. When censoring was due to study dropout, absolute increases in the concordance indices tended to be modestly greater compared to when censoring was due to administrative censoring. When censoring was due to study dropout, the performance of AUC(H), AUC(Uno), and the GHCI were similar to one another, while AUC(CD) tended to display greater changes in discrimination due to the addition of the continuous novel risk factor than did the other concordance measures. Furthermore, when censoring was due to study dropout,
5 Case study
We provide a brief case study to compare the change in different measures of model performance when a risk factor is added to an existing Cox proportional hazards regression model. The sample consisted of patients hospitalized with heart failure and the survival outcome was time to death, with patients censored after 365 days of follow-up.
The Enhanced Feedback for Effective Cardiac Treatment (EFFECT) Study was a cluster randomized trial intended to improve the quality of care for patients with cardiovascular disease in Ontario, Canada.36,37 During the first phase of the study, detailed clinical data on patients hospitalized with heart failure between 1 April 1999 and 31 March 2001 at 103 hospitals in Ontario, Canada were obtained by retrospective chart review. Data on patient demographics, vital signs and physical examination at presentation, medical history, and results of laboratory tests were collected. Subjects with missing data on continuous baseline covariates necessary to estimate the risk score were excluded from the current case study, leaving 8635 patients for analysis.
We considered two variables for predicting the hazard of death over the 365 days subsequent to hospital admission. The first predictor variable was patient age. The second was the EFFECT-HF mortality prediction score, which is a point-based scoring system for predicting the risk of 30-day and 1-year mortality. 38 The score includes age, respiratory rate, systolic blood pressure, urea nitrogen, sodium concentration, cerebrovascular disease, dementia, chronic obstructive pulmonary disease, hepatic cirrhosis, cancer, and haemoglobin. Importantly, patient age is one of the components of the EFFECT-HF mortality prediction score. The correlation between these two variables was 0.63 in the study sample.
We considered two reference prediction models: the first contained only patient age as a linear variable, while the second contained only the EFFECT-HF score as a linear variable. To each model, we then added the other variable. Thus, we examined the effect of adding patient age to a model that initially consisted of only the EFFECT-HF score, and we examined the effect of adding the EFFECT-HF score to a model that initially consisted of only patient age. For each of the Cox proportional hazard regression models, we computed the performance measures described in Section 2. We determined the change in each measure of model performance when the second variable was added to the existing prediction model. All of the time-varying measures of model performance were assessed at 365 days (the time at which all subjects were subject to administrative censoring). Similarly, the IBS was determined over the 365 days of follow-up.
Performance measures for predicting mortality in patients hospitalized with heart failure.
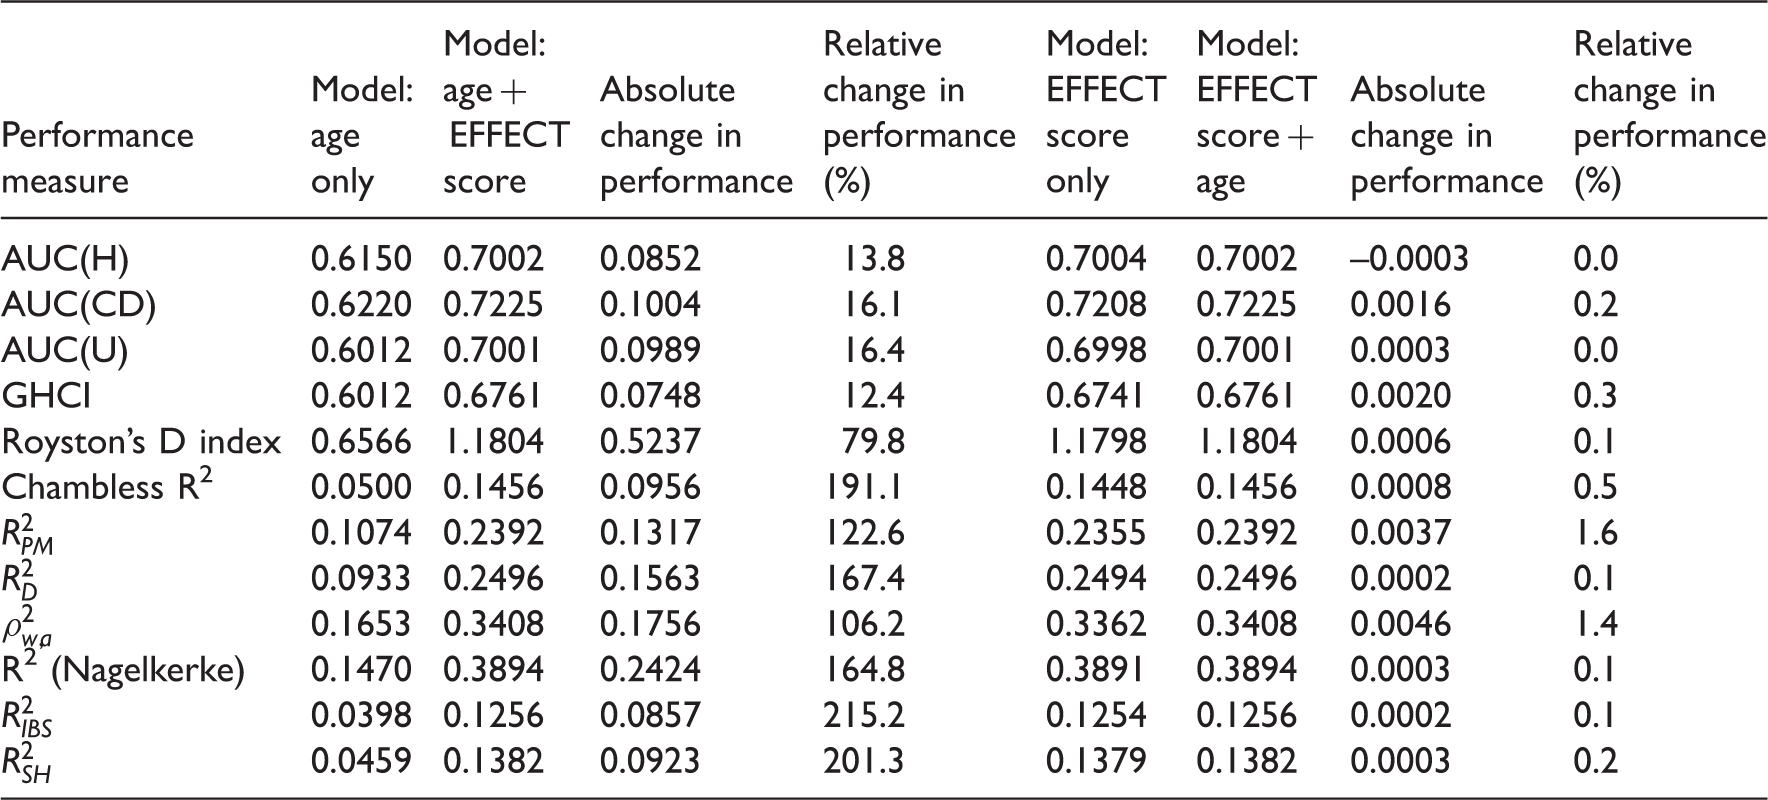
Adding the EFFECT score to a prediction model that consisted of only patient age resulted in substantially larger changes in model performance (range from 0.0748 to 0.5237). Royston’s D displayed the greatest absolute increase when the EFFECT-HF score was added to the model consisting of age alone (0.5237). The changes in the four concordance indices due to the addition of the EFFECT-HF score were similar to one another. The ordering of the absolute change in the four concordance indices was similar to that observed in our simulations (Figure 7): the largest absolute change was observed for AUC(CD), while the smallest absolute change was observed for GHCI concordance index. There was greater disparity in the magnitude of the change in model R2 across the different R2-type measures. The relative change in the four concordance indices ranged from 12.4 to 16.4%, while the relative change in Royston’s D was 80%. The relative change in the different R2-type measures ranged from 106% (
These results are concordant with the results of our simulations. In our simulations, we found that greater improvements in model performance were possible when the reference model had lower predictive accuracy. In examining Table 1, one notes that, across all measures of model performance, the reference model consisting of age had lower predictive accuracy than the reference model consisting of the EFFECT-HF score. Thus, one would anticipate greater improvements in model performance when adding the EFFECT-HF score to the reference model consisting of age alone, compared to when adding age to the reference model that consisted of the EFFECT-HF score. There is a simple explanation for these observations. The EFFECT-HF score incorporates 11 variables, one of which is age. Thus, adding the EFFECT-HF score to a model consisting of age is comparable to incorporating 10 additional covariates to the clinical prediction model. However, adding age to the model consisting of the EFFECT-HF score has a minimal effect since the existing score already incorporates the effect of age on the hazard of the outcome.
6 Discussion
We used an extensive set of Monte Carlo simulations to explore changes in measures of model performance for Cox proportional hazards models when a novel risk factor or marker was added to an existing regression model. We summarize our findings in two separate sets of conclusions. The first set of conclusions pertains to factors that influence the sensitivity of a measure of model performance to the inclusion of a novel risk factor or marker. The second set of conclusions pertains to comparing the relative sensitivity of different measures of model performance to the inclusion of a novel risk factor or marker.
In examining factors that influence the sensitivity of a measure of model performance to the inclusion of a novel risk factor, several observations merit mention. First, the increase in predictive accuracy due to the inclusion of a novel risk factor tended to decrease as the predictive accuracy of the reference Cox proportional hazards regression model increased. Second, the magnitude of the increase in predictive accuracy due to the inclusion of a novel risk factor increased as the hazard ratio associated with this novel risk factor increased. Third, the increase in predictive accuracy due to the inclusion of a binary risk factor increased as the prevalence of the binary risk factor increased. The above findings were observed to hold for all measures of predictive accuracy examined: concordance indices, Royston’s D index, and R2-type measures. In some settings (low event rate and administrative censoring), Chambless’ R2,
In comparing the relative sensitivity of different measures of model performance to the inclusion of a novel risk factor, several observations merit mention. First, we observed that improvements in AUC(H) were essentially identical to improvements in AUC(U). Thus, in settings reflective of those that we considered in our simulations, these two estimators should result in similar conclusions about the incremental benefit of novel risk factors or markers. Second, the behaviour for Chambless’ adaptation of the IDI tended to be less consistent with those of the other measures of model performance. In particular, in some scenarios, the behaviour of Chambless’ adaptation of IDI was different from that of the majority of R2-type measures and from the concordance indices and from Royston’s D. In some instances, the magnitude of the IDI increased as the performance of the reference model increased. This suggests that further attention needs to be focussed on Chambless’ time-varying definition of R2. Given differences in performance between this estimate and that of most of the other R2-type measures, further research is required to explore its properties.
Some secondary observations include that the improvements in predictive accuracy and the accuracy of the reference regression model were no longer strictly decreasing when the novel binary risk factor was correlated with the existing continuous risk factor. Instead, the relations were somewhat jagged. A similar phenomenon was observed in our prior study.
3
In that prior study, when a novel binary risk factor was added to an existing logistic regression model, and when the novel risk factor was correlated with the existing continuous risk factor, then the relation between the change in accuracy (using either the c-statistic or Nagelkerke’s R2 statistic) and the accuracy of the reference logistic regression model displayed a similar jaggedness. The similarity of this finding in both in settings with binary outcomes and in settings with time-to-event outcomes suggests that this issue needs to be examined in greater detail in subsequent research on the mathematical properties of these estimators. However, this is beyond the scope of the current study. Finally, Chambless’ R2,
A limitation of the current study is that we have focussed exclusively on the setting in which a single novel risk factor or marker is added to an existing reference clinical prediction model. This was done to reflect what we perceive to be the most common scenario in research on novel risk factors and markers. Our methods could easily be extended to examine multiple novel risk factors or markers. One would need to consider several factors in a multi-factorial design: (i) the correlation between the different novel risk factors or markers, (ii) the magnitude of the independent effect of each novel risk factor on the hazard of the outcome, and (iii) the prevalence of each of the novel risk factors or markers. We see no reason to anticipate why the sensitivity of the different performance measures would differ in the setting of multiple novel risk factors.
Many of the above observations have important consequences for researchers seeking to appraise novel risk factors or markers (e.g. genetic factors, biomarkers, lifestyle characteristics, or patient characteristics) that add prognostic information above and beyond that contained in conventional clinical prediction models when outcomes are time-to-event in nature. First, identification of risk factors that have a stronger etiological effect (i.e. that have a larger hazard ratio) will result in greater improvements in predictive accuracy, provided that these hazard ratios relate to predictor variables that have the same distribution. One way to achieve comparability in hazard ratios is by standardizing the predictor so that it has unit variance, or letting the hazard ratio refer to the 75 versus 25 percentile.10,11 Second, identification of binary risk factors that are common or have higher prevalence in the population will result in greater improvements in predictive accuracy. 39 Third, greater improvements in absolute estimates of predictive accuracy can be expected in settings in which existing risk prediction models have low predictive accuracy. For fair comparisons, investigators should use the best existing model as the reference model to avoid overstating the incremental benefit of novel risk factors and markers. 40 Similarly, reviewers and readers should ascertain whether published studies have used the best available model as the reference model. Of note, studies should be sufficiently large for unbiased estimation of performance, since overfitting will cause upward bias in larger models where relatively many factors are included in the model.10,41,42 Finally, studies with longer durations of follow-up (and thus with a higher observed event rate) will allow for greater increases in concordance due to the inclusion of a novel risk factor than studies with shorter duration of follow-up (and thus with a lower observed event rate).
One of the key conclusions is that the findings of the current study are largely similar to those of a previous study that compared changes in predictive accuracy when novel risk factors or markers are added to logistic regression models for predicting binary outcomes. 3 The similarities of the current findings with those from the prior study suggest that these findings describe underlying properties of the relations between the characteristics of different risk factors and improvements in predictive accuracy. It is important to note that consistent findings were observed regardless of the nature of the outcome (survival versus binary) and regardless of the measure of predictive accuracy that was used. Thus, the suggestions for biomedical researchers provided in the paragraph above are likely to be relevant regardless of the nature of the outcome of interest or of how predictive accuracy is quantified.
When selecting a measure of model performance, Harrell suggests that, while rank measures (such as concordance indices) may be useful for describing a given prediction model, they may not be very sensitive in choosing between competing models, and that this may be especially true when the models are strong 10 (page 78). Furthermore, he suggests that measures such as R2 are more sensitive. However, he notes that an absolute change in R2 may be difficult to interpret. Similarly, Uno et al. suggested that while c-statistics are commonly used to quantify the predictive ability of clinical prediction models, they are not sensitive for determining the incremental benefit of additional risk factors or markers 9 (page 1113). Furthermore, Uno et al. suggested that using differences in measures of explained variation may be more sensitive in detecting differences in predictive ability. Our findings provide support for these comments: greater increase in predictive accuracy is possible when the reference model has lower predictive accuracy. Concordance measures may, however, be slightly less sensitive to the inclusion of novel risk factors than are R2-type measures. A related issue is the fact that the different measures have different ranges and interpretations. The concordance indices and the R2-type measures are constrained to have values that lie between 0 and 1, but in most reasonable applications, the concordance indices will have values that lie between 0.5 and 1. Royston’s D index does not have this constraint. The absolute increase in a given concordance index is, in most reasonable applications, bounded by 0.5, while there is no such constraint for D. Thus, if the reference model has a high degree of predictive accuracy, there is limited room for improvement with the addition of a new risk factor.
We have examined a wide range of different performance measures for assessing the performance of a Cox proportional hazards regression model: concordance-type statistics, R2-type measures, and Royston’s D. Several of these measures are analogues for survival outcomes of methods developed for continuous or binary outcomes. For instance, concordance-type measures were based upon the c-statistic for binary outcomes. The c-statistic is equivalent to using the area under the ROC curve for logistic regression models. Its use is not without controversy. Lobo et al. have criticized its use on several grounds, including that it ignores the goodness of fit of the model and that it summarizes the test performance over regions of the ROC space it which one would rarely operate. 43 Similarly, Hand criticizes the ROC curve area for ignoring different misclassification costs. 44 Despite these criticisms, we have considered the c-statistic for survival outcomes, as it is one of the most frequently used performance measures in this context. Furthermore, the relationship between the concordance-type measures and the ROC curve is different in the context of survival analysis than is the case for binary outcomes, where the two measures are identical.
We need to emphasize that performance measures such as concordance and explained variability do not reflect correctness of the underlying model.
45
Some may argue that the pragmatic behaviour of a prediction model is most relevant, i.e. its ability to discriminate events from non-events (c statistics) and provide (low and) high risk predictions for (non-)events. Furthermore, the degree of increase in model performance metric is only one of the many criteria that should be considered when deciding if the new variable should be added. Our examination of the relative sensitivity of the different performance measures should not be taken as a suggestion that the most sensitive measure is necessarily the best measure. We suggest that our findings of relative sensitivity be restricted to within-class comparisons. By doing so, one is restricting comparisons between measures that have the same interpretation and that use the same scale. Despite Harrell’s caution described earlier, changes in concordance-type statistics are frequently used to assess the value/usefulness/clinical relevance of adding a novel risk factor to an existing clinical prediction model. Our results indicate that AUC(CD) is slightly more sensitive to inclusion of novel risk factors that is either AUC(H) or AUC(U), which both have nearly identical behaviour to one another, while AUC(GHCI) is the least sensitive of the concordance-type indices. These results suggest that if the focus is on detecting model improvement, then the use of AUC(CD) will have slight benefits. In reviews of different R2-type measures, Choodari-Oskooei et al. recommended that, amongst the different measures of explained randomness, Kent and O’Quigley’s
In summary, of the different concordance indices, Chambless and Diao’s concordance index displays changes of a greater magnitude when a novel risk factor is added to an existing reference model. Furthermore, it displayed consistent and stable behaviour across the range of simulated settings. Of the different R2-type measures, O’Quigley et al.’s modified Nagelkerke R2 index and Kent and O’Quigley’s
Footnotes
Declaration of conflicting interests
The author(s) declared no potential conflicts of interest with respect to the research, authorship, and/or publication of this article.
Funding
The author(s) disclosed receipt of the following financial support for the research, authorship, and/or publication of this article: This study was supported by the Institute for Clinical Evaluative Sciences (ICES), which is funded by an annual grant from the Ontario Ministry of Health and Long-Term Care (MOHLTC). The opinions, results, and conclusions reported in this paper are those of the authors and are independent from the funding sources. No endorsement by ICES or the Ontario MOHLTC is intended or should be inferred. This research was supported by an operating grant from the Canadian Institutes of Health Research (CIHR) (MOP 86508). Dr Austin is supported in part by a Career Investigator award from the Heart and Stroke Foundation. Dr Steyerberg is supported in part by the Center for Translational Molecular Medicine (PCMM project) and a U-award (AA022802). The Enhanced Feedback for Effective Cardiac Treatment (EFFECT) data used in the study was funded by a CIHR Team Grant in Cardiovascular Outcomes Research. These datasets were linked using unique, encoded identifiers and analysed at the Institute for Clinical Evaluative Sciences (ICES).
References
Supplementary Material
Please find the following supplemental material available below.
For Open Access articles published under a Creative Commons License, all supplemental material carries the same license as the article it is associated with.
For non-Open Access articles published, all supplemental material carries a non-exclusive license, and permission requests for re-use of supplemental material or any part of supplemental material shall be sent directly to the copyright owner as specified in the copyright notice associated with the article.