
Abstract
For the analysis of time-to-event data, frequently used methods such as the log-rank test or the Cox proportional hazards model are based on the proportional hazards assumption, which is often debatable. Although a wide range of parametric and non-parametric methods for non-proportional hazards has been proposed, there is no consensus on the best approaches. To close this gap, we conducted a systematic literature search to identify statistical methods and software appropriate under non-proportional hazard. Our literature search identified 907 abstracts, out of which we included 211 articles, mostly methodological ones. Review articles and applications were less frequently identified. The articles discuss effect measures, effect estimation and regression approaches, hypothesis tests, and sample size calculation approaches, which are often tailored to specific non-proportional hazard situations. Using a unified notation, we provide an overview of methods available. Furthermore, we derive some guidance from the identified articles.
Introduction
In clinical studies with time-to-event outcomes, it is commonly assumed that the hazard functions of the treatment groups are proportional. However, several scenarios can lead to non-proportional hazards (NPHs). Figure 1(a) and (b) illustrate the hazard ratio (HR) of a delayed and a diminishing treatment effect, respectively. A delayed treatment effect for the experimental arm can also lead to crossing hazards (see Figure 1(c)) if the comparator is an active treatment with an immediate response as is often the case in trials concerning immuno-oncology drugs. Other scenarios of crossing hazards are experiments where the treatment effect is non-homogeneous across subgroups, i.e. if the treatment is harmful in a subgroup but beneficial in its complement. 1 NPH can also occur in settings with long-term survivors in one treatment arm or if there is treatment switching to another arm after disease progression on the original arm.
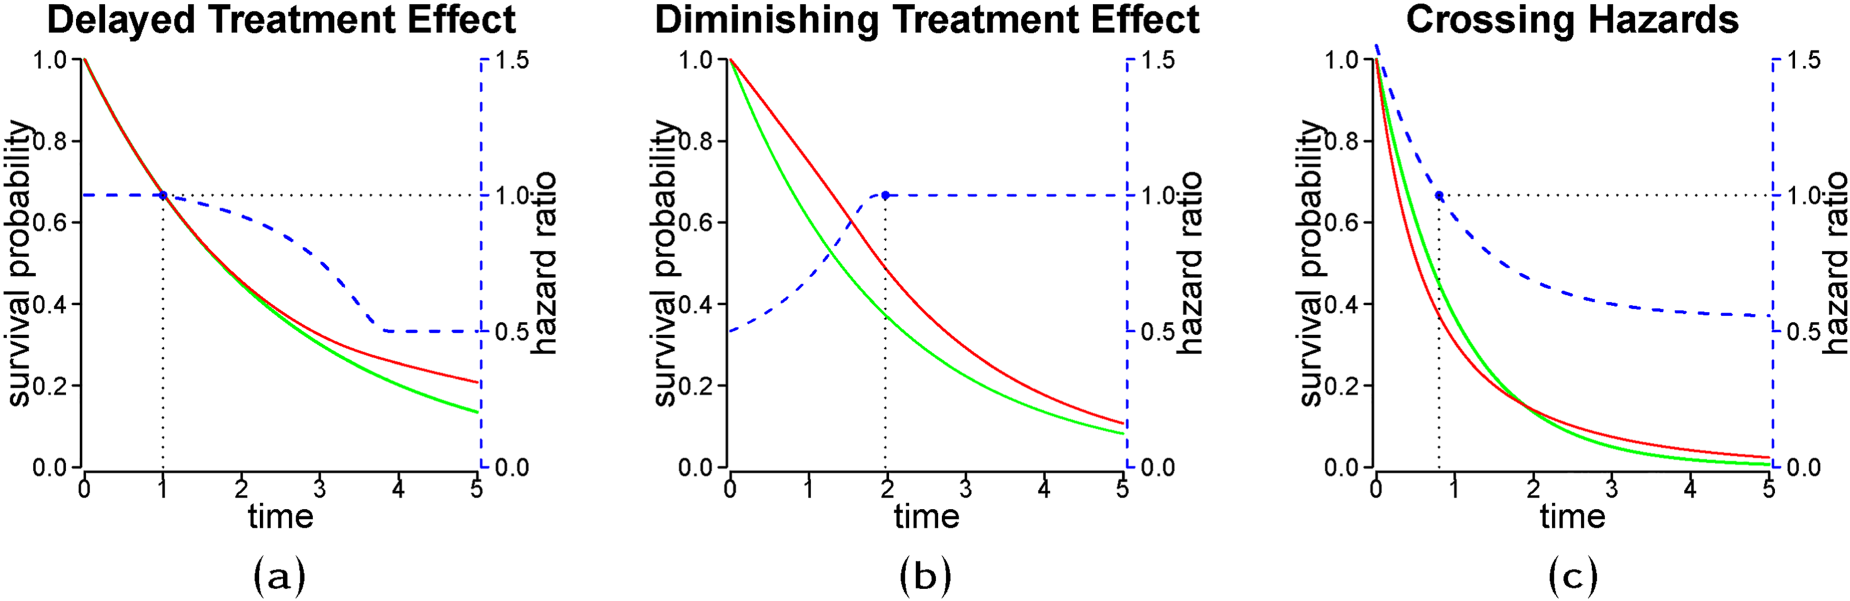
Stylized non-proportional hazard (NPH) treatment effect scenarios with hazard ratio (blue dashed line) and corresponding survival curves (red and green solid lines). The green line represents the reference group. The dotted line with black solid points refers to the time when the hazard ratio is equal to
Under proportional hazards (PHs), comparisons of HRs or cumulative hazard ratios (cHR) result in equivalent conclusions, whereas under NPH these results may vary substantially. Standard statistical tests for the comparison of time-to-event outcomes between groups such as the log-rank test or tests based on Cox regression models are not optimal for detecting relevant differences under NPH. Additionally, the HR estimate of the standard Cox regression model, a commonly used effect measure, is neither robust nor meaningful under NPH. 2 In contrast to PH, the interpretation of estimates of a specific effect measure, such as the HR or the cHR, depend on the follow-up considered for evaluation in the presence of NPH.
Well-established methods for time-to-event data are available when the PH assumption holds. However, there is no consensus on best practices under NPH. Moreover, approaches to deal with NPH are not globally optimal but depend on the specific NPH scenario. A variety of parametric and non-parametric methods for treatment effect estimation and hypothesis testing in NPH settings have been proposed. We aim to identify statistical methods and, if available, the corresponding software that is suitable for NPH. In contrast to other overview articles that focus on specific disease areas (e.g., oncology 1 ), NPH patterns (e.g., switching treatment 3 ), or specific methods (e.g., statistical testing4,5), the scope of this literature review is broader and based on a systematic approach to identifying relevant literature. The remainder of this paper is organized as follows. In Section 2, we show the relevance of scenarios with NPH by investigating reconstructed data from a clinical trial. In Section 3, we describe the literature search, data extraction and summarize the quantitative results of the review. The identified approaches are presented in a common notation, which can be found in Section 4, where we focus on NPH for the treatment indicator. We categorize and discuss approaches to estimate and model treatment or covariate effects under NPH in Section 5. Testing and sample size calculation approaches under NPH are discussed in Section 6. We compare the flexibility of the proposed methods presented in Sections 5 and 6 on theoretical grounds and highlight results of conducted comparison studies if available. Finally, we summarize and discuss the findings in Section 7. The Appendix A provides more detailed information on the literature search and data extraction. The Online Supplement S provides more detailed information on the estimation and testing approaches identified as appropriate for NPH.
Borghaei et al.
6
report a phase 3 trial comparing the effect of nivolumab versus docetaxel in nonsquamous non-small lung cancer concerning overall survival. For illustration, we consider the study’s secondary endpoint, progression-free survival (PFS). Using the webplotdigitizer
7
and the method described in Guyot et al.,
8
we reconstructed the individual patient data by digitizing the Kaplan-Meier (KM) estimates of the survival functions. During follow-up,
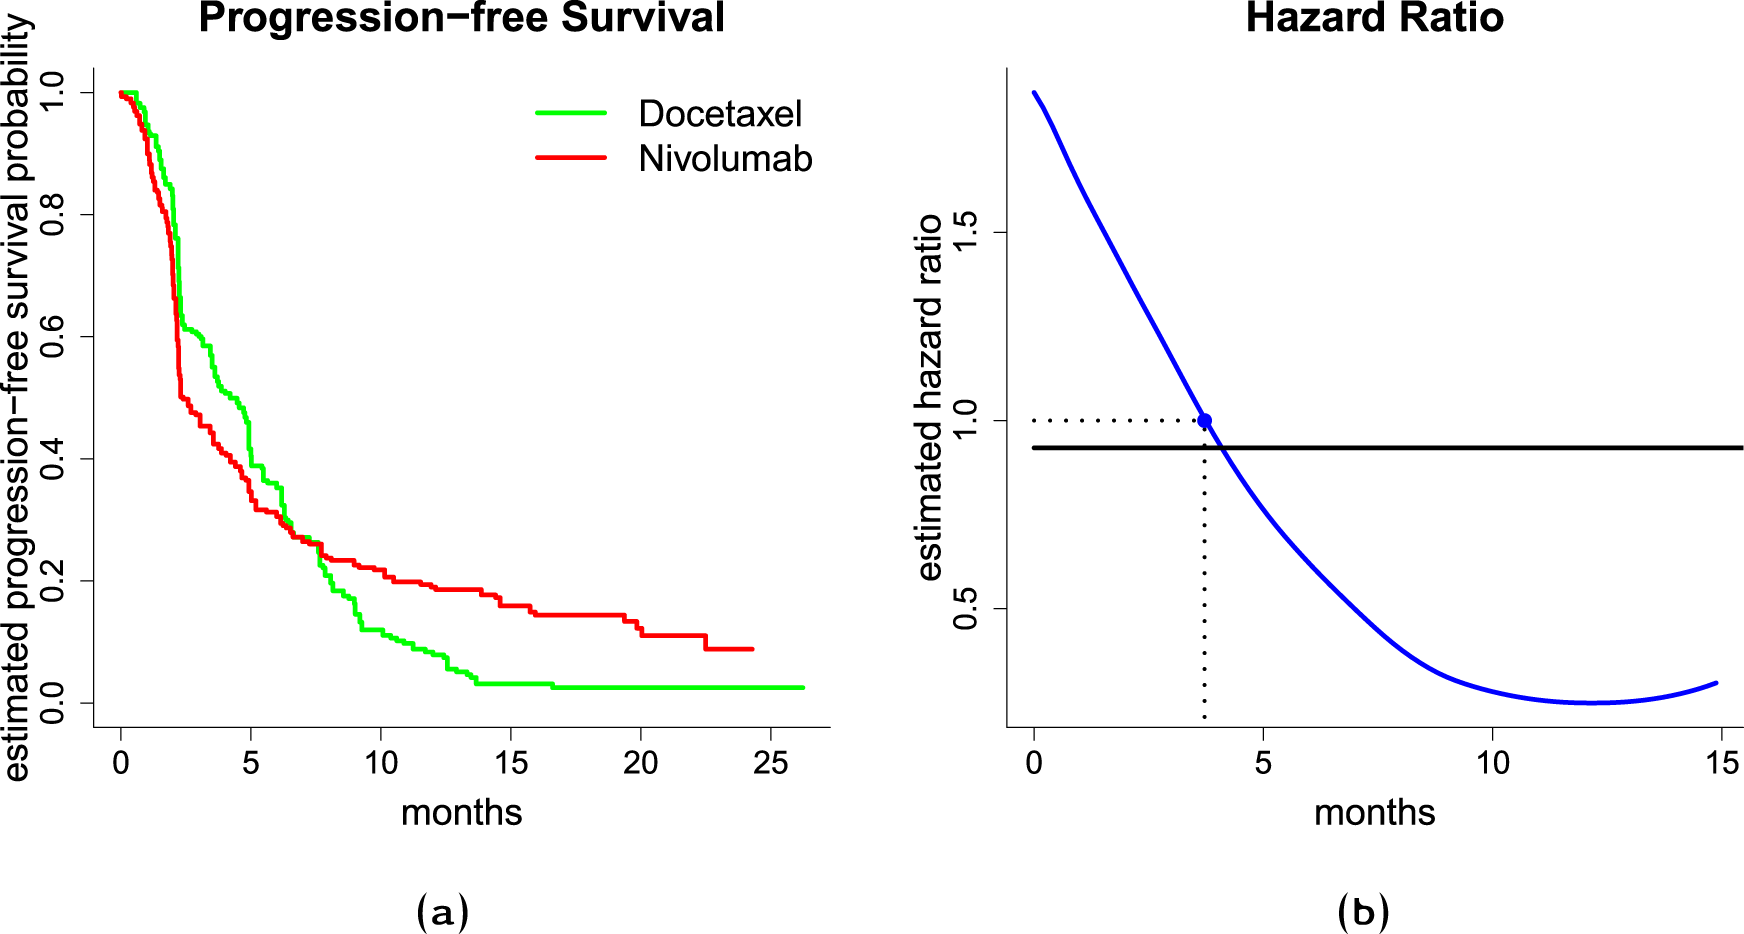
(a) Left-hand side figure shows Kaplan-Meier estimates of the survival function, (b) and right-hand side figure shows estimated hazard ratio. The solid blue line is an estimate of the time-varying hazard ratio obtained through smoothing the increments of the Nelson-Aalen estimate of the cumulative hazard function, the solid black line is an estimate from the Cox PH model, the dotted line with a blue solid point indicates a hazard ratio of 1, i.e. the time point, where the estimated hazard rates are equal.
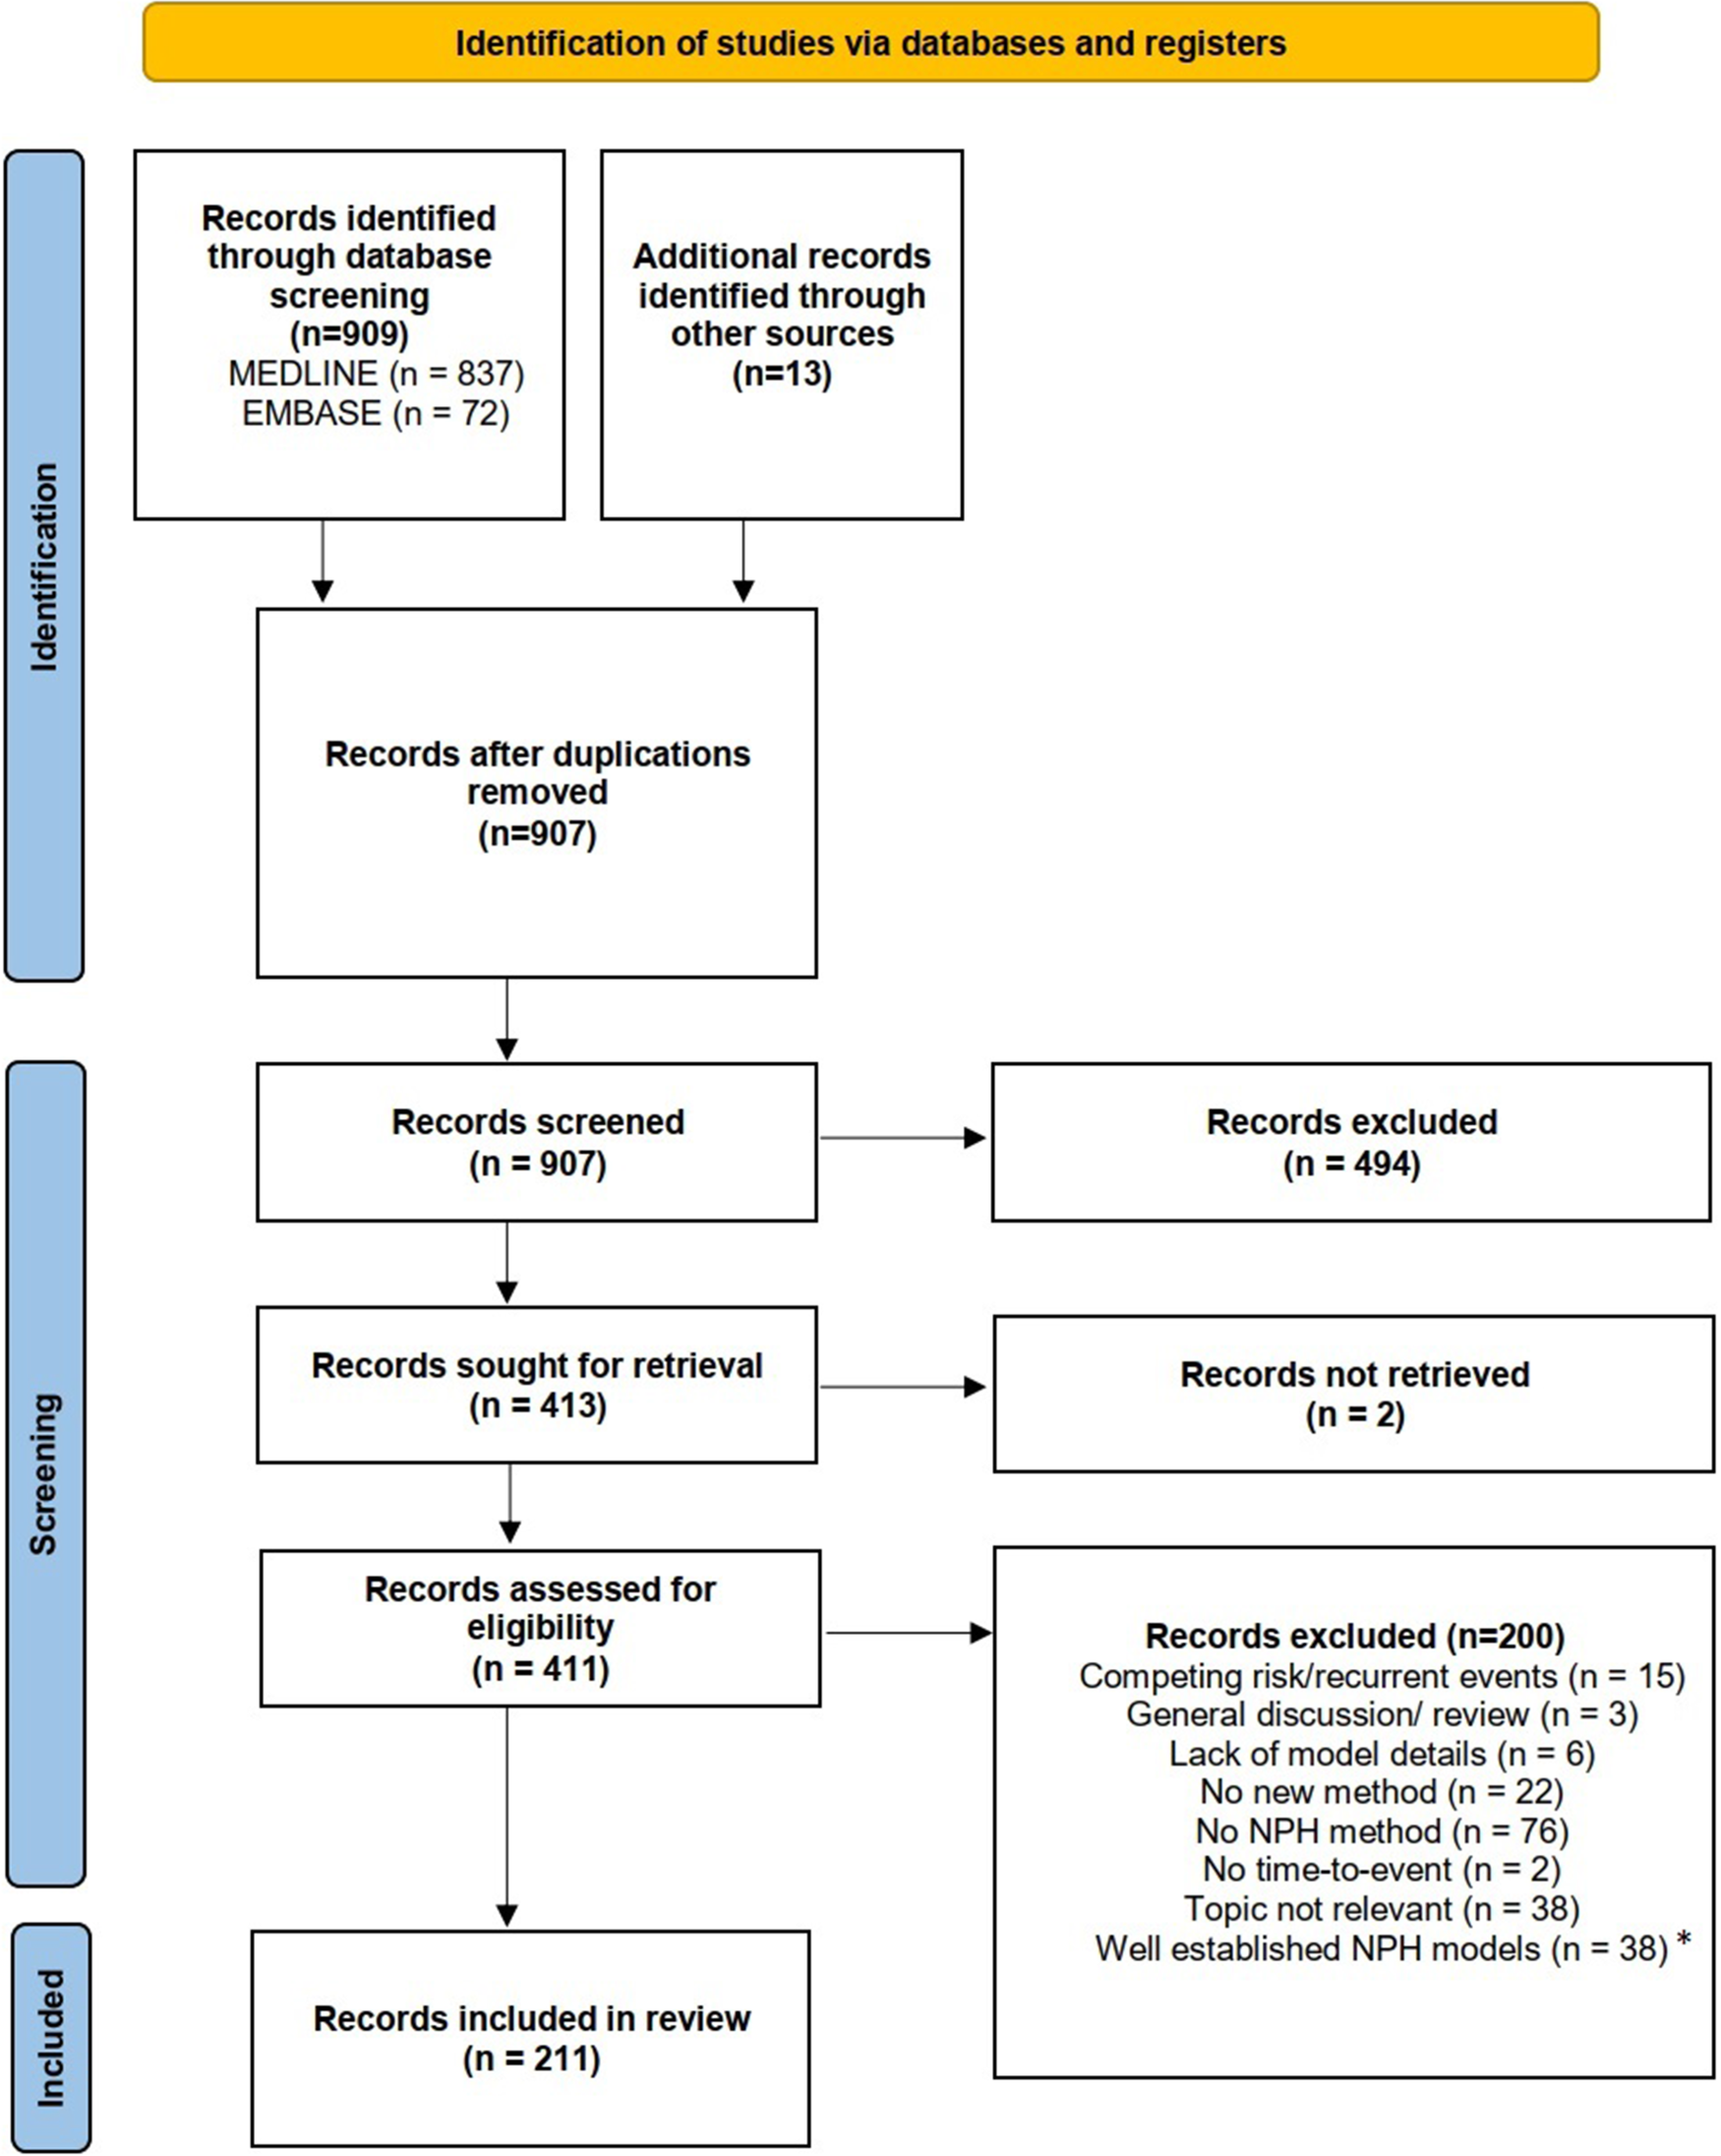
We performed a comprehensive literature search using two electronic databases, MEDLINE and EMBASE, on March 15th, 2022. Details on the literature search and the data extraction are provided in Appendix A.1. In total 907 articles were identified, which were screened for eligibility. After the abstract screening and retrieval of full texts, a total of 411 articles were assessed for eligibility. In total, 200 articles (49%) were excluded. The most frequent reason for exclusion was that the articles neither developed nor applied any NPH method. The final analysis included 211 publications, see PRISMA flow chart in Figure 3. The complete list of included articles is available in Table S5 of the Online Supplement.
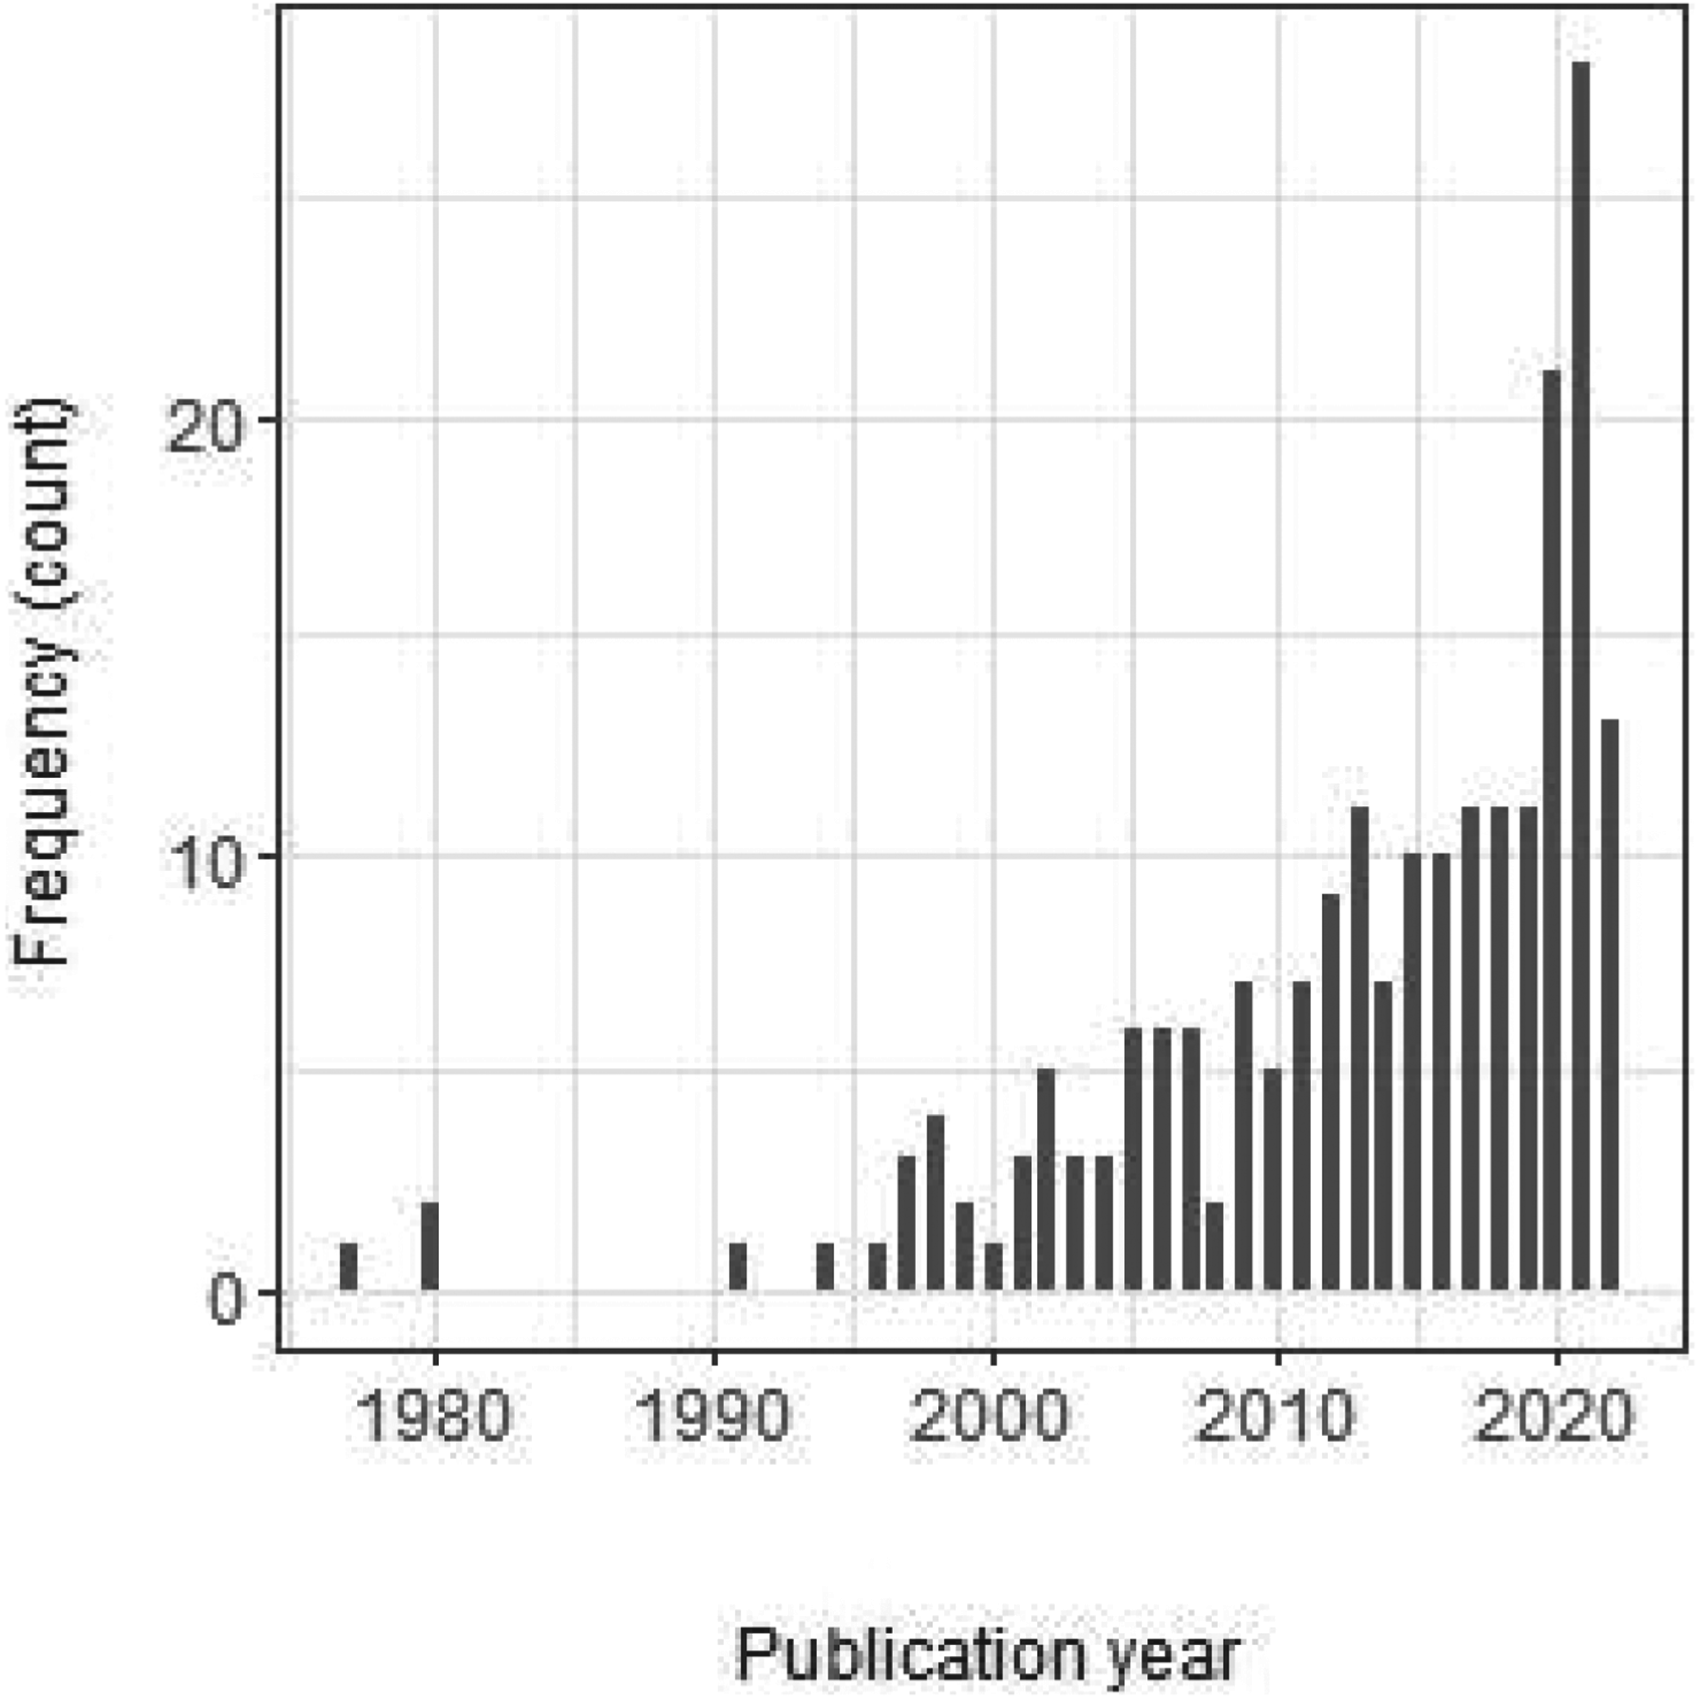
Publication year of the 211 included articles. Note that the number for 2022 is based on the articles published until 15th March 2022 and is therefore incomplete.
Absolute and relative frequencies of publications discussing a method class.
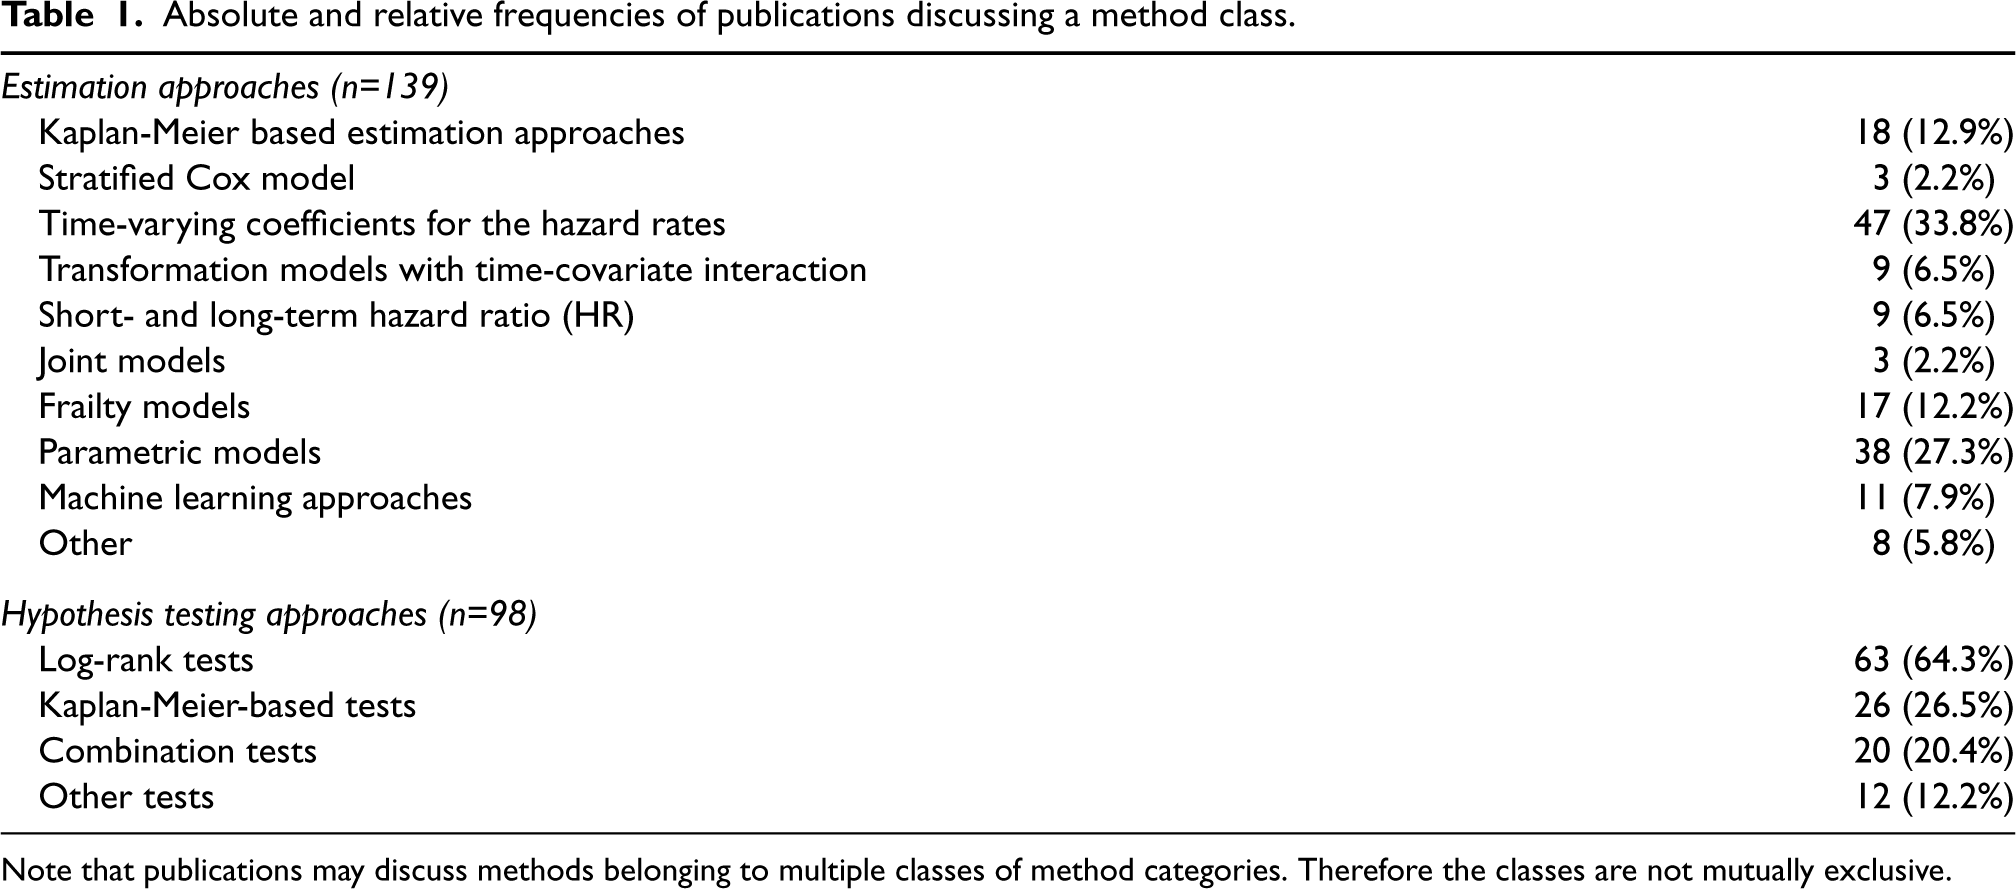
Note that publications may discuss methods belonging to multiple classes of method categories. Therefore the classes are not mutually exclusive.
The vast majority of articles (
The literature review identified articles covering different aspects of survival analysis in NPH settings. We identified articles proposing new test statistics for testing whether the survival is different in two treatment groups, as well as articles proposing new effect measures or regression models for quantifying the treatment effect in settings violating the common PH assumption.
In 72 out of 211 (34%) articles freely accessible software is provided. Another 13% of the articles provide the code for the methods upon request. Software was considered to be freely available code in form of e.g. R packages, code snippets given in the text, or freely accessible code (e.g. supplement of article or online repository). Additionally, publicly available code or code snippets for commercial software are also categorized as freely available although the software needed to run the code is not freely available. Code snippets published in the articles sometimes implement only specific features or are used to deepen the understanding of the methods. Moreover, the code snippets are usually intended to enable users to apply the methods proposed. Simulation studies are reported in 158 (75%) articles. This is more pronounced in articles considering testing procedures, where 86 out of 98 (88%) papers provide simulation studies. For 91 out of 139 (65%) papers that focus on estimation procedures simulation studies are provided.
Before we proceed with describing the method categories according to Table 1, we introduce the notation that is used throughout this paper and the supplement. We also define the identified treatment effect measures.
Notation
The number of subjects included in a trial is denoted by
Table S1 of the Supplement gives an overview of the used notation and the quantities defined in Section 4.2.
Effect measures
The treatment effect can be quantified, e.g., by the difference or ratio of the survival function at a chosen landmark time
A summary effect measure considers the entire survival curve (within the interval
The restricted mean survival time (RMST) is the mean survival time within the time period [0,
In a NPH setting summary effect measures do not cover the dynamics of treatment efficacy and hence, do not necessarily deliver an adequate picture of the nature of the treatment effect over time. See Dehbi et al. 20 for a discussion and potential remedy that relies on calculating more than one summary effect measure over varying time ranges.
For a comprehensive description of the survival distribution, the group-specific quantities
Effect measures unconditional of covariates
Estimation approaches for NPH treatment effects
This section describes the categories of identified estimation approaches for NPH treatment/covariate effects. The first column of Table 2 shows the main categories as introduced in Table 1. Some categories are divided into sub-categories given in the second column of Table 2. The third column of Table 2 provides a brief description of the methods. References to the Supplement are given in the first two columns of Table 2, where a more detailed overview can be found. In the corresponding section of the Supplement, references to Table S3 are given. In Table S3 of the Online Supplement, each paper that was considered in this literature review is allocated into one or more sub-categories according to Table 2, indicating the paper’s main contribution to address NPHs. Table S3 (column K) also provides information on whether the corresponding paper took a Bayesian estimation approach or not. The degree of detail and information given is hierarchical: Table 2 gives an overview, the referenced sections in the Online Supplement provide more detailed explanations including model formulas and a discussion of the literature, whereas Table S3 in combination with the respective papers (and the references therein) provide full information on the specific approaches to cope with NPH that we detected in the literature.
Overview of methods suitable to estimate NPH effects.
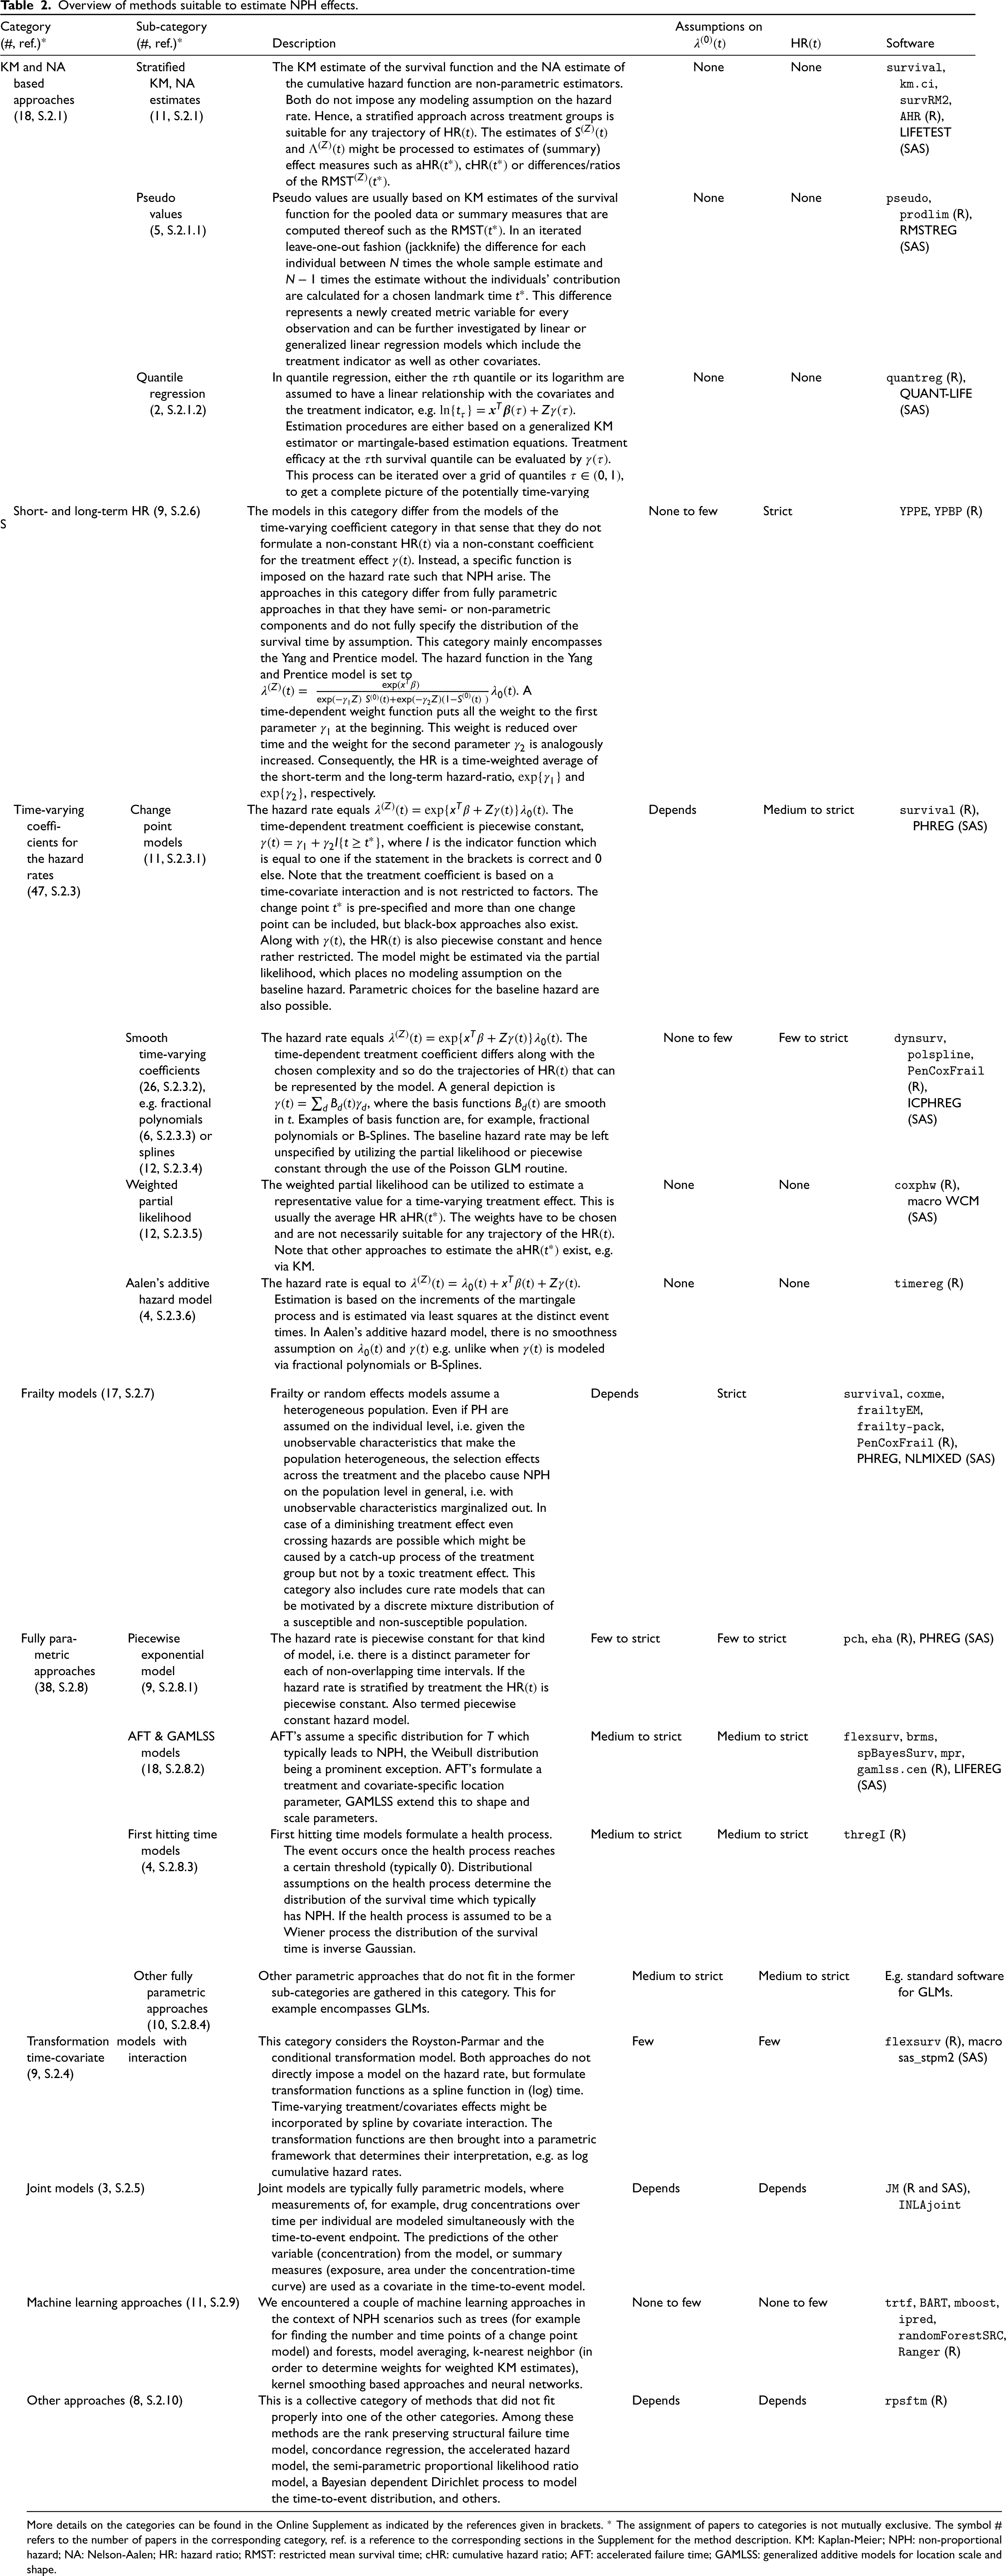
Overview of methods suitable to estimate NPH effects.
More details on the categories can be found in the Online Supplement as indicated by the references given in brackets. * The assignment of papers to categories is not mutually exclusive. The symbol # refers to the number of papers in the corresponding category, ref. is a reference to the corresponding sections in the Supplement for the method description. KM: Kaplan-Meier; NPH: non-proportional hazard; NA: Nelson-Aalen; HR: hazard ratio; RMST: restricted mean survival time; cHR: cumulative hazard ratio; AFT: accelerated failure time; GAMLSS: generalized additive models for location scale and shape.
The fourth and fifth columns of Table 2 give a simplified impression of how flexible the corresponding approach is with respect to patterns of the hazard rate
Note that the fourth and fifth columns of Table 2 is a statement about the flexibility of each method in accommodating varying scenarios of hazard rate functions (column 4) and time-varying HRs (column 5). Especially column 5 describes the capability of the methods to cope with varying NPH scenarios. However, this is not a statement as to whether estimates of the hazard rates and
The last column of Table 2 gives examples of software, including R-packages and SAS procedures, that are available for the groups of methodological approaches described.
Approaches with no or few assumptions on
Stratification along the treatment indicator is a general tool to relax assumptions on the underlying estimation procedure. A stratified KM estimation approach along the treatment and placebo (comparator) group is suitable for any two possible trajectories of
Procedures with limited flexibility on
The short- and long-term HR model introduced by Yang and Prentice
23
is a suitable choice among the less flexible methods. The model moves the HR from an initial value
For the change point model, a delayed or diminishing treatment effect as well as crossing hazards can be modeled by a single change point. More complex NPH scenarios might be accommodated by multiple change points, where Xu and Adak 2 provide a tree-based method to determine the number and position of change points.
Furthermore, the accelerated failure time (AFT) model and its generalizations that also include covariates in the scale and shape parameters are a suitable choice. Note that the restrictions imposed on the
The assumption of a homogeneous population or a homogeneous treatment effect can be dropped by utilizing frailty models. Both scenarios will typically lead to NPH on the population level, i.e. irrespective of individual, unobservable characteristics.25,26 Individual heterogeneity might even lead to crossing hazards on the population level if the treatment effect is beneficial but diminishing on the conditional level. This is caused by a catch-up process at later times of high-frail individuals from the treatment group who tend to survive longer due to the beneficial treatment.27,p.252 It also highlights that a population
Empirical comparisons of NPH regression and estimation methods with simulated or real data without introducing new methodology have been rare in our literature review. Indeed, most papers provided simulation studies. However, giving recommendations on NPH methods based on the simulation studies is difficult for two reasons. Firstly, the simulation scenarios and procedures subject to investigation differ across the papers. Hence, an aggregated result is hard if not impossible to obtain from the existing simulation studies. Secondly, the simulation scenarios could have been chosen to demonstrate superiority of the new method. 28
Based on the frequency of the methods in our literature review, time-varying coefficients for the hazard rates are the most typical choice for incorporating NPH covariate/treatment effects. Within that category, the
A review and simulation study on the
An investigation of weights in the context of weighted partial likelihood estimation of the
From a theoretical point of view Rauch et al.
17
also note that the partial likelihood estimate of the
A comparison of a (reduced rank) time-varying coefficient, gamma frailty, relaxed Burr, and a cure-rate model to real-world breast cancer data was conducted by Perperoglou et al. 29 The authors emphasize interpretational differences across those models that might highlight different features of the data. In this sense, the time-varying coefficient model reveals the nature of the covariate effect, but it is not able to shed light on individual heterogeneity as the frailty model does. They conclude, that the specific research question should guide the model choice. Furthermore, the authors observe small differences in survival curves in their application and argue that the choice of how to tackle NPH is less important as long as the models are flexible enough for the data at hand.
For the design and analysis of randomized controlled trials with time-to-event outcomes hypothesis tests for equality of survival curves from experimental and control treatment (
Moreover, null hypotheses based on summary effect measures, e.g.,
Table S4 gives an overview of the used null hypothesis in the articles focusing on hypothesis tests. We classified whether the null hypothesis was defined as equality of survival, less or equal survival in the experimental arm, or whether it was an average-based hypothesis.
Under the assumption of PH the log-rank test is the standard procedure. However, if the PH assumption does not hold, power is reduced and the alternative hypothesis cannot necessarily be interpreted as treatment benefit. Moreover, rejecting the null hypothesis
For situations in which the PH assumption may not hold, alternative hypothesis tests and sample size calculation approaches have been proposed, which we identified in the literature review.
In our literature review, we identified three categories of hypothesis tests for the above-mentioned null hypotheses in NPH scenarios: Log-rank tests, KM-based tests, and combination tests. Table 3 gives an overview of these different types of tests and provides examples for software, e.g. R-packages or SAS procedures. Additionally, Table S2 shows in which categories the identified articles fall. Table S4 provides an overview of whether the identified articles consider approaches for sample size calculation.
Overview of hypothesis tests for NPH.
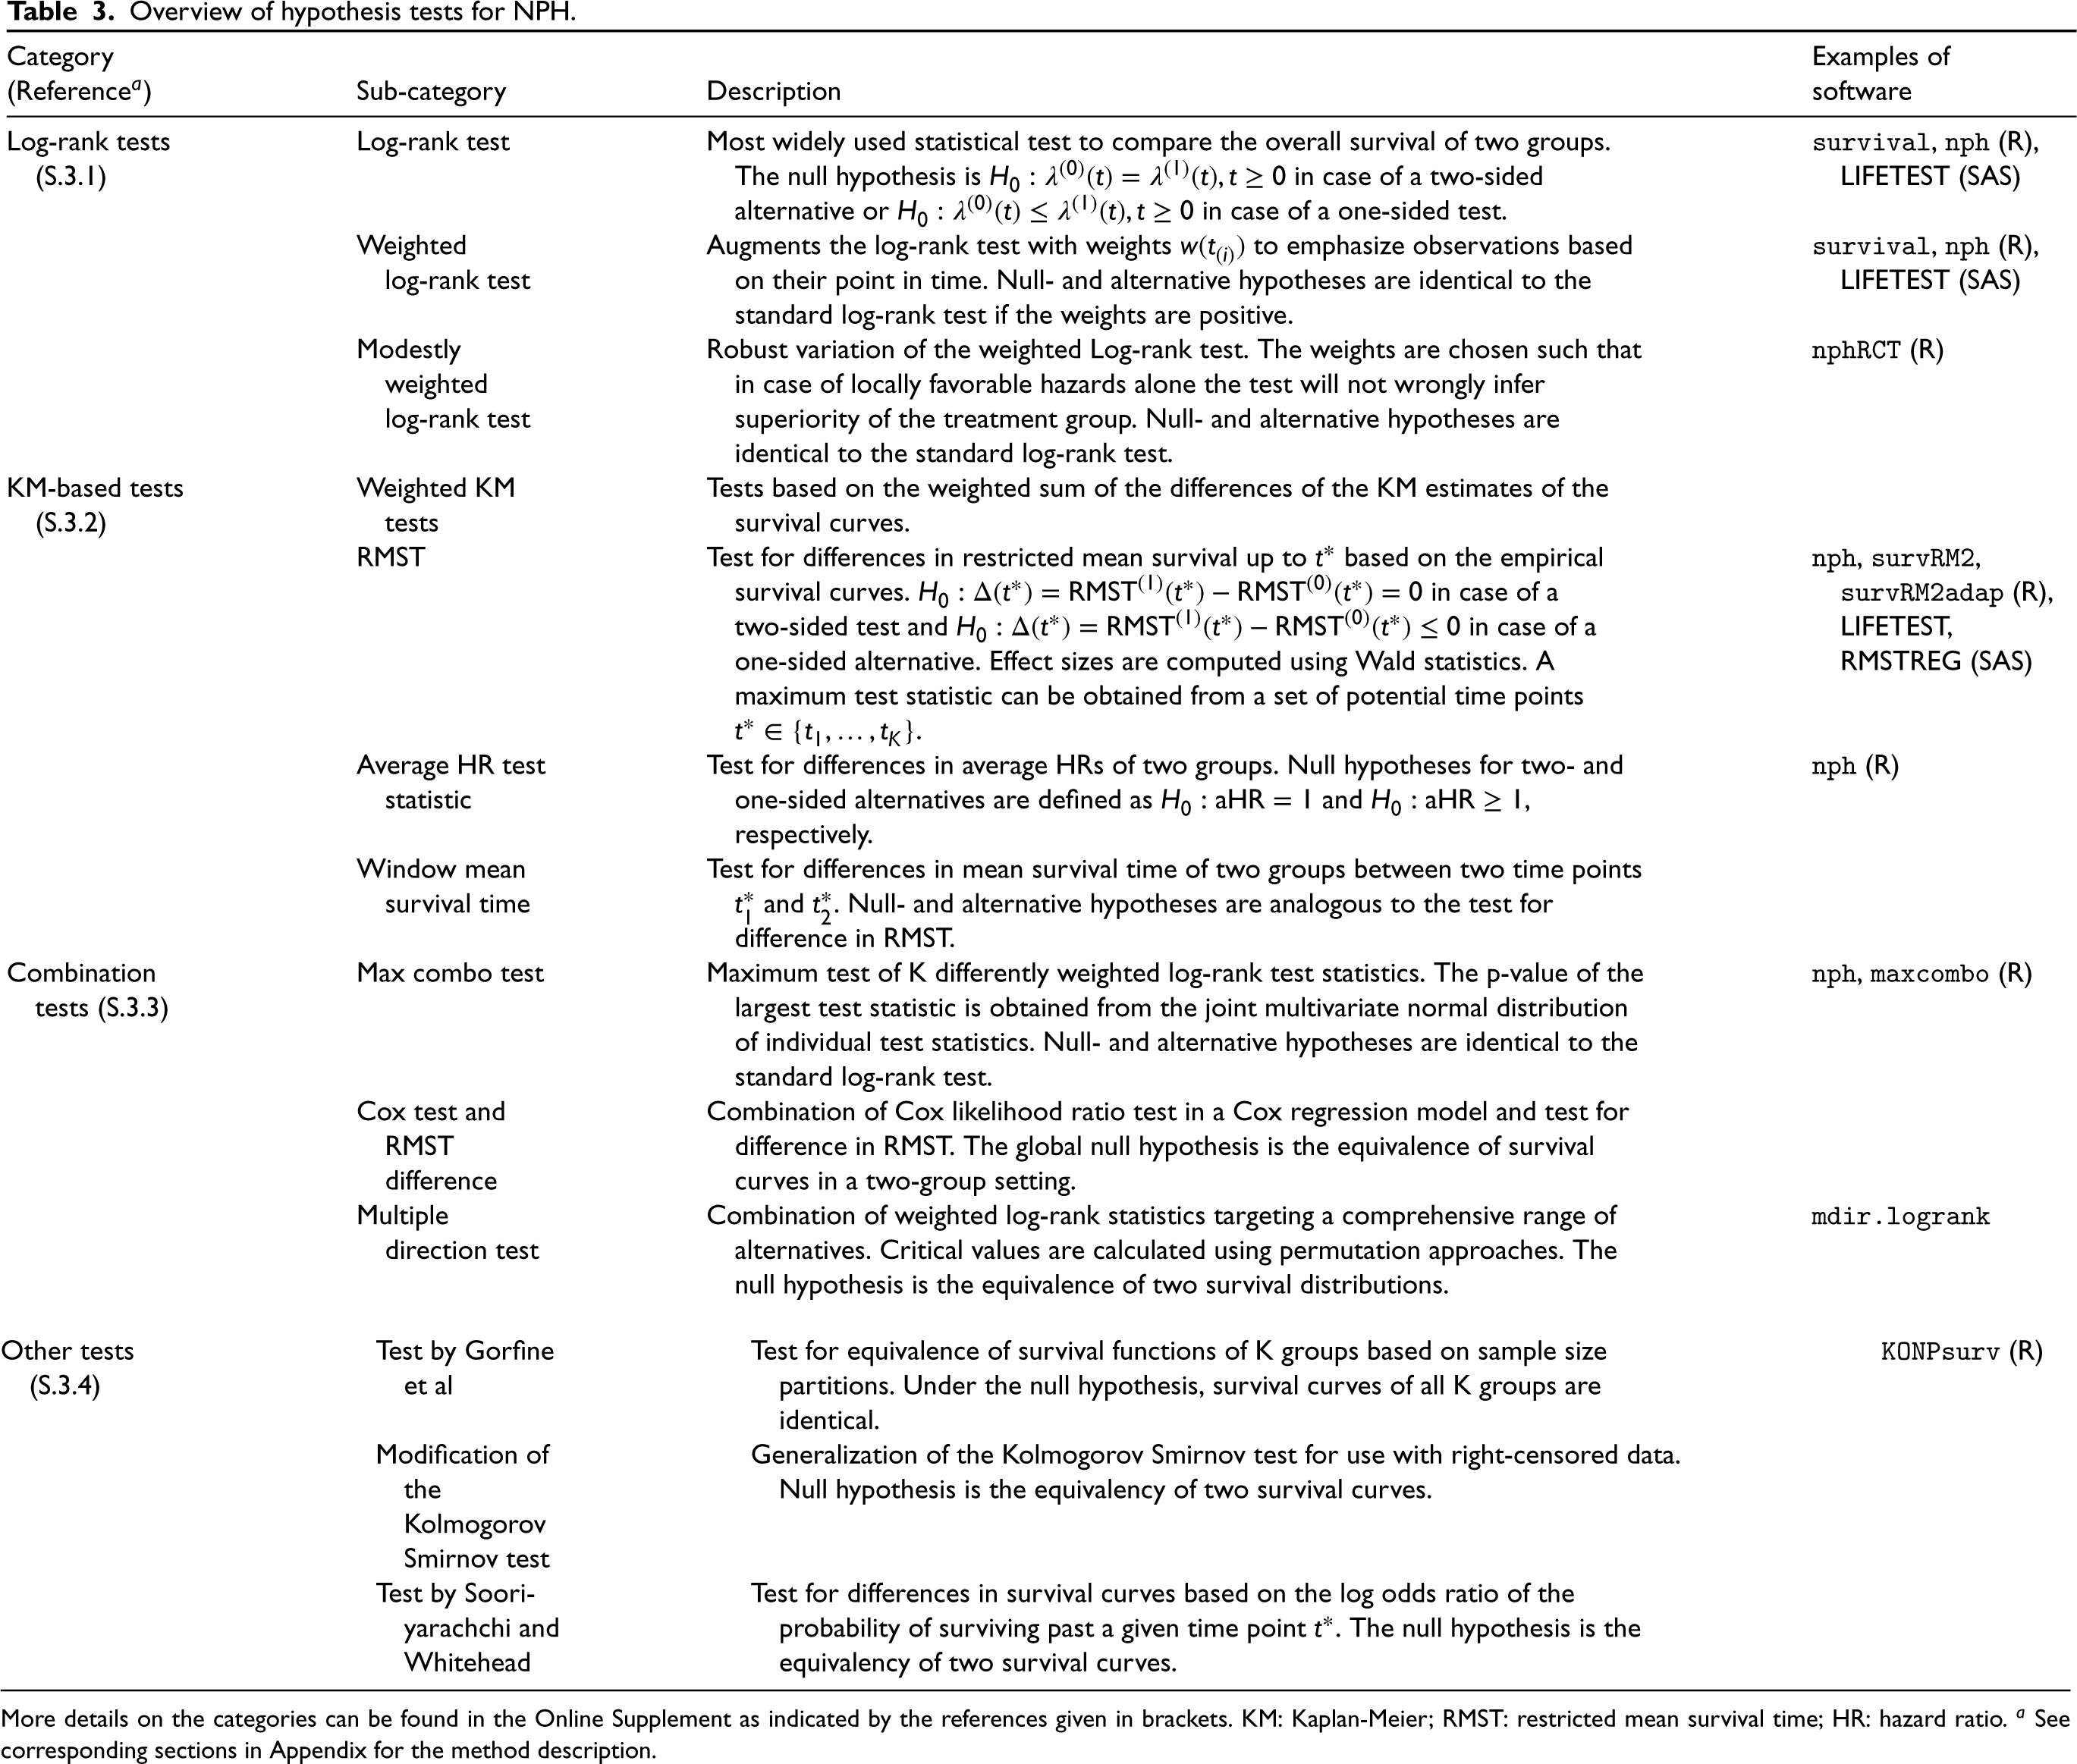
Overview of hypothesis tests for NPH.
More details on the categories can be found in the Online Supplement as indicated by the references given in brackets. KM: Kaplan-Meier; RMST: restricted mean survival time; HR: hazard ratio. a See corresponding sections in Appendix for the method description.
With prior knowledge of the NPH pattern, weighted log-rank tests can consider certain time periods to be more relevant than others. KM-based tests are especially appealing to practitioners due to their intuitive interpretation. Combination tests select a test statistic from a small set of prespecified test statistics based on the data and are therefore useful without any prior knowledge regarding the NPH pattern. Our literature review also identified articles reviewing and comparing hypothesis testing methods under different NPH settings. For instance, Yang 31 applies different tests including weighted log-rank tests, combination tests, and Wald tests based on estimators of the average HR or RMST to different randomized controlled trials to illustrate the virtually ignorable loss of power for reasonably PH situations and emphasizes the substantial gain of power using these approaches in contrast to the standard log-rank test in NPH situations. Many new tests are tailored to specific NPH situations, see Section S.3. Therefore, Yang 31 favors the adaptively weighted log-rank test due to its overall trade-off.
In the comparison study of Dormuth et al., 4 in which data sets of oncology trials were reconstructed, the proposed log-rank permutation test of Ditzhaus and Friedrich 32 detected most differences between treatment groups. These results align with those of other articles investigating omnibus tests, e.g. Gorfine et al. 33 and Royston and Parmar. 5 If there is uncertainty regarding the underlying survival time distributions, a more recent article by Dormuth et al. 34 recommends the use of omnibus tests for comparisons between groups.
Li et al., 35 Callegaro and Spiessens, 36 Royston and Parmar 5 and Lin et al. 37 perform simulation studies for comparing different test statistics for settings with NPH. Li et al. 35 applied amongst others tests of the log-rank test family, KM-based tests, and combination tests to situations of crossing survival curves at early, middle, and late times. They concluded that the adaptive Neyman’s smooth test 38 and the two-stage procedure of Qiu and Sheng 39 have higher power in the considered NPH settings, provide an acceptable power under PH, and their type I error rate is close to the nominal level. Therefore, Li et al. 35 recommend the use of these tests as they are “the most stable and feasible approaches for a variety of situations and censoring rates.”
The comparison study of Callegaro and Spiessens 36 involves, among others, the weighted log-rank test with weights of the Fleming-Harrington weight family, max combo tests, and the likelihood ratio test for testing the treatment effect in a Cox model with time-varying coefficients. Callegaro and Spiessens 36 consider the latter to be often more powerful than the weighted log-rank tests.
Lin et al. 37 compare tests of the class of weighted log-rank, KM, and combination tests. The comparison study did not identify a single test outperforming the others in all considered scenarios; e.g. delayed treatment onset, diminishing effects, crossing hazards, PHs, and delayed effects with converging tails. The comparison study suggests the max combo test as a robust test across different NPH patterns without prior knowledge of the pattern. The review of Mukhopadhyay et al. 40 compared the log-rank test to the MaxCombo test in immo-oncology trials identified through a systematic literature review. The authors concluded that the MaxCombo test is a “pragmatic alternative” to the log-rank test assuming NPH. The simulations of Royston and Parmar 5 suggest that the modified versatile weighted log-rank test, an unpublished modification of the versatile weighted log-rank test 41 with Stata code available on request from Royston, performs best in terms of power under NPH (early, late or near PH treatment effect) without the preconceived type of treatment effect.
In the last 20 years, there have been constant publications on log-rank tests. Research on combination tests, KM-based tests, or other approaches has been comparatively rare. In the last 3 years, however, more research on these testing categories including permutation approaches, e.g. Ditzhaus and Friedrich 32 and Ditzhaus et al., 42 was conducted.
We conducted a systematic literature review of effect estimation and testing methods that are able to cope with NPH in time-to-event analysis. Review articles focusing on different methods for NPH have been published previously. These reviews mostly focus either on a quantitative comparison for specific NPH scenarios, 35 or a specific method class, 17 or on a qualitative overview of available methods for specific NPH situations or disease areas, e.g. oncology. 1 We conducted a systematic literature search for methodological approaches for any NPH scenario, any model class, and not restricted to a specific disease area. Therefore, our review gives a comprehensive overview of the methods proposed and applicable to NPH settings.
In total, our literature review includes 211 articles for final analysis. Of those articles, 113 focus on effect estimation, e.g. regression methods, 72 on testing, and 26 articles on both. In the effects estimation and testing literature, we identified categories to group articles according to their approach to the NPH situation. With respect to effect estimation, the categories are KM-based estimation approaches, stratified Cox model, time-varying coefficients for the hazard rates, transformation models with time-covariate interaction, short- and long-term HR, joint models, frailty models, parametric models, machine learning approaches and others. With respect to testing, the categories are log-rank tests, KM tests, combination tests, and other tests. We have also broken down some of the categories into smaller sub-categories and assigned each paper to at least one of them. An overview of the categories and subcategories is given in Tables 2 and 3, for estimation and testing approaches respectively. The tables and Sections 5 and 6 provide brief explanations of the categories. For a more detailed discussion including references to the original articles proposing specific methods, we refer to the Supplement S. The most common approaches to tackle NPH for effect estimation are time-varying coefficients for the hazard rates (47 papers), and parametric approaches that assume a distribution for the survival time (38 papers), such as GAMLSS models. The most common testing approach for NPH are variations of the log-rank test (63 papers). We extracted and documented the software (R and SAS) utilized in the papers under review. In addition, well-known software for the individual testing and estimation categories was added by the group of authors. For a more complete overview of available R packages for time-to-event analysis see the CRAN Task View homepage for Survival Analysis. 43
For the literature review, we excluded standard methods such as the stratified Cox model, unless the baseline hazards were stratified by the treatment indicator. Consequently, our review may have missed certain innovative proposals in this area. In addition, we have excluded methods that utilize internal44,p.198 time-varying covariates which might lead to NPH over time, e.g. PKPD Models. Further, our search terms focused on terms related to NPH, which may not be a common term in other areas utilizing these methods. For review articles considered in this review, we manually added all investigated methods to the list of articles. Nevertheless, some of those may have been later discarded due to our in- or exclusion criteria, see Figure 3. Consequently, some of the considered review articles may investigate methods which have not been discussed in this review.
A broad range of different methods is available for both treatment effect estimation and hypothesis testing. However, there is no consensus on the best approaches under NPH. Most papers reported simulation studies (158 of 211 papers). Nevertheless, the NPH scenarios and the methods under comparison differ making it difficult to aggregate and compare results across evaluations. Moreover, the NPH scenario and the competitors to newly introduced methodology might have been chosen to demonstrate superiority of the newcomer. 28 Only a few review articles comparing different methods through simulation studies (considered to be objective) have been identified by our review. In particular for effect estimation methodology, independent comparison studies including neutral comparison studies covering different NPH scenarios and a broad range of methods are not available. Review articles of testing procedures cover a broad range of different NPH settings and provide guidance for the choice of the test, which, however, can be different from one comparison study to another. These reviews offer some guidance on, for example, the permutation test by Ditzhaus and Friedrich, 32 and the adaptively weighted log-rank test 24 for specific NPH scenarios. Due to the hypothesis tests examined not being consistent across the comparison studies, it is difficult to make a general recommendation for the use of a specific hypothesis test.
The choice of an estimation method could be based on theoretical considerations. In the absence of strong prior knowledge of the treatment/covariate effect, time-dependent treatment coefficients for the hazard rates could be flexibly modeled via a treatment spline interaction, where the corresponding basis functions are constructed on time. In the case of strong prior knowledge, more restrictive models might be preferred, such as a (single) change point model for a delayed treatment effect (Figure 1(a)).
Moreover, different summary effect measures have been proposed which offer an alternative to the HR. The constant HR estimated by a Cox PH model is commonly used for time-to-event analysis but might be misleading under NPH as the HR is time-dependent in this case. Alternatives involve, for example, the average HR and the ratio of RMSTs. These depend on the choice of the pre-specified time interval which is restricted by the maximum follow-up time. Additionally, its usefulness depends on the pattern of the treatment effect. For instance, the difference of RMST between treatment groups is not useful for delayed treatment effects. 45 Summary effect measures can be calculated based on KM curves. For more complex data, e.g. multiple continuous covariates, other methods presented in Section 5 can be used to model the survival curves. Depending on the choice of the estimation approach it might be difficult if not impossible to obtain specific summary effect measures, however. Dynamic, i.e. time-varying, effect measures could be used instead and could help to communicate how survival patterns are affected by the treatment over time. However, dynamic effect measures are less appropriate as a primary basis for binary decisions such as marketing authorizations. Nevertheless, they could be used to support a decision following a gatekeeping hypothesis test on any difference, hence disentangling the hypothesis test and estimation. As a drawback, such a decision procedure could not be clearly defined in advance. In contrast to this, single summarizing measures such as RMST difference can be used for both, hypothesis tests and estimation, and lead to an unambiguous binary decision procedure but require an upfront agreement on the most relevant measure.
We identified a variety of NPH approaches for both, effect estimation and testing procedures. Although a variety of NPH methods are available, they are still rarely applied. Statistical practice needs to change by adopting the NPHs approaches summarized in this paper. Adhering to invalid assumptions, i.e. PHs, might lead to less reliable conclusions than choosing a non-optimal NPH approach for the data at hand as illustrated in Section 2. To fill the gap in comparisons of the methods for NPH, our further assessment will explore the advantages and disadvantages under a wide range of NPH assumptions of a selection of the identified methods, see Klinglmüller et al. 46
Supplemental Material
sj-pdf-1-smm-10.1177_09622802241242325 - Supplemental material for Methods for non-proportional hazards in clinical trials: A systematic review
Supplemental material, sj-pdf-1-smm-10.1177_09622802241242325 for Methods for non-proportional hazards in clinical trials: A systematic review by Maximilian Bardo, Cynthia Huber, Norbert Benda, Jonas Brugger, Tobias Fellinger, Vaidotas Galaune, Judith Heinz, Harald Heinzl, Andrew C Hooker, Florian Klinglmüller, Franz König, Tim Mathes, Martina Mittlböck, Martin Posch, Robin Ristl and Tim Friede in Statistical Methods in Medical Research
Footnotes
Acknowledgment
The authors would like to thank Juan José Abellán and Marcia Rückbeil of the European Medicines Agency as well as Andreas Brandt of the Bundesinstitut für Arzneimittel und Medizinprodukte for valuable comments and insightful discussion on the report related to the literature review performed as part of the research contract EMA/2020/46/TDA/L3.02 (Lot 3). This report formed the basis of our manuscript.
Declaration of conflicting interests
The authors declared no potential conflicts of interest with respect to the research, authorship, and/or publication of this article.
Funding
The authors received the following financial support for the research, authorship and/or publication of this article: This work has received funding from the European Medicines Agency (Re-opening of competition EMA/2020/46/TDA/L3.02 (Lot 3)). This document expresses the opinion of the authors of the paper, and may not be understood or quoted as being made on behalf of or reflecting the position of the European Medicines Agency or one of its committees or working parties.”
ORCID iDs
Appendix
References
Supplementary Material
Please find the following supplemental material available below.
For Open Access articles published under a Creative Commons License, all supplemental material carries the same license as the article it is associated with.
For non-Open Access articles published, all supplemental material carries a non-exclusive license, and permission requests for re-use of supplemental material or any part of supplemental material shall be sent directly to the copyright owner as specified in the copyright notice associated with the article.