
Abstract
Traditionally, phase II cancer trials test a binary endpoint formed from a dichotomisation of the continuous change in tumour size. Directly testing the continuous endpoint provides considerable gains in power, although also results in several statistical issues. One such issue is when complete responses, i.e. complete tumour removal, are observed in multiple patients; this is a problem when normality is assumed. Using simulated data and a recently published phase II trial, we investigate how the choice of test affects the operating characteristics of the trial. We propose using parametric tests based on the censored normal distribution, comparing them to the t-test and Wilcoxon non-parametric test. The censored normal distribution fits the real dataset well, but simulations indicate its type-I error rate is inflated, and its power is only slightly higher than the t-test. The Wilcoxon test has deflated type I error. For two-arm designs, the differences are much smaller. We conclude that the t-test is suitable for use when complete responses are present, although positively skewed data can result in the non-parametric test having higher power.
Keywords
1 Introduction
Phase II cancer trials of cytotoxic drugs are conducted to test the anti-tumour activity of a novel compound. One-arm studies are still routinely used 1 for sample-size reasons, although randomised two-arm designs are becoming increasingly popular due to high subsequent failure rates of drugs which were successful in one-arm phase II trials. 2
In early phase studies, the anti-tumour effect of a drug is traditionally measured by the change in the sum of diameters of target lesions. The clinical endpoint used, the tumour response rate, is formed from a dichotomisation of this underlying continuous endpoint; patients experiencing a partial or complete response (at least a 30% reduction in the total diameter of target lesions) according to the response evaluation criteria in solid tumors (RECIST) criteria 3 are classed as treatment successes; others as treatment failures. In addition, patients in whom new lesions appear, or for whom non-target lesions grow beyond a certain percentage, are classed as treatment failures.
It is well known in the statistical literature 4– 6 that using a dichotomised continuous variable as an endpoint leads to loss of power and therefore higher sample size requirements. The idea of directly using the continuous endpoint to design and analyse cancer trials was originally proposed by Lavin. 7 Karrison et al. 8 discuss issues in the design of such a trial, and recommend their use. Wason et al. 9 quantify the sample size savings for a two-stage trial design, with 50% reductions observed for a previously designed study. Despite the potential savings, the binary endpoint remains the standard endpoint.
One issue arising from using continuous endpoints is that of complete responses. Complete responses signify that lesions are no longer detected and, if one is using the percentage change, thus have the outcome −100%. If there are several patients experiencing complete responses, then multiple observed effects of treatment will be tied at −100%. Complete responses are observed regularly in several areas of cancer, including metastatic breast cancer, 10 recurrent ovarian cancer, 11 metastatic gastric cancer, 12 and carcinomas of unknown primary site. 13 Panageas 14 proposed modelling complete responses separately using a trinomial outcome, but this also discards information contained in the continuous tumour shrinkage. One could test the clinical binary endpoint, but use the continuous tumour shrinkage to improve the power using the method of Suissa.15,16 This requires the distribution of the continuous endpoint to be known, and so may not perform well when there are complete responses.
When directly modelling the continuous shrinkages, the properties of any statistical method assuming normality of the data, such as the t-test, may deviate from asymptotic properties when there are complete responses. We briefly discuss this issue further in Section 2.1.1.
Karrison et al. 8 suggest that when complete responses are expected, non-parametric tests should be used. However, a well-fitting parametric model could result in power gains. In this article, we investigate a range of straightforward tests for hypothesis testing in phase II cancer trials. We compare the approaches to the Wilcoxon and t-tests, considering one-arm and randomised two-arm trials separately.
As a motivating example, we use a recently published phase II study in metastatic gastric cancer by Park et al. 12 The parametric approaches generally fit well to the observed data. To assess the type-I error rate and power of the various approaches, we use a broad range of simulation scenarios.
2 Methods
2.1 One-arm cancer trials
2.1.1 Notation and hypotheses
In a one-arm cancer trial, n patients receive treatment and are assessed for tumour change. The question of which continuous endpoint to use has not been extensively studied in cancer. The absolute change is not desirable because its variance depends on the baseline value, and the possible change in tumour size will be limited by the baseline value. Lavin 7 recommends using the logarithm of the ratio of the final tumour size to the baseline. This recommendation was based on one relatively small dataset in gastric cancer. Additionally, in the case of complete responses, the observed endpoint will be minus infinity, which makes fitting a parametric distribution problematic. One could specify a truncation point, with observations below being replaced by the truncation point. However, results could be sensitive to the selection of the truncation point. For these reasons, we use the percentage change in tumour size. The central-limit theorem implies that the mean percentage change is asymptotically normally distributed, although convergence to normality may be slow, especially if a large proportion of observations are complete responses.
Let X1,…, X n be the percentage tumour changes for each patient. The hypotheses tested are H0 : δ > δ0 and H1 : δ ≤ δ0, where δ is the mean tumour change. If X1,…, X n are normally distributed, then H0 can be tested using a one-sample t-test. When several of the X i 's take the value −100, the normality assumption is violated, and the t-test may not be valid. The one-sample t-test has been shown to be robust to a non-normal distribution when skewness and kurtosis were low, 17 but many complete responses may result in a large skewness.
2.1.2 Wilcoxon test
One-sample non-parametric tests, such as the Wilcoxon-signed ranks test, are used to test differences in the medians rather than the means. This assumes that the underlying population distribution under the null is symmetric. Thus, for directly testing observed tumour size changes, the Wilcoxon test may not be valid, as the lower limit of −100% prevents symmetry when there are several complete responses.
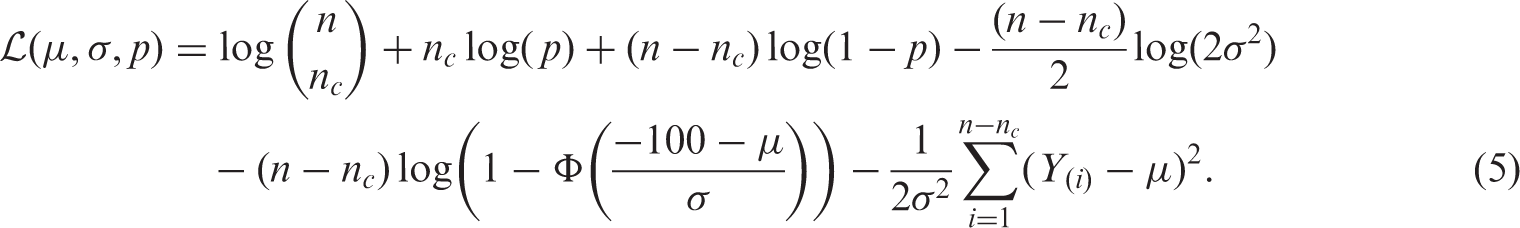
2.1.3 Censored normal distribution
Let X be normally distributed with mean μ and variance σ2. Then Y, defined as:

The assumption of the model that the observed percentage change in tumour size can go beyond −100%, but is censored. This is wrong, but is a useful construct to fit a convenient model. For interpretation reasons, one may prefer to test the mean of the observed distribution, m(μ, σ), using an estimate of the standard error of m from the censored normal likelihood. It is also possible to test only the location parameter, μ, but this requires eliciting values for the mean and standard deviation of the change. Testing the mean just requires specification of a null value for the mean change.
The log-likelihood of independent identically distributed CN(μ, σ2, −100) random variables (Y1,…, Y
n
), can be written as:
19

By maximising (2), the maximum likelihood estimators
In terms of μ and σ, the mean of the observed distribution is:

The mean can be estimated by

For a one-sided test of size α, a confidence interval with coverage 1 − 2α can be obtained by:
This procedure makes two assumptions. The first is that the non complete-responses can be modelled as a normal distribution truncated below at −100%, and the second that two parameters are sufficient to model both the truncated component of the distribution and the probability of complete response. If the first assumption is incorrect, it may be possible to transform the data so that the normality assumption is valid. Inferences from tobit models are sensitive to deviations from the assumption of normality. 20 Thus, if the second assumption is incorrect, use of the model described in this section could lead to invalid inferences.
2.1.4 Unrestricted probability of complete response
A more flexible distribution is a mixture distribution of a point mass, p, at −100% and a normal distribution truncated below at −100%. The mixture probability is not constrained as it was previously. This is similar to a zero-inflated model with continuous data (the literature on this subject is discussed in Mahmud et al. 21 and Li et al. 22 ).
The log-likelihood of this distribution is:
Since the log-likelihood decomposes into terms involving p, and terms not involving p, the MLE of p can be estimated immediately as
The mean of the observed data will be:

2.2 Randomised two-arm cancer trials
2.2.1 Notation
In a two-arm cancer trial, n1 patients are randomised to the control treatment, and n2 to the treatment being tested. All patients are assessed for tumour size change. The parameter tested is the mean difference between control and intervention groups, δ, with hypotheses H0 : δ ≤ δ0 and H1 : δ > δ0. The trial is powered at δ = δ1.
2.2.2 Two-sample parametric tests
The two proposed parametric methods are straightforward to extend to a two-arm study. The estimated difference between arms, together with its standard error can be used to form a confidence interval for the difference in means and a one-sided test of H0 performed.
2.3 Simulation study
To compare the various approaches, we performed simulation studies under a range of scenarios:
All patients have normally distributed tumour size changes with all changes of below −100% being set to −100%. Observed tumour changes follow a skew-normal random variable,28 with all changes of below −100% being set to −100%. The shape parameter is varied to change the direction and magnitude of the skewness. For each patient, a Bernoulli random variable and a normal random variable truncated below at −100% are generated. If the Bernouli variable is 1, then the patient is a complete response, otherwise they have the continuous component as their observed change.
For each scenario, we examine a range of parameters, assessing the type-I error rate and power of each method at significance level 5%. For each parameter combination, we generate 250000 replicate datasets under the null, and another 250 000 under the alternative. With this many replicates, the Monte-Carlo standard error of the estimated type-I error rate is 0.0004.
For two-arm trials, the null hypothesis tested is no difference in means (t-test, censored-normal, mixture model) or medians (Wilcox) between arms. For one-arm trials, the null hypothesis tested is whether the mean/median is equal to a specified null value. For example, for the first example, the theoretical mean is given in Equation (3), and if the probability of complete response is less than 50%, the median is the location parameter, μ.
3 Results
3.1 Properties of tests when observed data is censored normal
First, we examine the performance of the methods under scenario 1, i.e. that the percentage tumour size changes are normally distributed, and complete responses are those patients whose normal random variable is below −100%.
Parameters varied were μ0, the location parameter of the censored normal distribution under the null, μ1, the location parameter under the alternative and σ, the shape parameter of the censored normal distribution. For two-arm trials, under the null hypothesis, both treatments have location parameter μ0, and under the alternative, the control treatment has location parameter μ0, with the new treatment having location parameter μ1. The shape parameter, σ, is assumed to be the same in both arms under both hypotheses.
Values of μ0 considered were {#x02212;60, −70, −80}, with μ1 being μ0 − 10. Values of σ considered were {20, 30}. For each combination of (μ0, μ1, σ), the sample size n was chosen as the minimum number that gave above 80% power at a 5% one-sided significance level using a t-test were the distribution not censored at −100%. For single-arm trials, this gives a sample size of 25 and 56 for σ = 20, 30 respectively. For randomised trials, it gives a sample size per arm of 50 and 112, respectively. This covers a range of sample sizes that one might expect to see in a well-powered phase II trial.
Type-I error rate and power under simulation scenario 1 for single-arm trials.
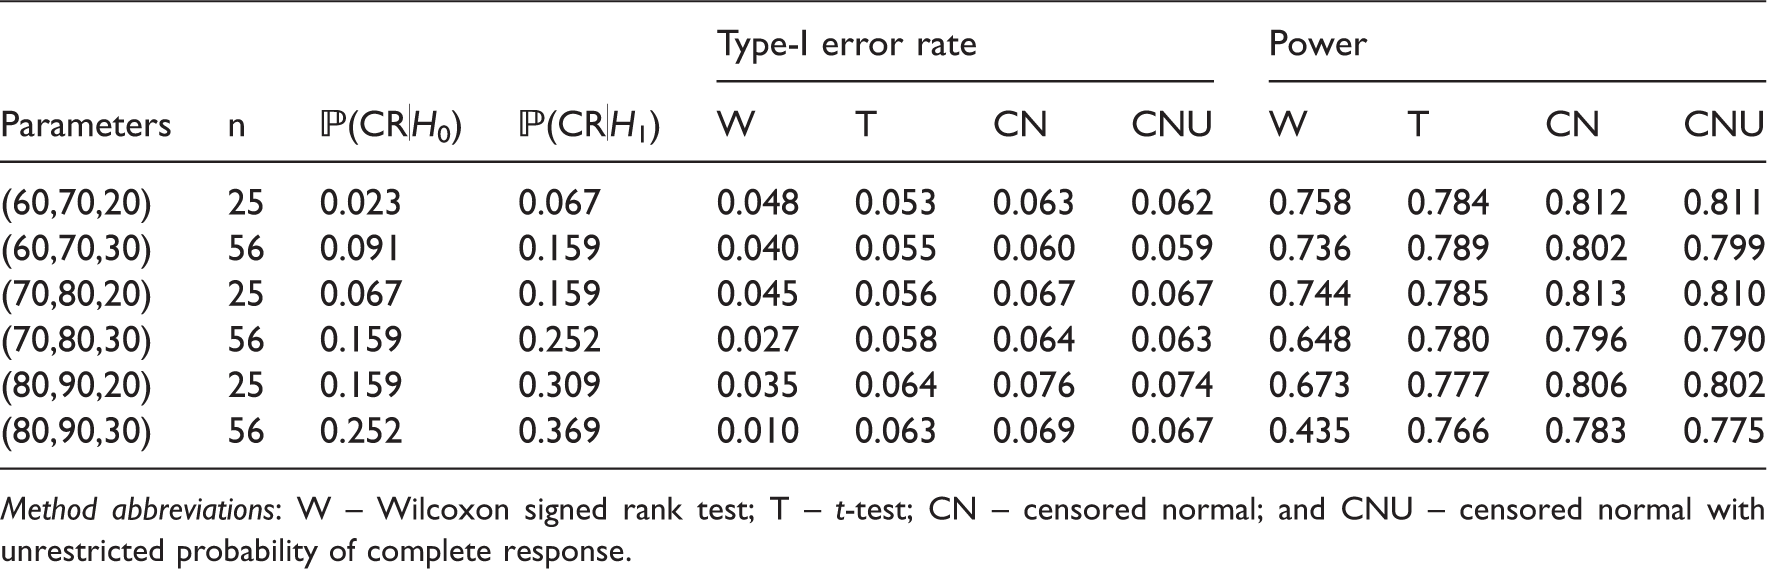
Method abbreviations: W – Wilcoxon signed rank test; T – t-test; CN – censored normal; and CNU – censored normal with unrestricted probability of complete response.
The Wilcoxon test performs well when the probability of complete response is low. The power is only slightly less than that of the parametric methods. As the probability of complete response increases, the type-I error rate and power decrease. The decrease is worse for the larger sample size. Thus, the Wilcoxon-signed rank test should not be applied directly to single-arm data with many complete responses.
The two parametric tests proposed in this article have a higher inflation in type-I error rate than the t-test. This is because the parametric tests rely on asymptotics: for the distribution of the maximum likelihood estimators and also for the delta method approximation of the standard error of the observed mean. The inflation is lower for σ = 30, i.e. when the sample size is higher. There does not appear to be much difference in allowing the complete response to be unconstrained, with a very slight decrease in type-I error rate and power.
The t-test generally performs well. It has the lowest deviation from the nominal significance level of all the methods, and does not lose much power compared to the two more sophisticated parametric methods. It is also much simpler to apply.
Type-I error rate and power under simulation scenario 1 for randomised trials.
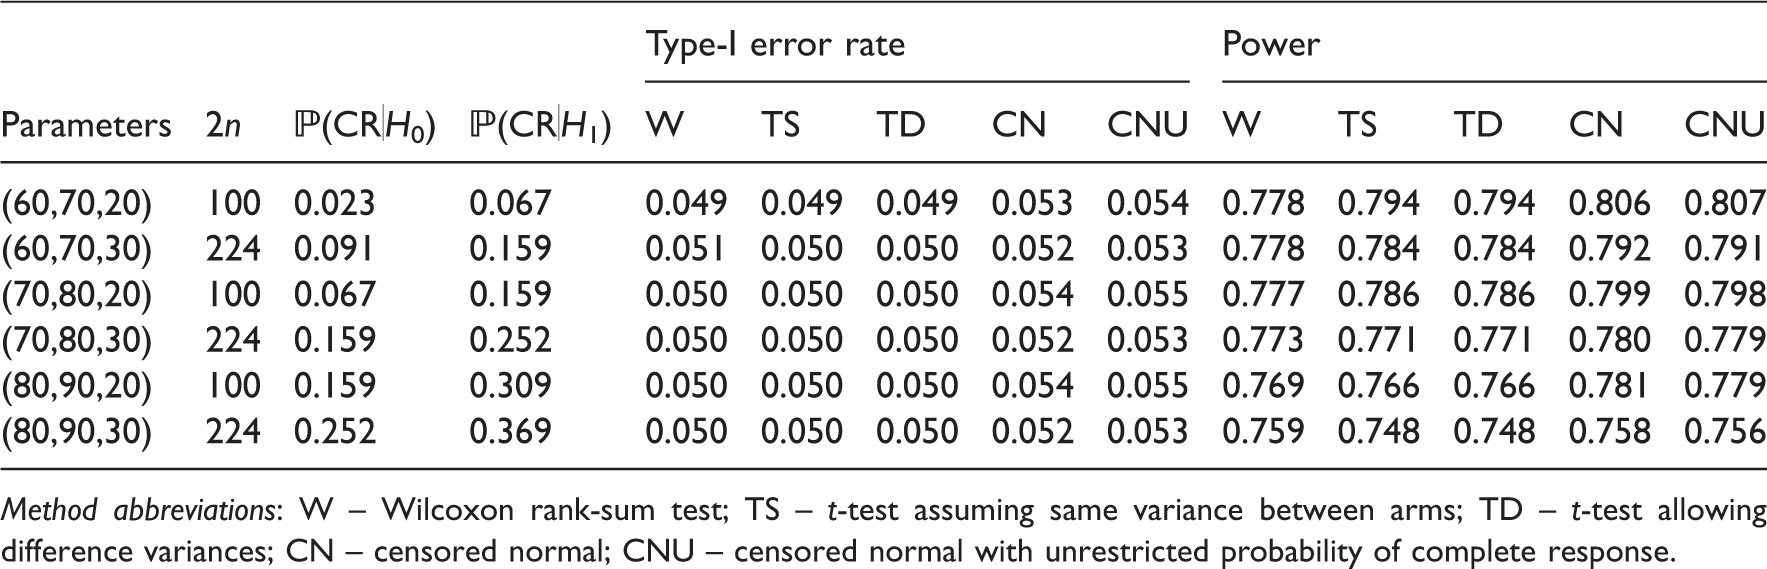
Method abbreviations: W – Wilcoxon rank-sum test; TS – t-test assuming same variance between arms; TD – t-test allowing difference variances; CN – censored normal; CNU – censored normal with unrestricted probability of complete response.
All results in Table 2 assume the same variance in each arm. This may not be the case, but the only method which explicitly assumes it is the two-sample t-test. In the case of both the variance and the sample size differing in each arm, the type-I error rate and power can be affected.24,25 We also considered using a t-test which allows unequal variances. This showed no loss in power, therefore we recommend it for its additional robustness.
3.2 Properties of tests when observed data is censored skew-normal
Next, we simulated datasets where the outcomes were censored skew-normal random variables. We only considered the case where the mean change under the null and alternative are −70% and −80%, respectively, and the standard deviation of the underlying skew-normal random variables is 30. The shape parameter, was varied between −10 and 10 in increments of 1.25. For each value of the shape parameter, location and scale parameters were found under the null and alternative such that the means and standard deviation were as specified.
Figure 1(a) and (b) show the type-I error rate and power, respectively, of the Wilcoxon test and the three parametric approaches, as the shape parameter varies, for single-arm trials.
Type-I error rate and power of the different approaches as the shape parameter changes, for simulation scenario 2.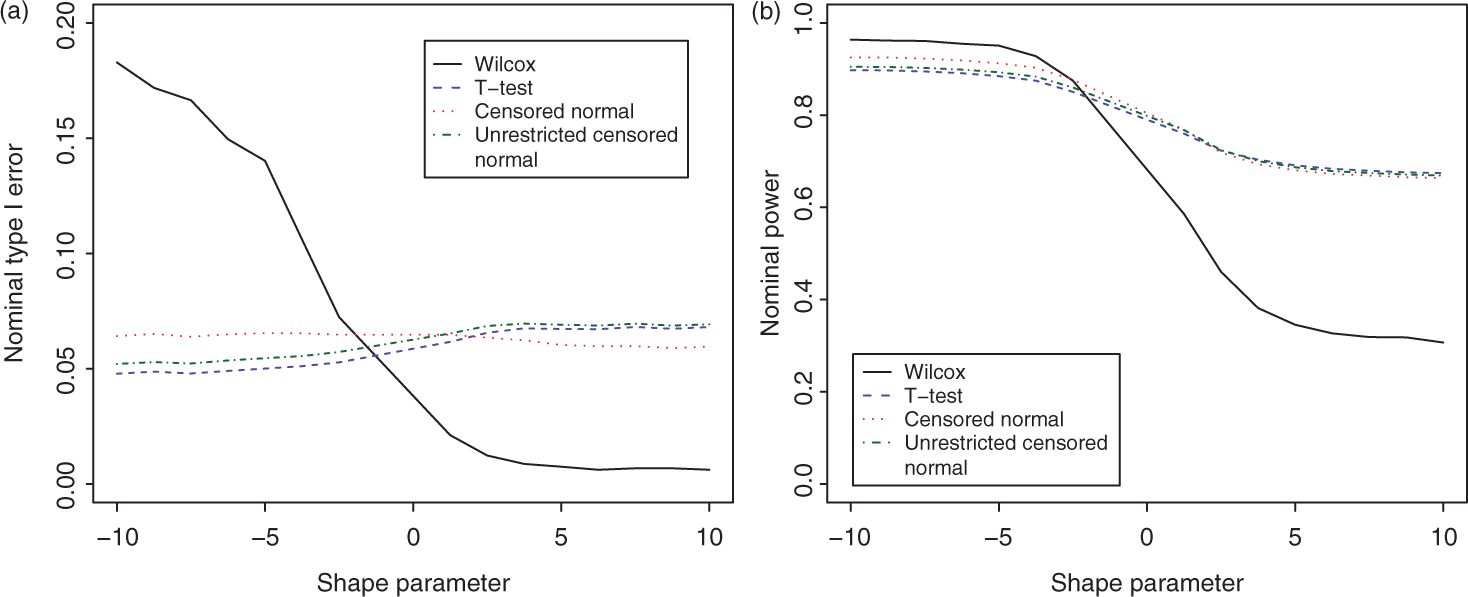
The Wilcoxon test is the most sensitive to non-zero skewness of the four approaches. The type-I error rate is very large for large negative skewness, and very low for large positive skewness. This may be partly due to deviations from the assumption of a symmetric distribution. As in the first scenario, there does not seem to be any advantage in using the more sophisticated parametric procedures over that of using the t-test. There is a difference in the type-I error rate and power, but no single technique shows a consistent advantage.
As in the previous simulation scenario, there is much less difference between the techniques for randomised trials (data not shown). Again, the two censored normal approaches had higher deviations from the nominal significance level – lower than nominal for negative skewness and higher than nominal for zero to positive skewness. An observation of interest was that the power of the Wilcoxon test was generally lowest at zero skewness. The power increased as the skewness deviated from zero. The parametric techniques have highest power for large negative skewness, with the power decreasing monotonically as the shape parameter increased. This is likely due to the probability of complete response increasing as the skewness goes from positive to negative.
3.3 Properties of tests when complete response probability is unconstrained
We next consider the third scenario – where the probability of complete response is independent of the continuous tumour change.
The scale parameter for the truncated normal component is set to be 30, with the location parameters under the null and alternative being chosen so that the mean tumour change, including complete responses, is −70 and −80, respectively.
We examined the case where the difference between p1, the probability of complete response under the alternative, and p0, the probability under the null, was constant. The difference was fixed at the difference when determined by the tail-probabilities of the normal distribution. With means −70, −80 and standard deviation 30, p0 and p1 are equal to 0.159 and 0.252, respectively. Thus, we fix the difference between p0 and p1 at 0.093, but vary p0. Values of p0 considered were {0.05, 0.1, 0.15, 0.2, 0.25}.
In single-arm cases, we found that the type-I error rate of the Wilcoxon test increased modestly with p0, from 0.016 at p0 = 0.05 to 0.022 at p0 = 0.25. The type-I error rate of the restricted censored normal approach also increased at about the same relative rate - from 0.055 to 0.073. However, both the t-test and the unrestricted censored normal approach maintained their type-I error rate at around 0.06 and 0.065, respectively as p0 increased. The power showed a large gap, implying again that for single-arm trials it would be a mistake to apply the Wilcoxon test to datasets with complete responses.
A surprising result was that the unrestricted censored normal test showed no power advantage. Its sole advantage was that the type-I error rate was closer to nominal. Even then the t-test showed less inflation in type-I error rate and around the same power.
For randomised trials, the only observation of note was that as p0 increased, the power of the Wilcoxon test dropped considerably more than the parametric approaches. At p0 = 0.05, the gap was around 0, but at p0 = 0.25, it was 5%. Again, there was no noticeable advantage in using the censored normal approaches over using the t-test. Of the two censored approaches, the deviation from 5% significance level was lower using the unconstrained probability of complete response.
3.4 Case study
As a case study, we use published data from Park et al., 12 a phase II study in metastatic gastric cancer. The trial had one arm, the treatment being a triplet regimen of S-1, irinotecan and oxaliplatin. A total of 41 patients were assessed, 7 of whom were complete responses.
As currently carried out, phase II cancer trials do not test hypotheses about the continuous change, so a null value being tested is not available. Instead, we compare the confidence intervals for the observed mean from the t-test and the two censored normal approaches as well as the confidence interval for the observed median from the Wilcoxon test.
First, we compare the fit of the two censored normal approaches to the observed data. Figure 2 shows the empirical cumulative density function and the model fit from each approach.
Observed quantiles of tumour change data from case-study, and fitted quantiles from the censored normal and unrestricted censored normal models.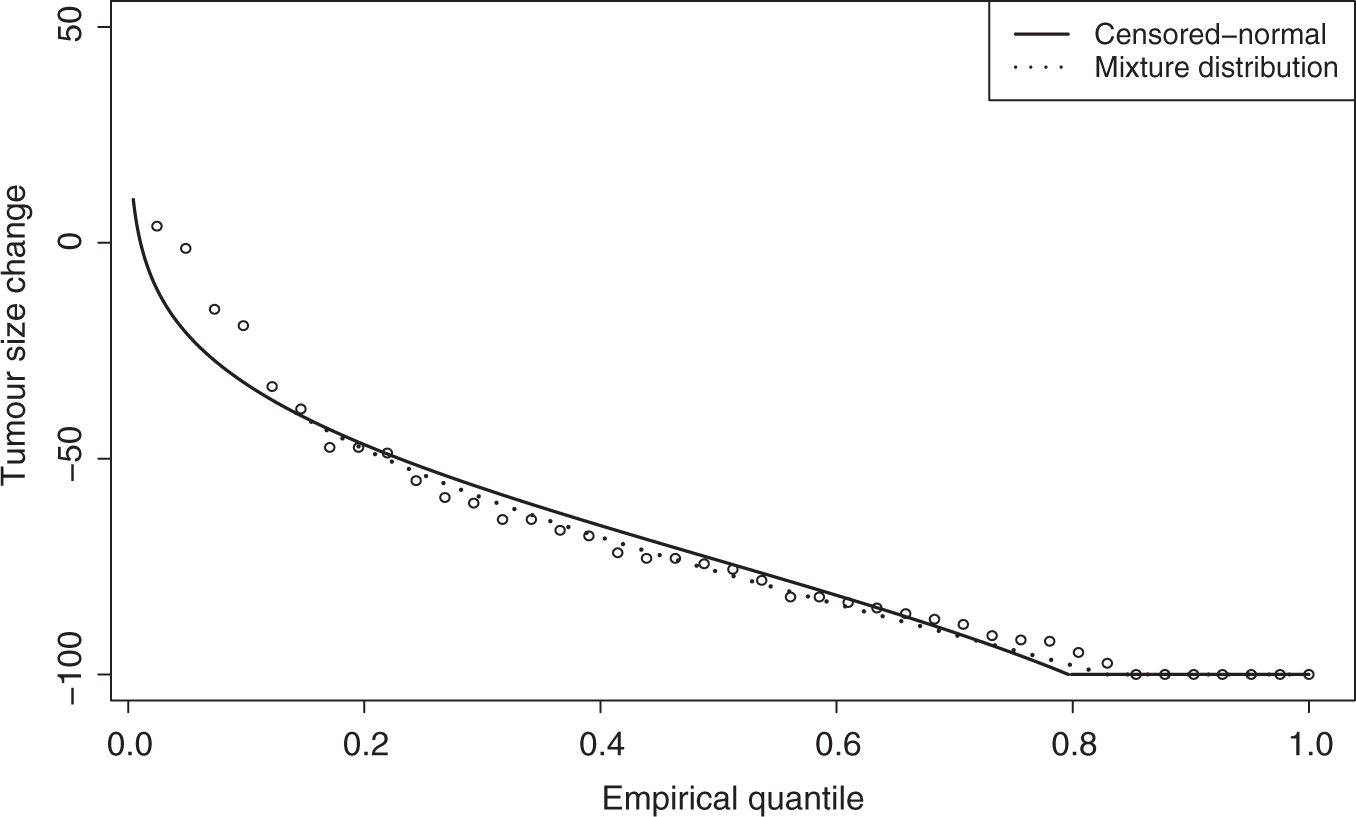
Figure 2 shows little noticeable difference in the fit of the two censored normal approaches. Both tend to fit well in the middle of the distribution, but not at the left tail. The unrestricted model fits better in the right tail, although the restricted model appears to model the probability of complete response sufficiently well.
Summary of model fit for the two censored normal procedures
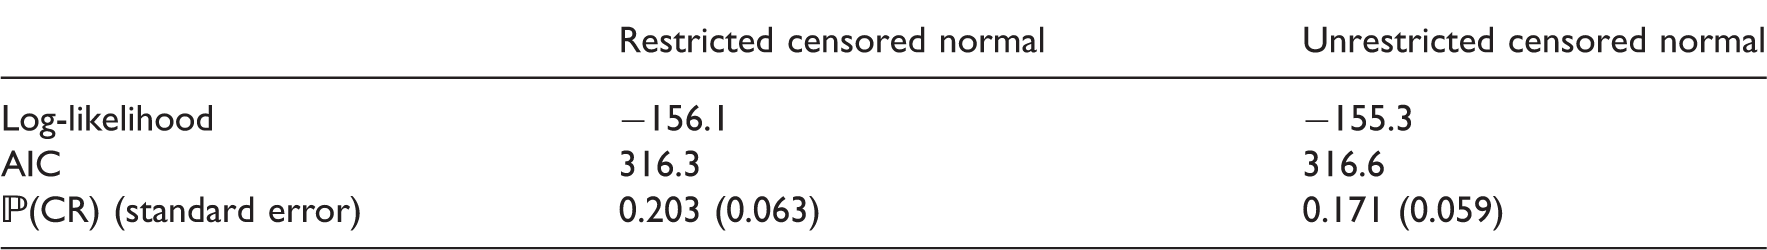
In terms of the log-likelihood and the AIC, there is little difference between the fit of the models for this dataset. There is a small difference in the fitted probability of complete response, but the standard error of the estimate for the restricted model is 0.063, so the confidence interval includes 0.171, the fitted probability of complete response under the unrestricted model.
The standard errors of the mean tumour change for the restricted and unrestricted models are 4.11 and 4.28, respectively using the delta method. Similar results were found using 5000 bootstrap samples (standard errors of 4.26 and 4.23, respectively).
The 95% confidence intervals for the mean tumour change are (−77.7%, −61.6%) from the restricted censored normal approach, (−78.8%, −62.1%) from the unrestricted approach and (−79.30%, −61.8%) from the t-test (i.e. by assuming the data is normally distributed). The 95% confidence interval for the median, from the Wilcoxon test, is (−82.1%, −64.1%). The confidence intervals for the mean do not vary greatly between the methods, as one would expect from the simulation results. However, the width of the confidence interval from the t-test is slightly wider.
4 Discussion
In this article, we have considered which test to use for comparing tumour size changes (either between two groups, or to historical data) in phase II cancer trials when complete responses are expected. For randomised two-arm designs, there appears to be little difference in the performance of each test examined. Using the Wilcoxon rank-sum test provides equally good power to using the t-test. This agrees with earlier work on the two-sample case by Lachenbruch.26,27 The two more sophisticated parametric approaches we examined have slightly inflated type-I error rates.
For one-arm designs, which are common in phase II cancer trials, there is more of a difference. The Wilcoxon-signed rank test has a lower than nominal type-I error rate, and a loss in power. The t-test shows a slight inflation in type-I error rate. However, the degree of inflation is lower than that of the two parametric approaches. Although the two parametric approaches provide a slight increase in power, this increase is less than 1%. Because of the extra complexity and the small gain, we would still recommend the t-test for use in practice.
One factor that makes a difference is the skewness of the data. In single-arm trials, negative skewness resulted in the Wilcoxon test having the lowest power of the approaches, whereas positive skewness meant it had the highest. For two-arm trials, the difference was again much smaller.
The censored parametric methods may be improved by testing the underlying location parameter instead of the observed mean. For single-arm trials, this would be difficult because it would require a null value for the location parameter to be specified before the trial. For two-arm trials, this is not required. It may still be not desirable however, as a difference in location parameter between arms would not be as interpretable as a difference in observed means, and would be more difficult to communicate to non-statisticians.
This article has considered cytotoxic agents, which are designed to shrink the tumour. More recently, cytostatic agents have been introduced, which are designed to control the tumour growth. For trials of cytostatic agents, complete responses are unlikely, and so the conclusions presented in this article are less relevant. However, cytotoxic drugs continue to be developed and tested.
The methods in this article assume that the only endpoint of interest is the change in size of target lesions. Real trials are often more complex, with death and toxicity occuring, which causes patients to drop out. This study presents important conclusions about modelling target tumour size when complete responses are present. Incorporating these conclusions into more complicated models that allow for death and toxicity is the subject of ongoing work.
Footnotes
Funding
The authors are funded by the medical research council, grant MC_US_A030_0035.