
Abstract
Objective
We previously demonstrated the utility of the Automated Neuropsychological Assessment Metrics (ANAM) for screening cognitive impairment (CI) in patients with systemic lupus erythematosus (SLE) and developed composite indices for interpreting ANAM results. Our objectives here were to provide further support for the ANAM’s concurrent criterion validity against the American College of Rheumatology neuropsychological battery (ACR-NB), identify the most discriminatory subtests and scores of the ANAM for predicting CI, and provide a new approach to interpret ANAM results using Classification and Regression Tree (CART) analysis.
Methods
300 adult SLE patients completed an adapted ACR-NB and ANAM on the same day. As per objectives, six models were built using combinations of ANAM subtests and scores and submitted to CART analysis. Area under the curve (AUC) was calculated to evaluate the ANAM’s criterion validity compared to the adapted ACR-NB; the most discriminatory ANAM subtests and scores in each model were selected, and performance of models with the highest AUCs were compared to our previous composite indices; decision trees were generated for models with the highest AUCs.
Results
Two models had excellent AUCs of 86 and 89%. Eight most discriminatory ANAM subtests and scores were identified. Both models demonstrated higher AUCs against our previous composite indices. An adapted decision tree was created to simplify the interpretation of ANAM results.
Conclusion
We provide further validity evidence for the ANAM as a valid CI screening tool in SLE. The decision tree improves interpretation of ANAM results, enhancing clinical utility.
Key messages
(1) The ANAM can be used as a screening tool for CI in patients with SLE. (2) Eight most discriminatory ANAM subtests and scores were identified, reducing overall testing time. (3) A simple decision tree generated from CART analysis improves the interpretability of ANAM results.
Introduction
Cognitive impairment (CI) is common in patients with systemic lupus erythematosus (SLE) with a pooled prevalence of 38% (95% confidence interval: 33–43%) (1). However, diagnosis and screening for CI is often delayed. Currently, evidence is lacking on the validity and agreement of screening instruments used for assessing CI in patients with SLE (2).
The validated American College of Rheumatology Neuropsychological Battery (ACR-NB) is regarded as the gold standard for assessing CI in SLE (3, 4). It is a 1 hour NB, covering cognitive domains shown to be affected in SLE, including attention and speed of processing, language processing, learning and memory (visuospatial and verbal), executive functioning, and manual motor speed (3). Although shorter than traditional NBs, the ACR-NB remains associated with high costs due to the need for trained personnel for administration and score interpretation. These create significant barriers for patients and clinicians since such costs are not typically covered by public healthcare systems and impose a substantial time burden for screening in ambulatory settings. Thus, instruments with less administrative burden are needed to facilitate early screening of CI in SLE.
The Automated Neuropsychological Assessment Metrics (ANAM) offers such a possibility, but its validity for cognitive screening in SLE has yet to be fully established. The ANAM (version 4) General Neuropsychological Screening (GNS) battery is self-administered, takes 30–40 min to complete, and has been used for detecting CI in SLE (5–7). The ANAM generates large amounts of data which allows customization of a cognitive screening battery for specific populations of interest (8). Trained personnel can administer the ANAM under the supervision of a qualified health professional (e.g., clinical psychologist); however, interpretation requires a qualified professional trained in test principles (e.g., neuropsychologist).
We previously demonstrated that the ANAM could accurately screen for CI in SLE compared to the ACR-NB, and derived composite indices for predicting CI (9). To extend our results, we used Classification and Regression Tree (CART) analysis in the current study to predict CI in patients with SLE based on ANAM subtests and scores. CART uses recursive partitioning to build a decision tree (10). CART retains the optimal number of predictors to maximize sensitivity and specificity of the outcome. This innovative and powerful statistical technique identifies the most discriminatory variables in a model and displays data in a decision tree (10–12). Implementing the ANAM as a screening test for CI in SLE with the CART decision tree facilitates earlier, large-scale screening.
Our objectives were to (1) examine the ANAM’s criterion validity for detecting CI against an adapted ACR-NB, (2) identify the most discriminatory subtests and scores of the ANAM for predicting CI and compare the performance of our best models against our previous composite indices (9), and (3) provide a new approach for interpreting ANAM results using decision trees. We hypothesized that the ANAM would achieve a sensitivity ≥80% and specificity ≥70%.
Patients and methods
Patients
A cross-sectional analysis of data on 300 consenting adult patients with SLE who attended the University of Toronto Lupus Clinic between January 2016 and October 2019 was conducted. Inclusion criteria were (a) fulfillment of the revised ACR criteria for SLE classification or three criteria and a supportive biopsy (kidney or skin) (13); (b) ages 18–65; and (c) ability to give informed consent. Exclusion criteria were (a) mental or physical disability preventing participation in the study and (b) low fluency in English precluding completion of verbal items of the ACR-NB. All participants provided written, informed consent. This study was approved by the University Health Network Research Ethics Board.
Study Procedures
Patients completed both the adapted ACR-NB and ANAM on the same day, and were classified as either CI (n=157), non-CI (n=54), or indeterminate (n=89) based on the adapted ACR-NB. We used the following criteria: (a) CI: A z-score of ≤−1.5 in 2 or more domains; (b) non-CI: z-scores in all domains ≥−1.5; and (c) indeterminate: A z-score of −1.5 in only one domain (9). The indeterminate group was excluded from the analysis to reduce heterogeneity. The final sample included 211 patients.
A domain was defined as impaired if a z-score of ≤−1.5 was reached in at least one test in the following domains: manual motor speed, simple attention and processing speed, visual-spatial construction and language processing; or z-score of ≤−1.5 in 2 or more tests in the following domains: learning and memory and executive functioning (9). We corrected for patients with known joint issues if performance on a motor task (e.g., Finger Tapping) resulted in a z-score <−1.5 (i.e., impairment).
Outcome measures
Adapted ACR-NB
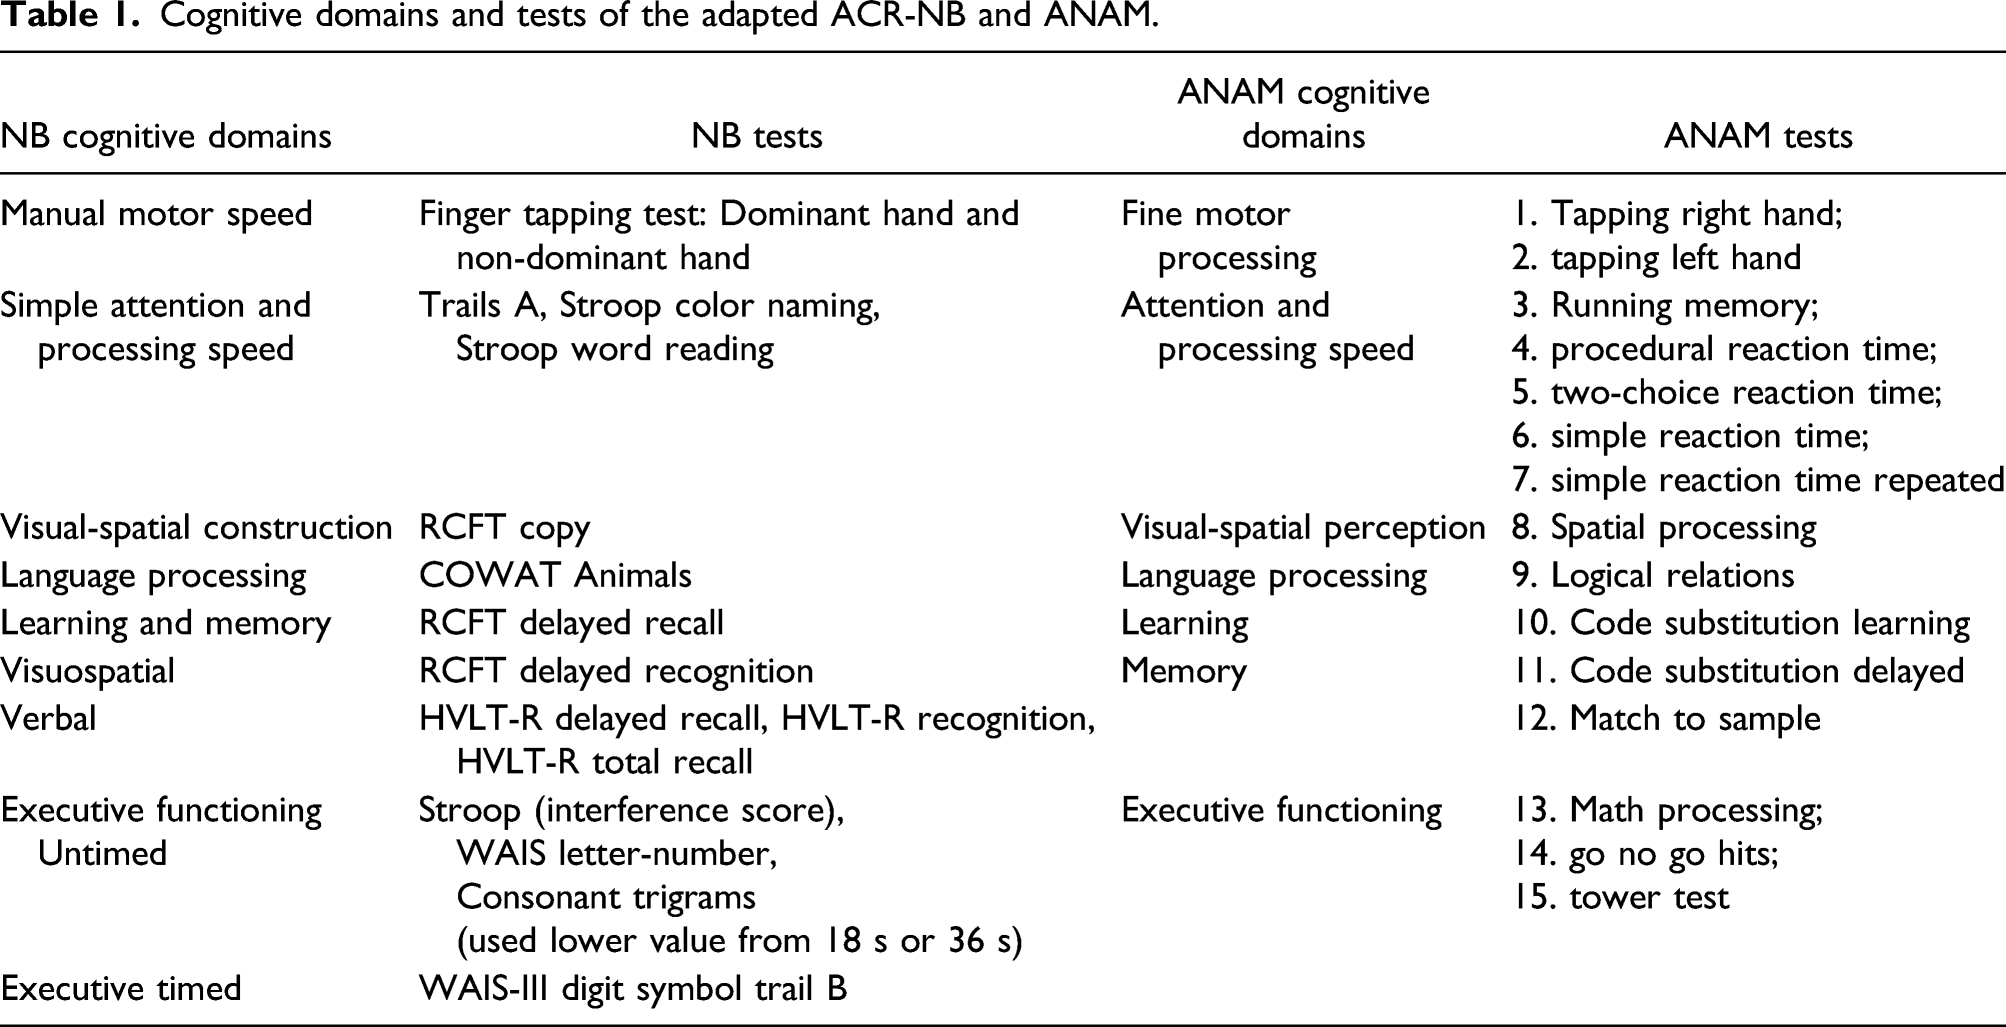
The ACR-NB has been described in detail elsewhere (3, 4). The version used in this study was identical to the original ACR-NB, except for the following: the Hopkins Verbal Learning Test–Revised (HVLT-R) (14) was used instead of the California Verbal Learning Test (CVLT) (15) due to its shorter duration. Our adapted ACR-NB includes 11 cognitive tests representing six cognitive domains (manual motor speed; simple attention and processing speed; visual-spatial construction; language processing; learning and memory [visuospatial and verbal]; and executive functioning [untimed and timed]) (9).
ANAM
Cognitive domains and tests of the adapted ACR-NB and ANAM.
Statistical Analyses
Demographic and clinical characteristics between patients who were classified as CI and non-CI were summarized. A sample size calculation following the rule for regression analyses of 20 cases per predictor, suggested the minimum sample size to be 200, which we surpass (n=211). Statistical significance was set at an alpha level of p < 0.05. CART analysis was employed in R (17). Missing data was handled by CART via imputation of missing data with surrogate variables. Holm–Bonferroni method was used to control for multiple comparisons in the same ANAM score family. Raw ANAM scores were used and adjusted for age in each model.
Examine the ANAM’s concurrent criterion validity (objective 1)
Models were defined a priori using the same ANAM scores and subtests as we had previously (9): Model 1—PCT scores, Model 2—CV scores, Model 3—MR scores, Model 4—TP scores, Model 5—PCT, CV, and MR scores, and Model 6—PCT, CV, MR, and TP scores. MeanScore was used in place of TP for Tower Puzzle and number of incorrect responses (NumIncRsp) was used in place of TP for Go/No Go. Age was also included in the models. Each model was submitted to CART analysis. Decision trees were partitioned and pruned using complexity parameter (cp), a computed value that determines the number of predictors in a tree (18). The cp value with the lowest cross-validation error to produce the optimal number of predictors and lowest misclassification rate was selected (11). To minimize overfitting, repeated k-fold cross-validation was performed on each model using the one minus standard error rule with R package “caret.”(19) The k was assigned to 10 in our analysis, meaning the dataset was randomly split into 10 equal parts; one part (10%) of the dataset reserved as the testing dataset and the remaining nine parts (90%) as the training dataset. Each model was fit on the training set and evaluated on the testing set. An evaluation score was retained, and the model was discarded. This was continued until all 10 parts were used as the testing dataset. This process was repeated three times (a standard method), and each model’s performance was a result of combined fitness of all 30 models.
Each model’s ability to detect CI was analyzed using receiver operator characteristic (ROC) curves to determine area under the curve (AUC). AUC values were classified as outstanding (1.0–0.91), excellent (0.90–0.81), good (0.80–0.71), fair (0.70–0.61), or poor (<0.6) (20). R package “ROCR” was used for plotting ROC (21) and R package “pROC” was used for calculating 95% confidence intervals for each ROC (22). Contingency tables were used to calculate sensitivity, specificity, accuracy, positive predictive value (PPV), and negative predictive value (NPV).
Identify the most discriminatory ANAM subtests and scores and compare to composite indices (objective 2)
Final decision trees were generated following k-fold cross-validation for models that achieved an AUC ≥0.81, sensitivity ≥80% and specificity ≥70% using R package “rpart.plot” (23) and R package “Rattle” (24). Resultant decision trees identified the most discriminatory subtests and scores of the ANAM. Previous composite indices (ANAM-index5 and ANAM‐index6) (9) were applied onto the current dataset. ANAM subtests were compared between CART and the composite indices.
New approach to interpret ANAM results using CART analysis decision trees (objective 3)
Decision trees generated with R Packages “rpart.plot” (Supplementary Data S1) was used as a reference to redesign the decision trees to enhance clinical interpretability. To further investigate the performance of the decision tree algorithm from the best models, we applied their algorithms to the indeterminate group (n=89).
Results
Demographic and clinical characteristics of cohort included in the analysis (CI and non-CI).
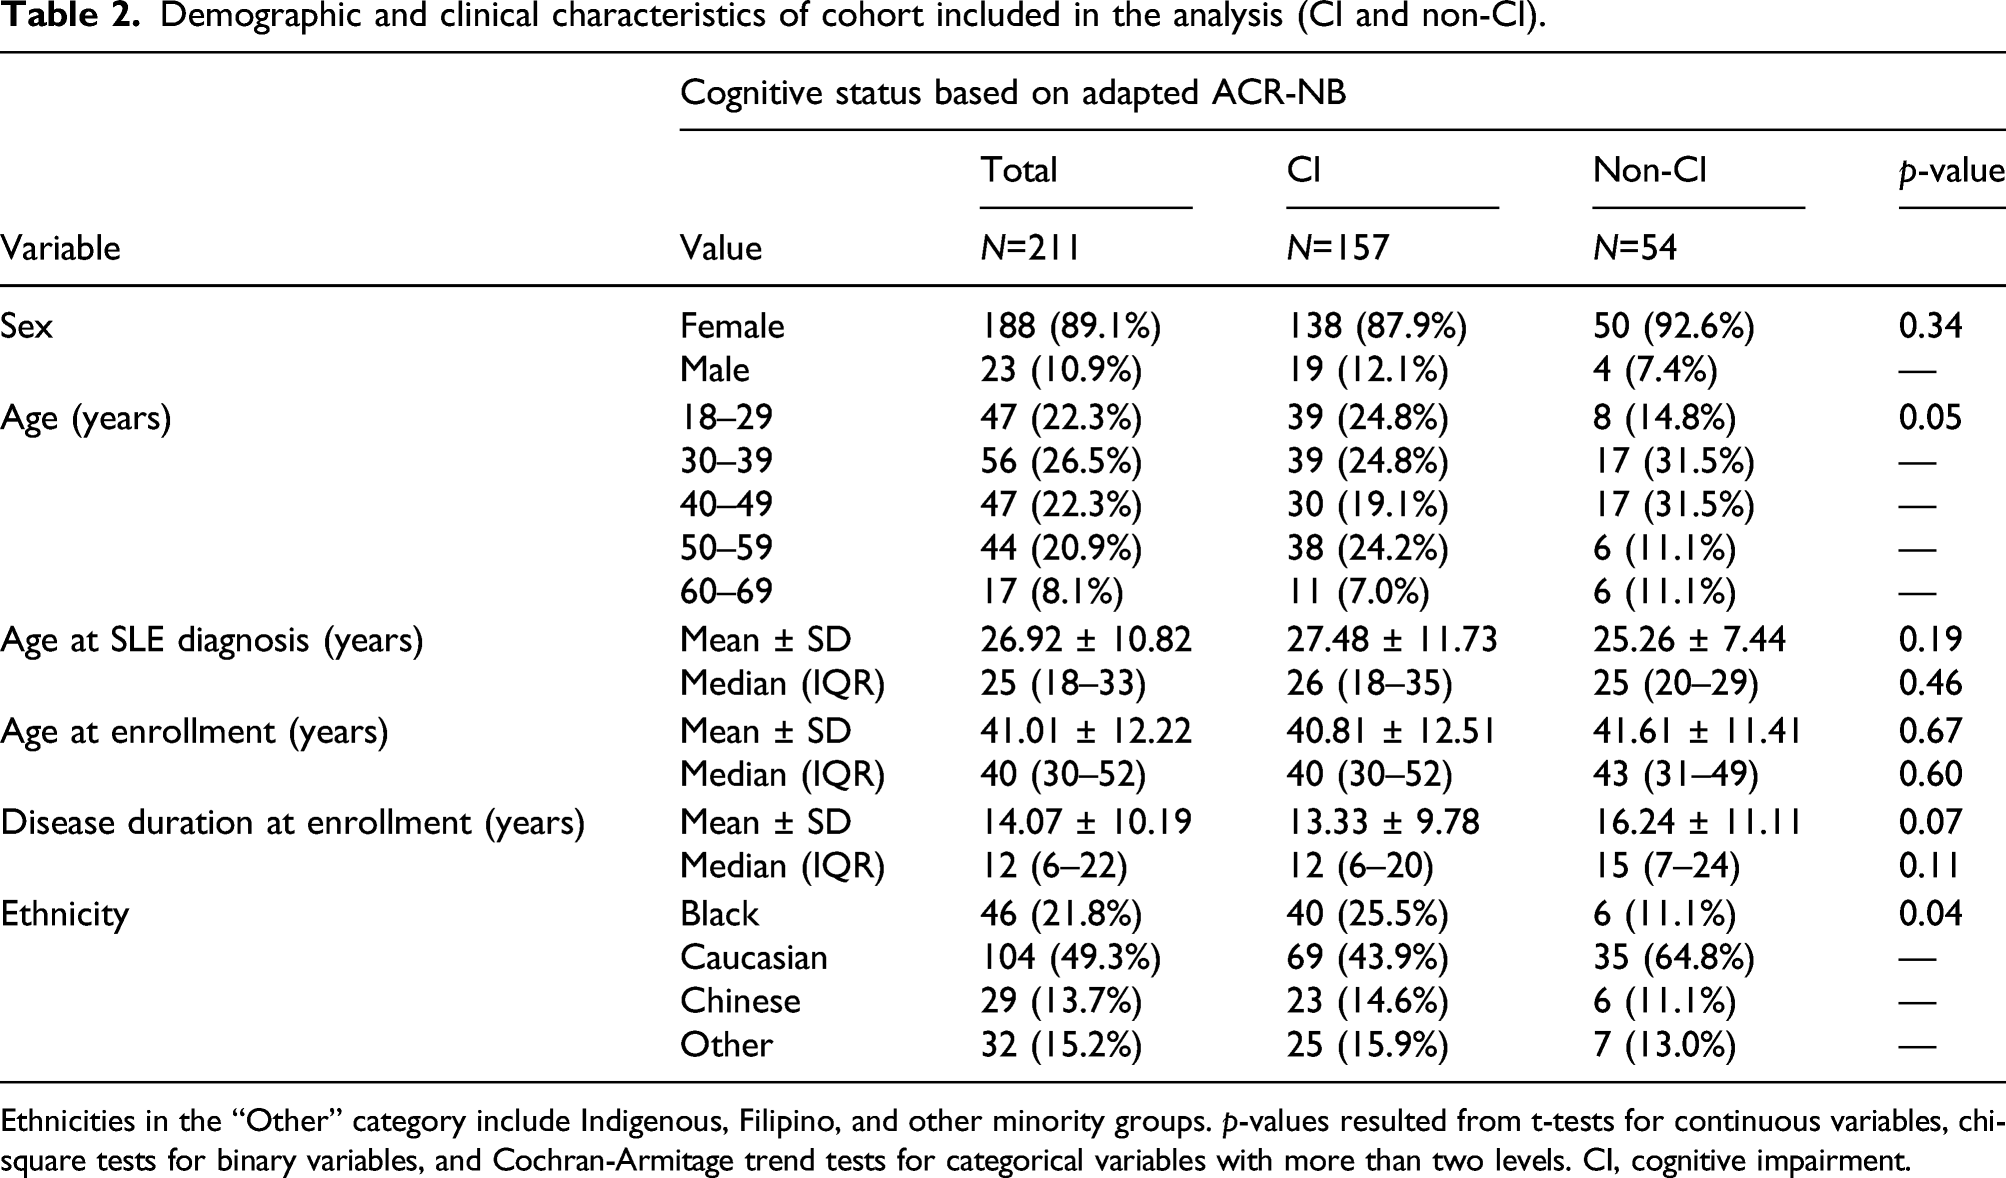
Ethnicities in the “Other” category include Indigenous, Filipino, and other minority groups. p-values resulted from t-tests for continuous variables, chi-square tests for binary variables, and Cochran-Armitage trend tests for categorical variables with more than two levels. CI, cognitive impairment.
Examine the ANAM’s concurrent criterion validity (objective 1)
AUC, sensitivity, specificity, PPV, NPV, and accuracy results of all CART models.
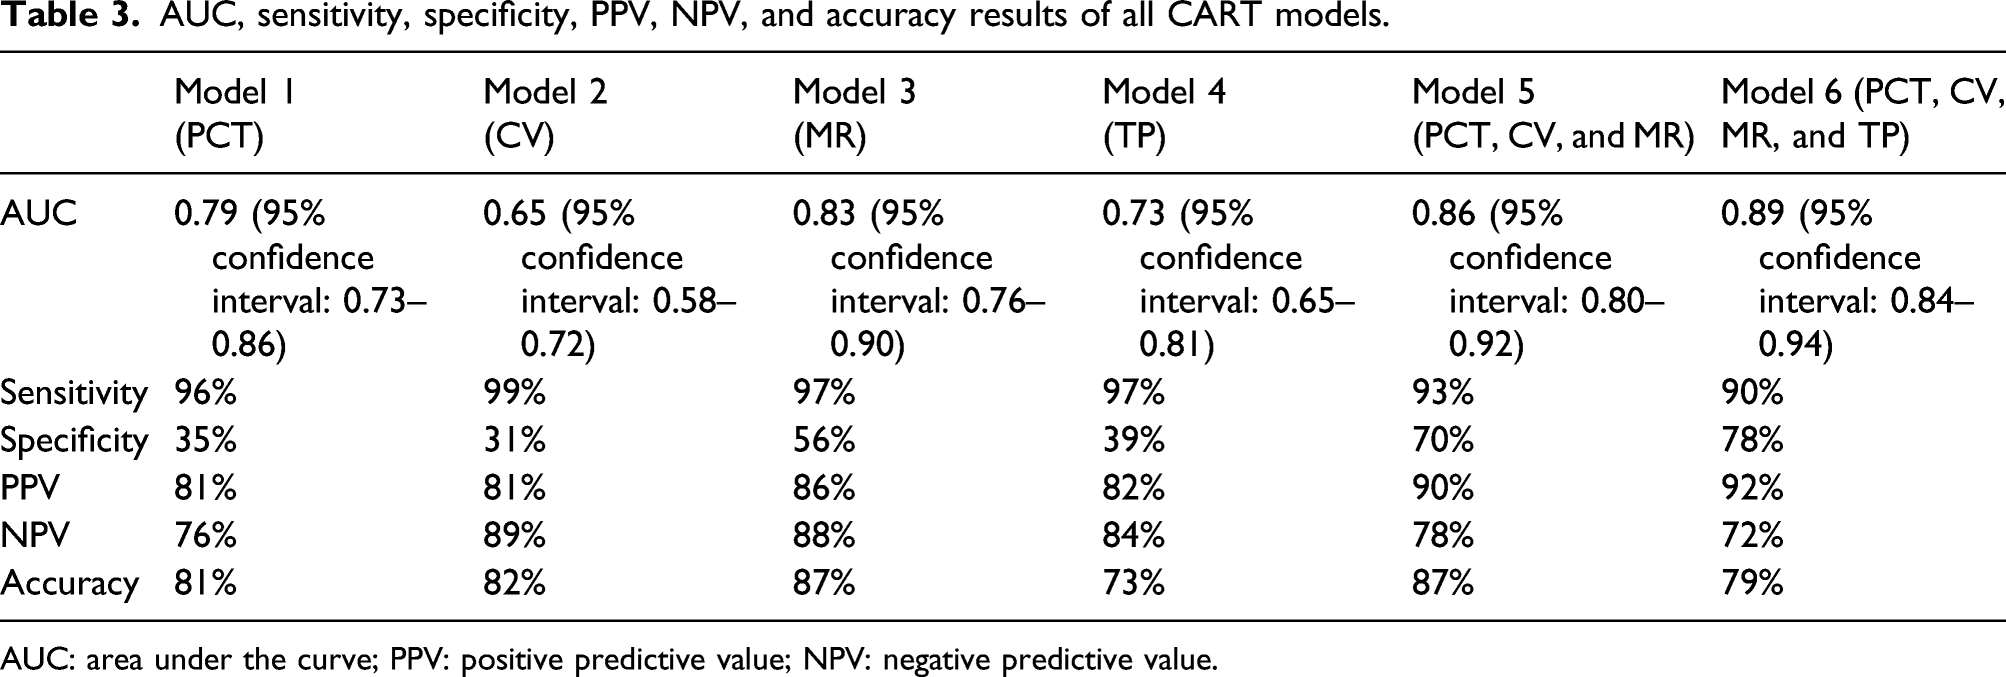
AUC: area under the curve; PPV: positive predictive value; NPV: negative predictive value.
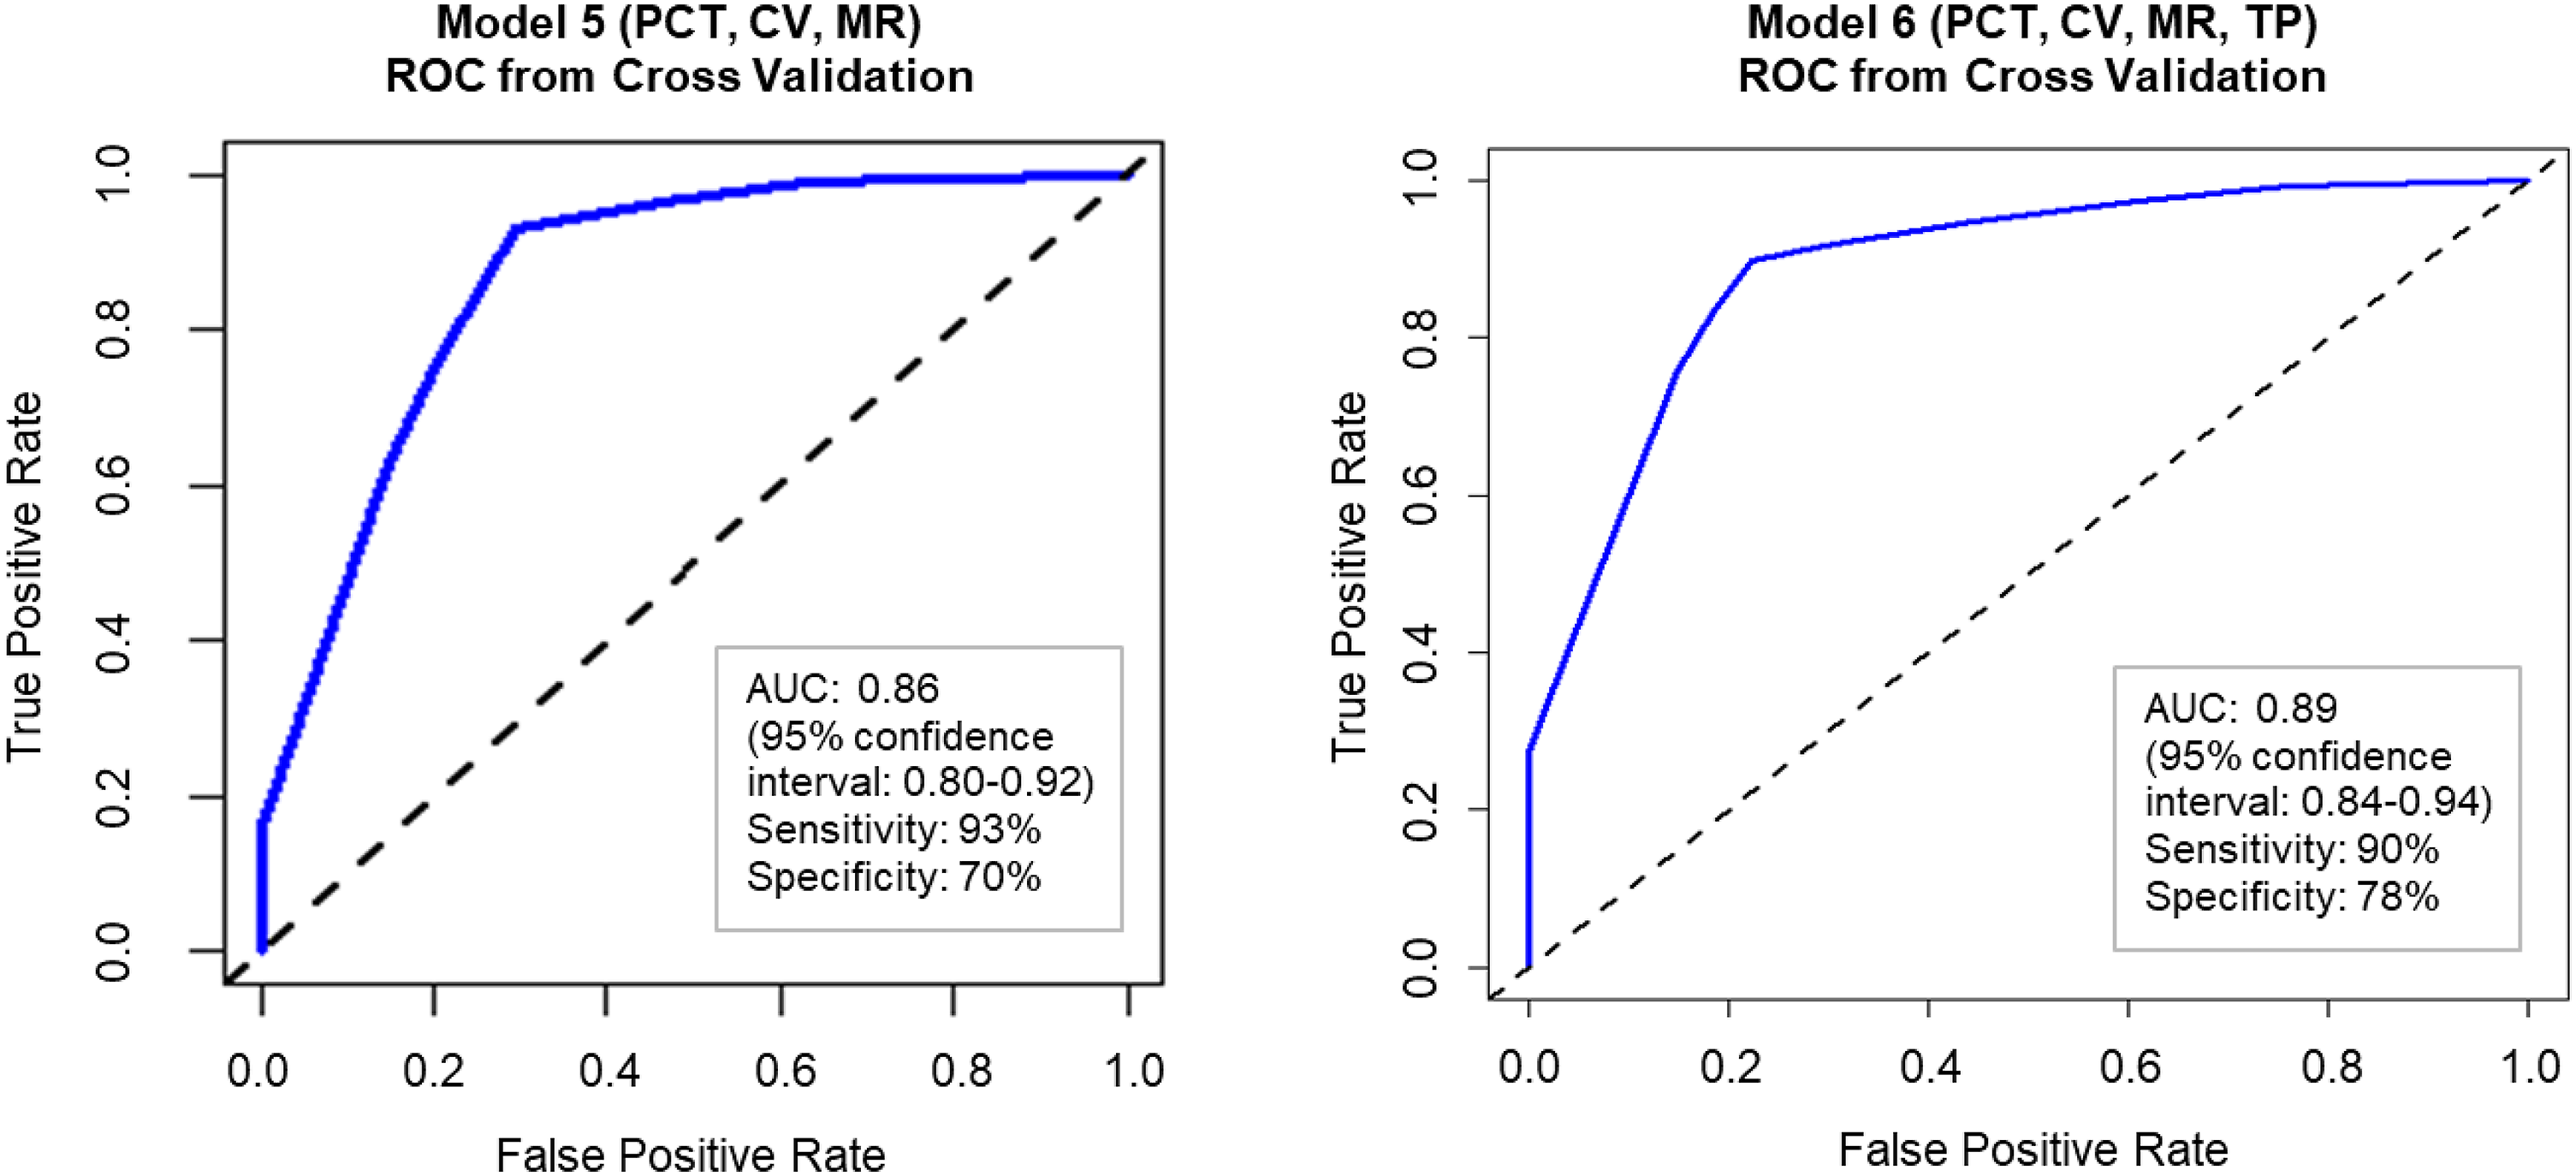
Receiver operator characteristic curves of Model 5 (PCT, CV, and MR) and Model 6 (PCT, CV, MR, and TP). AUC, area under the curve; PCT, percentage correct responses; CV, coefficient of variation; MR, mean reaction time; TP, throughput.
Identify the most discriminatory ANAM subtests and scores and comparison to composite indices (objective 2)
The most discriminatory subtests and scores from Model 5 (PCT, CV, and MR) were MR Procedural Reaction Time, CV Spatial Processing, MR Tapping Left Hand, CV Running Memory, CV Logical Relations, CV Simple Reaction Time Repeated, MR Code Substitution Learning and MR Spatial Processing. Age was also an important factor. The most discriminatory subtests and scores from Model 6 (PCT, CV, MR, and TP) were the same as above except for TP Code Substitution Learning and CV Two Choice Reaction Time instead of MR Code Substitution Learning and MR Spatial Processing.
Comparison of AUCs and ANAM subtests between CART analysis and composite indices for Models 5 and 6.
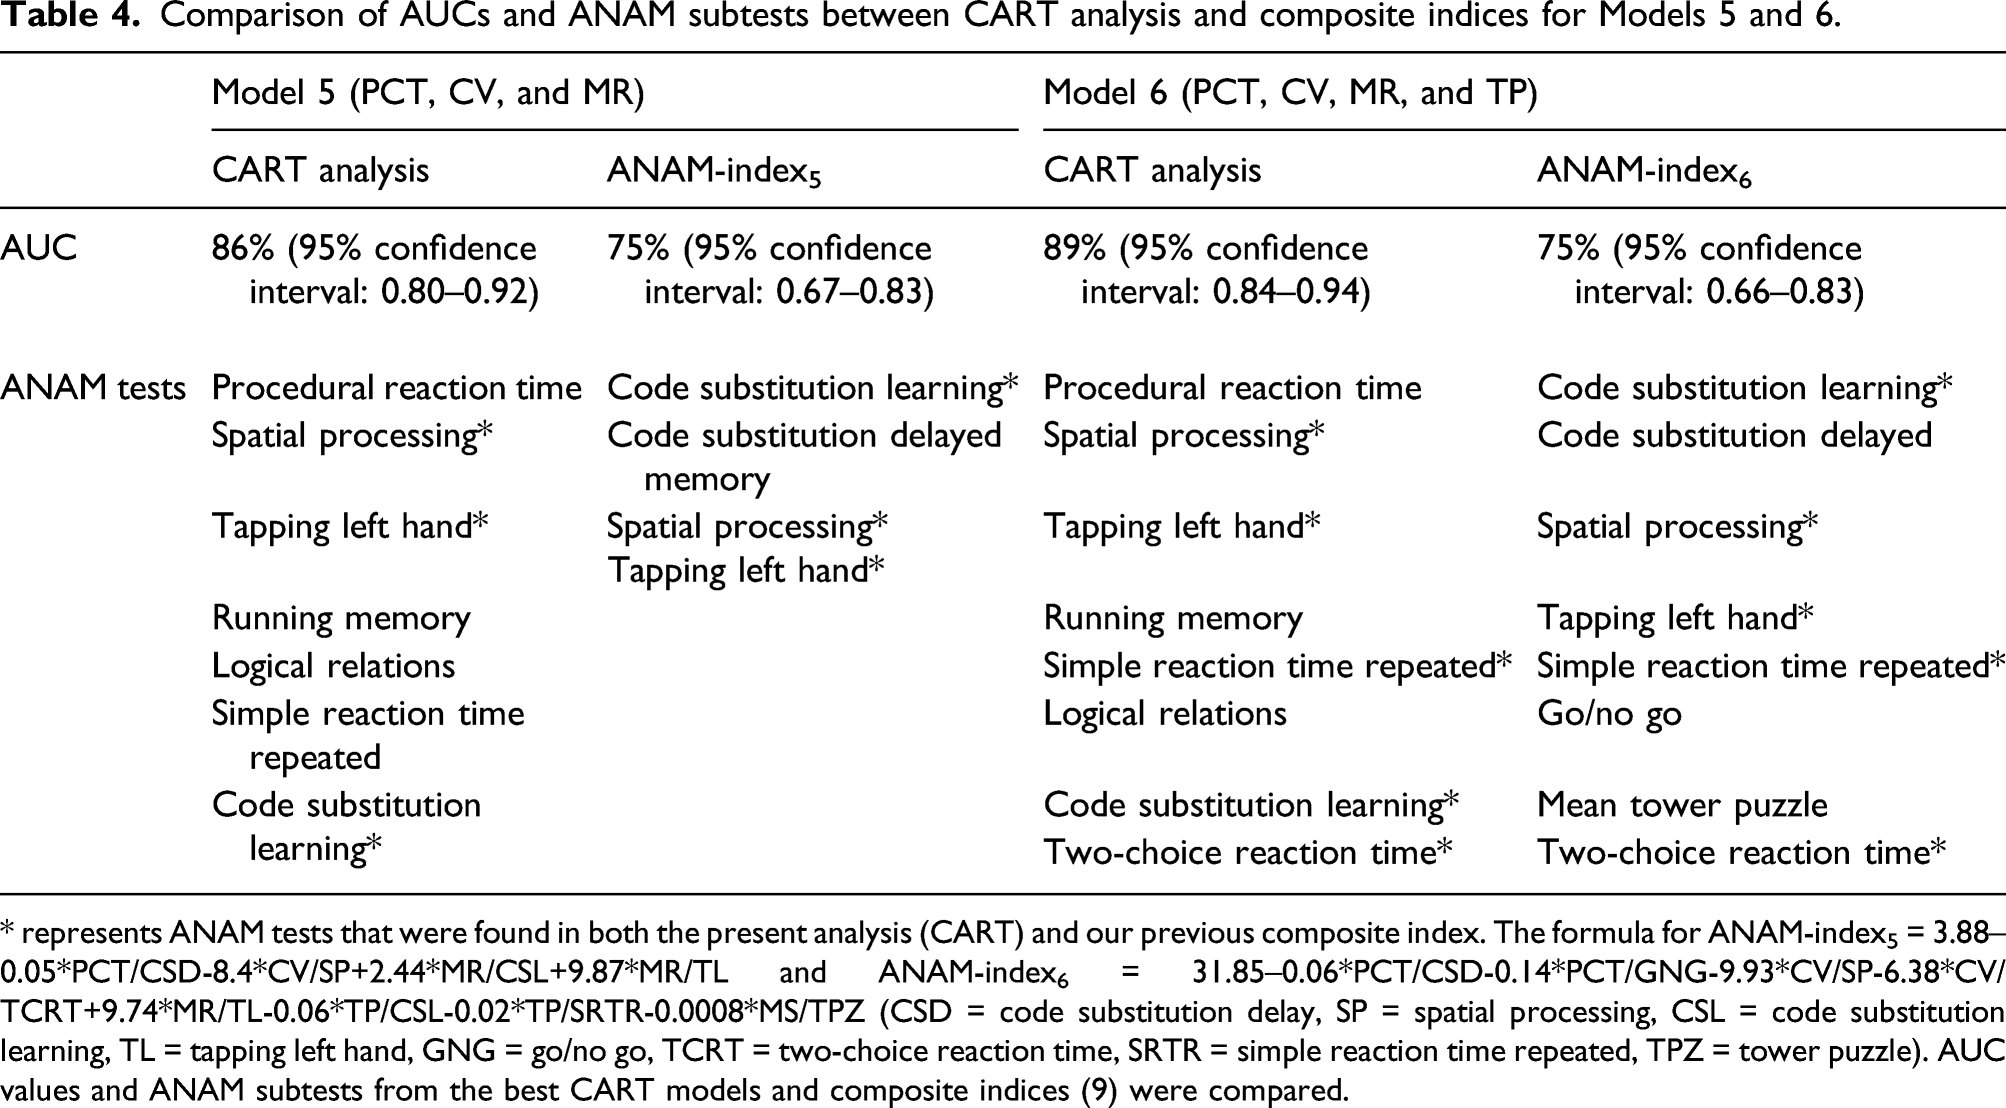
* represents ANAM tests that were found in both the present analysis (CART) and our previous composite index. The formula for ANAM-index5 = 3.88–0.05*PCT/CSD-8.4*CV/SP+2.44*MR/CSL+9.87*MR/TL and ANAM‐index6 = 31.85–0.06*PCT/CSD-0.14*PCT/GNG-9.93*CV/SP-6.38*CV/TCRT+9.74*MR/TL-0.06*TP/CSL-0.02*TP/SRTR-0.0008*MS/TPZ (CSD = code substitution delay, SP = spatial processing, CSL = code substitution learning, TL = tapping left hand, GNG = go/no go, TCRT = two-choice reaction time, SRTR = simple reaction time repeated, TPZ = tower puzzle). AUC values and ANAM subtests from the best CART models and composite indices (9) were compared.
New approach to interpret ANAM results using CART decision trees (objective 3)
Model 5 (PCT, CV, and MR) and Model 6 (PCT, CV, MR, and TP) were the two models that had AUC ≥0.81, sensitivity ≥80%, and specificity values ≥70%. Since Models 5 and 6 both consisted of the same seven subtests and Model 6 included an additional test, we decided to only redesign the decision tree of Model 6 for potential clinical use (Figure 2). Age was also shown to be an important factor for CI in SLE patients and was included in the decision tree. The algorithm for Model 5 predicted 79.8% of the indeterminate group (n=89) to have CI and the algorithm for Model 6 predicted 74.2% of the indeterminate group to have CI. Adapted CART analysis decision tree of Model 6 (PCT, CV, MR, and TP) displaying the most discriminatory subtests and scores from the ANAM for detecting CI in patients with SLE. This decision tree based on Model 6 (PCT, CV, MR, and TP) was adapted to reflect a simple flowchart for clinicians to use. This decision tree includes the most discriminatory ANAM subtests (8 subtests) and is organized hierarchically (most discriminatory subtests closer to the top). The 11 terminal nodes at the bottom of the decision tree report the classification of CI or no CI. CI, cognitive impairment; PCT, percentage correct responses; CV, coefficient of variation; MR, mean reaction time; TP, throughput.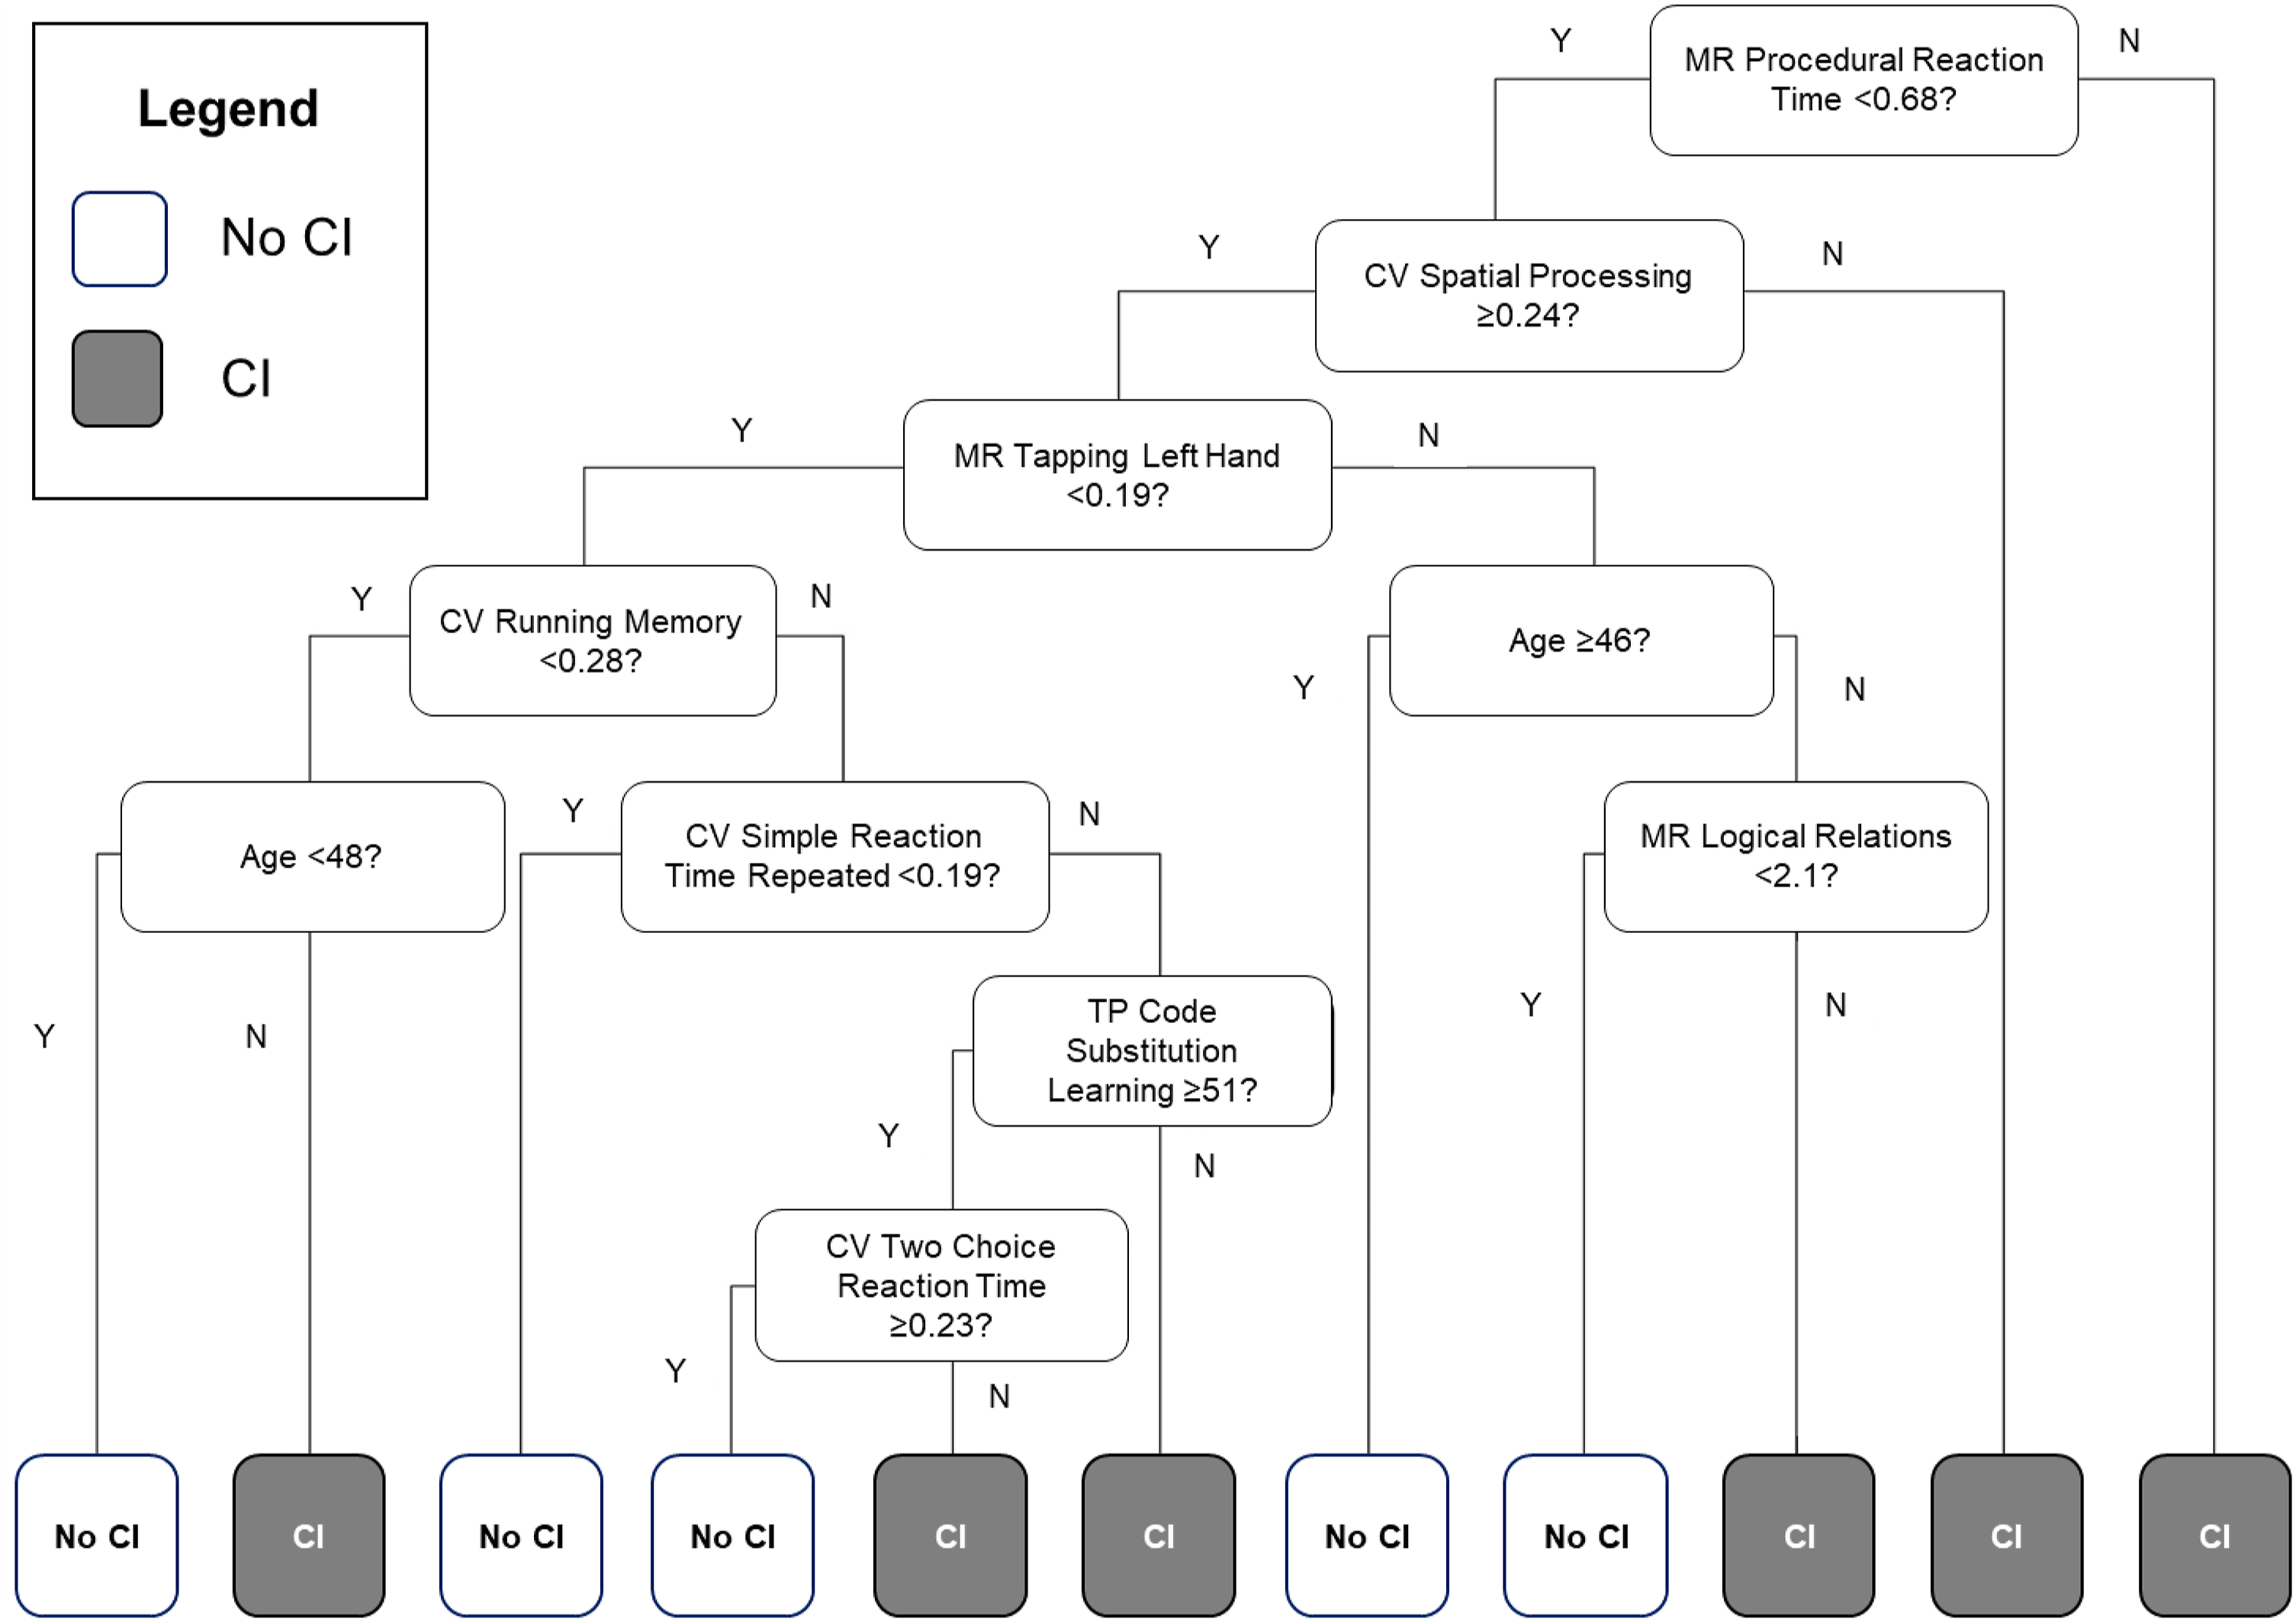
Discussion
This is the first study using CART analysis to predict CI in SLE using the ANAM benchmarked against the gold standard ACR-NB. Our results extend the literature on the concurrent criterion validity of the ANAM as a screening tool for CI in SLE, and builds upon our previous study which used a composite index derived by logistic regression (9). Our results demonstrate that the ANAM can accurately differentiate between CI and non-CI SLE patients who have been classified using traditional neuropsychological testing. CART identified the most discriminatory subtests and scores of the ANAM for detecting CI in SLE patients, which notably reduces ANAM completion time from 40 to 15–20 min, and parallels results from our previous study (9). Furthermore, the decision tree provides high clinical utility, allowing clinicians to classify patients using a simple, visual algorithm. With no current standard screening tool and high costs associated with comprehensive neuropsychological testing, our findings strengthen the utility of the ANAM as a large-scale screening method.
Similar to our previous study, our analyses showed that specific ANAM subtests were associated with CI in patients with SLE. These subtests assess attention and processing speed, visual-spatial perception, fine motor processing, language processing, and learning and memory (Table 1). The only domain not represented by these ANAM tests was executive function, in which 21% of our cohort was found to be impaired based on the adapted ACR-NB. These findings highlight a few considerations. First, impairment on executive function tests from the adapted ACR-NB may be secondary to impairments in related domains such as attention/processing speed. This is suggested as half of the reported discriminatory ANAM tests represent attention and processing speed, which is considered a lower-level function that affects, and can compromise, executive function (25, 26). Second, the ANAM has been found to be sensitive to attention, processing speed, and working memory (27-29), and this domain comprises the greatest number of tests. Finally, the structural validity of the full ANAM GNS v4 battery has not yet been studied, leaving an area for future research to explore. Overall, the ANAM is able to measure cognitive efficiency but may be limited in its ability to assess higher-level cognitive functions. However, as a screening tool, the ANAM has been successful in classifying CI and non-CI, and comprehensive neuropsychological tested should be used if further assessment of cognitive function is warranted.
In addition to the most discriminatory ANAM subtests, performance score was also reported (e.g., PCT, CV, MR, and TP). In past studies investigating the performance of the ANAM in patients with or without SLE, many studies have only used TP as the outcome (30–32). For example, Roebuck-Spencer et al. (30) found a sensitivity of 76%, specificity of 83% and overall correct classification rate of 80%. However, when comparing ANAM subtests using TP to equivalent neuropsychological tests, only moderate associations were found (30–32). Our two best models using a combination of scores had AUCs of 86% and 89%, respectively, compared to the model using only TP (AUC of 73%). These findings further demonstrate the importance of including all scores, echoing our previous study results where the two models with a combination of scores had the highest AUCs (81% and 84%) (9). Brunner et al. also found a combination of scores to be better at assessing CI than TP alone in pediatric patients with SLE, with 100% sensitivity and 86% specificity for detecting moderate/severe CI (33). Furthermore, it is noteworthy that Model 3, which used MR scores only, performed closely to Models 5 and 6 in terms of AUC (83%), with a higher sensitivity (97%) but lower specificity (56%). This highlights that MR scores play an important role in the CI classification process. Model 3 decision tree can be found in Supplementary Figure S1.
Age was also found to be an important predictor of CI, appearing in both Model 5 and 6, although it was lower in the decision tree relative to other predictors. We excluded sex and level of formal education from the final analysis because they were not found to be important predictors of CI, added statistical noise, and reduced the ANAM’s performance. This could be explained by the simplicity of most ANAM subtests, as they were designed to be completed by anyone regardless of education level. Furthermore, the ratio of male to female participants in our cohort was about 1:8; thus, the number of males in each node of CART analysis was small and unlikely to affect the results. Previous studies examining the effects of demographic factors on ANAM performance have consistently found sex and education to have little-to-no effect on most ANAM tests (34–36).
CART models 5 and 6 had higher AUCs compared to the composite indices from our previous study derived using logistic regression. This may be because CART can handle highly skewed data and missing values and is robust to data irregularities (i.e., outliers and multicollinearity), unlike other multivariate modeling methods (11, 12, 18). However, in comparing results from the current and previous study, we must note that the composite indices developed previously were derived from an older sample (n=211) with a different proportion of patients with CI (45.5%) and without CI (24.6%). The current sample (n=300) had a higher prevalence of CI (52%) and lower prevalence of non-CI patients (18%). Therefore, we cannot make definitive conclusions as to the best method for interpreting ANAM scores (composite indices vs. CART decision tree) from this study, and it is better to view these approaches as complementary, providing converging evidence. Future directions include using both methods on the same dataset for direct comparison.
The decision tree generated by CART encompasses the most discriminatory ANAM subtests and scores, and is easy to interpret (9). We propose using the decision tree from Model 6 (PCT, CV, MR, and TP) (Figure 2) as it had the highest AUC and provides a more comprehensive evaluation for CI compared to Model 5 (both are identical except for the additional test in Model 6). Upon classification of CI status and clinical judgment, the clinician can then determine whether further neuropsychological testing is warranted for diagnosis. Future directions include creating a more robust clinical tool, such as an application/calculator that automatically classifies patients based on inputs from ANAM results.
There are several limitations of the study. One is possible selection bias, as the population was drawn from a tertiary care center with possible referral biases. The prevalence of CI in our cohort was relatively high (52%), but within the wide range of CI rates (15–79%) in SLE described in the literature (1, 9, 37, 38).
Our final analysis only included patients that were classified as CI or non-CI. We excluded the indeterminate group to reduce heterogeneity in our sample for the purpose of generating initial validity evidence. However, we did apply the algorithms from our best CART models (5, 6) on the indeterminate group (n=89), where Model 5 predicted 79.8% to have CI and Model 6 predicted 74.2% to have CI. This preliminary result classifies most of the indeterminate group as cognitively impaired based on our screening algorithm. However, further research on larger samples is needed as to how to best handle indeterminate patients in screening tests. As well, the study may be vulnerable to order effects, specifically related to fatigue. The ANAM was completed after the adapted ACR-NB on the same day. While the tests from the ANAM and the adapted ACR-NB are overlapping in procedures, the measures differ with item content, making practice effects less likely; however, familiarity with general procedures may have reduced anxiety on the ANAM.
Perhaps of greatest importance is the need to use caution when using the ANAM with patients with arthritis, joint stiffness, joint deformities and/or neuropathies—common sequelae of SLE—who may not perform optimally on motor and dexterity tasks due to peripheral rather than central (cognitive or psychomotor) causes. Future research should address the extent of losses in validity of the ANAM with these patients and perhaps propose alternative measures or correction factors. Finally, the current results are generalizable only to the English-speaking population as the methods have only been evaluated on participants fully fluent in English.
Conclusion
This study extends the validity evidence for the ANAM as a screening tool for CI in patients with SLE. The most discriminatory subtests and scores of the ANAM were identified using CART, reducing the duration of the battery. A decision tree was generated to increase clinical utility and aid interpretation of ANAM results. We recommend use of the ANAM and the current decision tree as a clinical screening tool for CI in adult patients with SLE who are fluent in English and without significant motor impairments.
Supplemental Material
sj-pdf-1-lup-10.1177_09612033211062530 – Supplemental Material for Validation of the automated neuropsychological assessment metrics for assessing cognitive impairment in systemic lupus erythematosus
Supplemental Material, sj-pdf-1-lup-10.1177_09612033211062530 for Validation of the automated neuropsychological assessment metrics for assessing cognitive impairment in systemic lupus erythematosus by Kimberley Yuen, Dorcas Beaton, Kathleen Bingham, Patricia Katz, Jiandong Su, Juan Pablo Diaz Martinez, Maria Carmela Tartaglia, Lesley Ruttan, Joan E. Wither, Mahta Kakvan, Nicole Anderson, Dennisse Bonilla, May Y. Choi, Marvin J. Fritzler, Robin Green and Zahi Touma in Lupus
Supplemental Material
sj-pdf-2-lup-10.1177_09612033211062530 – Supplemental Material for Validation of the automated neuropsychological assessment metrics for assessing cognitive impairment in systemic lupus erythematosus
Supplemental Material, sj-pdf-2-lup-10.1177_09612033211062530 for Validation of the automated neuropsychological assessment metrics for assessing cognitive impairment in systemic lupus erythematosus by Kimberley Yuen, Dorcas Beaton, Kathleen Bingham, Patricia Katz, Jiandong Su, Juan Pablo Diaz Martinez, Maria Carmela Tartaglia, Lesley Ruttan, Joan E. Wither, Mahta Kakvan, Nicole Anderson, Dennisse Bonilla, May Y. Choi, Marvin J. Fritzler, Robin Green and Zahi Touma in Lupus
Supplemental Material
sj-pdf-3-lup-10.1177_09612033211062530 – Supplemental Material for Validation of the automated neuropsychological assessment metrics for assessing cognitive impairment in systemic lupus erythematosus
Supplemental Material, sj-pdf-3-lup-10.1177_09612033211062530 for Validation of the automated neuropsychological assessment metrics for assessing cognitive impairment in systemic lupus erythematosus by Kimberley Yuen, Dorcas Beaton, Kathleen Bingham, Patricia Katz, Jiandong Su, Juan Pablo Diaz Martinez, Maria Carmela Tartaglia, Lesley Ruttan, Joan E. Wither, Mahta Kakvan, Nicole Anderson, Dennisse Bonilla, May Y. Choi, Marvin J. Fritzler, Robin Green and Zahi Touma in Lupus
Footnotes
Declaration of conflicting interests
The author(s) declared no potential conflicts of interest with respect to the research, authorship, and/or publication of this article.
Funding
The author(s) received no financial support for the research, authorship, and/or publication of this article: This project is funded by grants from the Arthritis Society of Canada, Canadian Institutes of Health Research, Physician’s Services Incorporated, the Province of Ontario Early Research Award, and the Lupus Research Alliance. Dr. Touma is supported by the Arthritis Society, Young Investigator Award and the Canadian Rheumatology Association (CIORA)—Arthritis Society Clinician Investigator Award and by the Department of Medicine, University of Toronto. Dr. Touma’s laboratory is supported by donations from the Kathi and Peter Kaiser family, the Lou and Marissa Rocca family and the Bozzo family. Dr. Wither is supported by a Pfizer Chair Research Award.
References
Supplementary Material
Please find the following supplemental material available below.
For Open Access articles published under a Creative Commons License, all supplemental material carries the same license as the article it is associated with.
For non-Open Access articles published, all supplemental material carries a non-exclusive license, and permission requests for re-use of supplemental material or any part of supplemental material shall be sent directly to the copyright owner as specified in the copyright notice associated with the article.