
Abstract
This pioneering literature review represents a seminal moment in the field, providing the first exhaustive and systematic exploration of the contemporary conceptualisations of data analytics (DA), business analytics (BA), and business intelligence (BI), thereby laying the foundation for a deeper understanding of these complex and interconnected phenomena. By providing a thorough and authoritative overview of these concepts, this review empowers library professionals with a lucid understanding of the data analytics phenomenon, enabling them to navigate this complex landscape with confidence and clarity. Despite the growing importance of data-driven decision-making in university libraries, research on data analytics in this context is scarce. By investigating these aspects, this review provides comprehensive insights for library professionals to effectively navigate the trend and inform data-driven decision-making in academic librarianship. A systematic search of databases, including Scopus, Web of Science, and Google Scholar was conducted to identify relevant literature. This review reveals a significant knowledge gap in understanding the specific obstacles that hinder the effective application of data analytics in transforming decision-making processes. Moreover, this review reveals a notable absence of comprehensive guidance on leveraging analytics for informed decision-making, highlighting the need for in-depth recommendations to support successful implementation. This review contributes to the existing literature by identifying gaps in current research and provides a foundation for further investigation into analytics adoption in Australian university libraries. This literature review meaningfully extends the current body of knowledge on the subject by shedding light on a previously unaddressed gap, thereby paving the way for future research and exploration.
Keywords
Introduction
Analytics has emerged as a vital catalyst for institutional enhancement and accountability, empowering data-driven decision-making (Harper and Oltmann, 2017; Jantti, 2016; Konchak et al., 2021; Roy, 2024; Showers, 2015; Sparks et al., 2016). Becker (2014), Monino (2021) in their study asserts that big data is the oil of the 21st century, as the power to exploit big data has become a success factor for different sectors such as public administrations (PAs), private firms, and civil society.
According to Hamad et al. (2022), technological advancements drive academic libraries to adopt cutting-edge, patron-centric models, providing seamless remote access to scholarly materials for digitally proficient users. However, their study overlooks the factors such as how the societal, economic, and institutional factors influencing technological adoption.
Azam and Ahmad (2024) investigate big data analytics (BDA) adoption for sustaining library services in Pakistani academic libraries. Their study reveals significant relationships between performance expectancy, effort expectancy, social influence and behavioural intention. Facilitating conditions also impact BDA adoption, influencing library service sustainability. Similarly, Roy (2024) examines data analytics integration benefits and hurdles within university libraries in Australia, highlighting prospects for strategic enhancement. A recent systematic literature reviews conducted by Shakeel et al. (2024) investigate big data analytics’ (BDA) impact on university libraries, unveiling adoption challenges and proposing an implementation framework. The researchers identified key challenges hindering BDA-based service adoption: inadequate awareness and expertise among library staff, technical complexities and concerns surrounding data integrity and security (Daniel, 2015; Tsai et al., 2022). These obstacles underscore the need for targeted strategies addressing human, technological and data governance capacities. Similarly, Shah et al. (2023) found that Library and Information Science (LIS) professionals’ analytical skills significantly influence perceived ease of use and usefulness of Digital Data Sets Management Practices (DDSMP). Their study highlights key factors driving DDSMP adoption and academic library performance enhancement, emphasising analytical skills, perceived ease, usefulness and LIS professionals’ attitudes. Patterson and Martzoukou (2012) identify the importance of information management skills for business success. The findings show that the exponential growth of diverse, low-quality information underscores the critical need for efficient data filtration, analysis, and transformation into strategic business knowledge. While Patterson and Martzoukou (2012) highlight essential skills for information management, their framework lacks specificity on how individuals and organisations can cultivate these competencies, particularly in resource-constrained environments.
By leveraging data collection and sharing, university libraries are shifting towards a more data-driven culture, aimed at optimising library services, fostering collaboration with university stakeholders, and paving the way for future innovations and advancements. (Ashaari et al., 2020; Harper and Oltmann, 2017; Konchak et al., 2021; Roy, 2024; Showers, 2015). Besides, Zhan and Widén (2019) noted that since librarians require knowledge management, the skills to maintain and utilise knowledge generated from big data analytics are also needed.
The power to better understand the movement of large amounts of data in a company and the capability to deploy that data to meet a customer’s needs is invaluable from a services standpoint (Litsey and Mauldin, 2018). Therefore, integrating the data of various systems and platforms is essential for enhancing and developing accurate decision-making systems. Showers (2015) found that analytics is a new tool that can be added to existing methods for better outcomes and services. Similarly, Agasisti and Bowers (2017) found that traditional data analyses are replacing more sophisticated analytics forms. A recent investigation conducted by Roy (2024) examined the adoption of data analytics in Australian university libraries through the lens of the Unified Theory of Acceptance and Use of Technology 2 (UTAUT2) framework. This study aimed to identify the key factors that influence the acceptance of analytics among library professionals. The proliferation of data analytics in recent years can be attributed to the exponential growth in computing power, rendering data a vital resource in the digital era. As technological advancements continue to accelerate, the integration of data analytics in university libraries has become an increasingly pertinent area of research, warranting further exploration into the factors that facilitate or hinder its adoption. The pervasive influence of analytics is revolutionising the way information is harnessed, scrutinised, and leveraged, enabling organisations to lead with confidence, make informed decisions, measure progress, manage resources effectively, and optimise performance for enhanced efficiency and tangible benefits (Ashaari et al., 2020; Chandler et al., 2011; Konchak et al., 2021).
Roy’s (2024) study, while shedding light on factors influencing data analytics adoption in Australian university libraries through the UTAUT2 framework, falls short by neglecting to investigate strategies for overcoming implementation challenges, thereby limiting its practical applicability for library professionals seeking actionable solutions.
BDA is becoming increasingly crucial for library professionals to understand how to effectively use analytics to improve the quality and efficiency of library services. However, Mahroeian and Daniel (2021), Maraza-Quispe et al. (2022), Showers (2015) stated that, although there is growing attention to analytics within the higher education sector, including libraries, the full advantages of analytics are not clearly understood. A study in Latin America also shows that the implementation of Learning Analytics (LA) in Higher Education Institutions is still in its early stages (Hilliger et al., 2020).
This literature review seeks to address knowledge gap by investigating the adoption of data analytics, business analytics and business intelligence in university libraries. Despite the growing importance of data-driven decision-making in academic librarianship, there is a scarcity of research on the application of analytics in this context. This literature review aims to synthesise current findings on data analytics, business analytics, and business intelligence, with a specific focus on their adoption by academic library professionals. By examining the existing body of knowledge, this study endeavours to:
• To conduct a comprehensive combination of existing literature on the current landscape of data analytics, business analytics, and business intelligence in academic librarianship.
• To reveal knowledge gaps in analytics adoption, providing actionable insights for future research in university libraries.
Ultimately, this research seeks to contribute to the development of a more informed and strategic approach to analytics adoption in university libraries, enabling librarians to thrive in an increasingly data-driven environment.
Literature review
Definitional views of analytics
In response to the surging interest in analytics, IT firms and data analysts have been actively engaged in crafting definitions that bring precision and clarity to this dynamic and rapidly evolving domain. The term ‘analytics’ is frequently applied across different industries (Basu and Basu, 2016; Cochran, 2018; Cooper et al., 2012; Rose, 2016). According to (SAP, 2022), analytics is a field of computer science that utilises math, statistics, and machine learning to discover meaningful patterns in data. Data analytics affects sifting through massive data sets to find, analyse, and share new understandings and knowledge. Basu and Basu (2016) conceptualised analytics as three-phase business tool, commencing with descriptive analytics, which involves generating reports to examine the historical trajectory of business activities. This initial step provides a comprehensive understanding of past performance, laying the groundwork for informed decision-making. The subsequent phase, predictive analytics, leverages the insights gleaned from historical data to develop forecasting models, enabling businesses to anticipate future outcomes. The final phase, prescriptive analytics, involves the strategic application of these models to optimise future performance, empowering organisations to exert greater control over their trajectory.
Analytics cannot be performed without the help of advanced software (Basu and Basu, 2016). In the last few years, there are many studies on Analytics, and the terms are explained from different viewpoints. Table 1 represents the definitional views of analytics.
Definitional views of analytics.
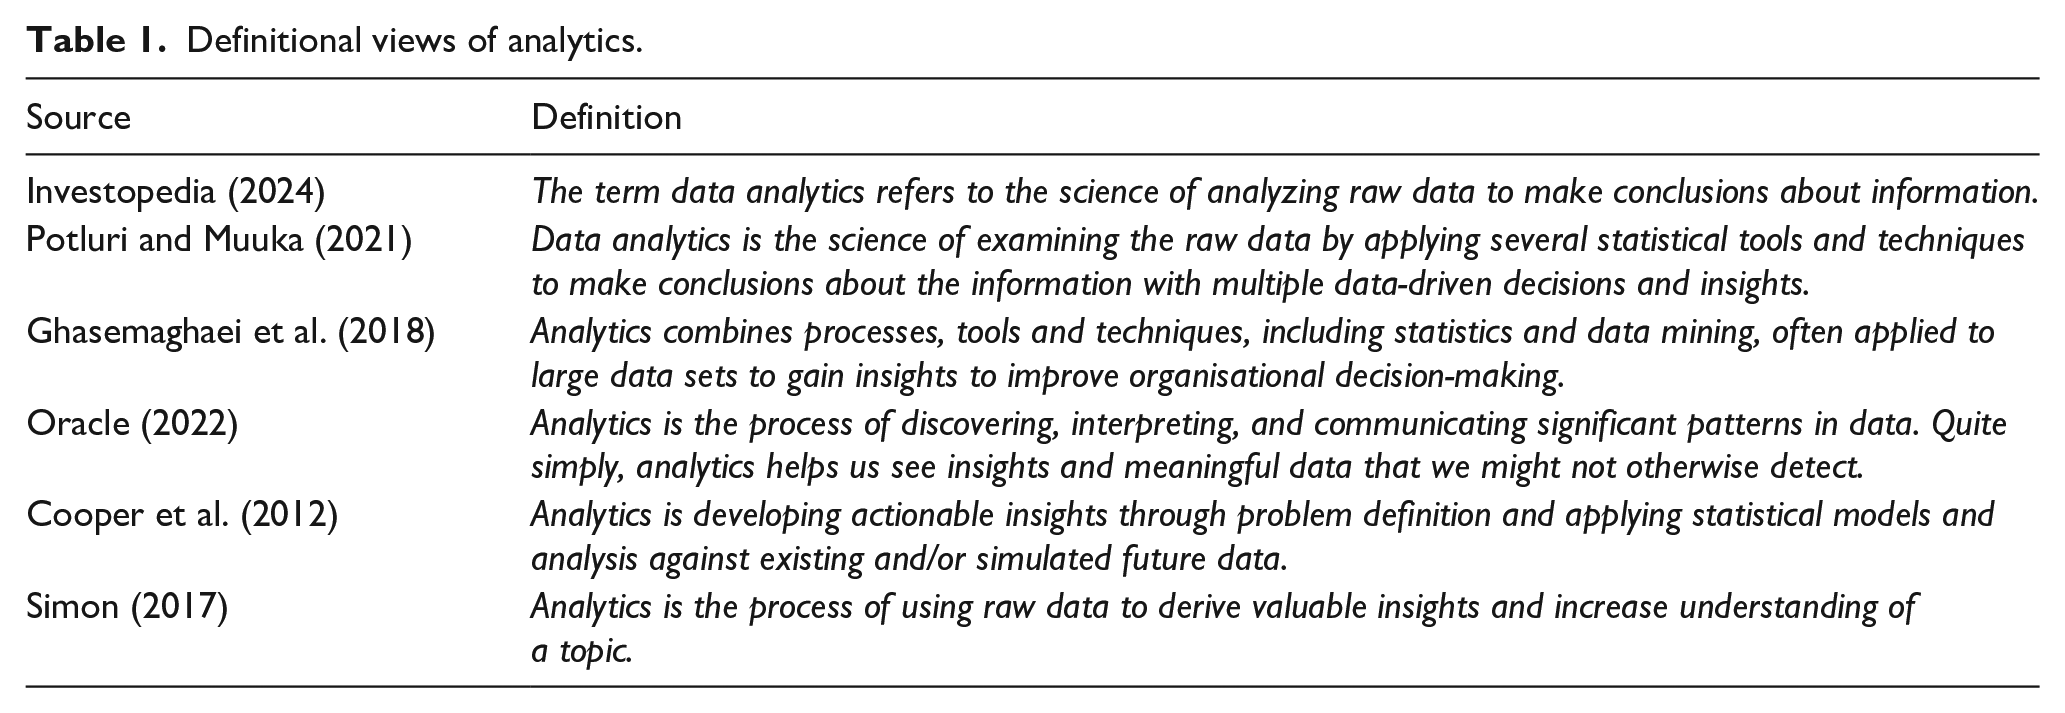
According to the prevailing evidence in the current literature, it is reasonable to suggest that, Analytics is the process of examining data from various domains, applying statistical tools and techniques to gain insights, and developing actionable intelligence to inform decision-making and drive business outcomes.
This definition combines the key elements of analytics, including:
• Examining data from specific domains or broad business areas
• Applying statistical tools and techniques
• Gaining insights and developing actionable intelligence
• Informing decision-making and driving business outcomes
Classification and evolution of analytics
This section explores the various types of analytics applications, including descriptive, predictive, prescriptive, and cognitive analytics, and how they are used to answer different questions and inform decision-making. Researchers have developed taxonomies of analytics and their applications in different domains, including IoT (Vashisht et al., 2021). Kitchin (2014) identified four broad classes of analytics: descriptive, diagnostic, predictive, and prescriptive. Descriptive analytics, used by over 90% of companies, provides historical data analysis. Diagnostic analytics answers ‘why’ questions, while predictive analytics forecasts future events. Prescriptive analytics recommends optimal solutions, combining descriptive and predictive analytics. Bothe (2022) described analytics maturity as a five-step process: descriptive, diagnostic, predictive, prescriptive, and cognitive. Cognitive analytics integrates previous types into autonomous systems for independent monitoring and decision-making. Analytics techniques are evolving rapidly. Liberatore and Luo (2010) defined analytics as analytical methodologies used in logical analysis and decision-making. Davenport (2013) described the progression from Analytics 1.0, focusing on objective understanding, to Analytics 2.0, the era of big data, and now Analytics 3.0 and 4.0, with the latter relying on multi-sensing solutions for reliability in automated systems (Mayer and Baeumner, 2018). This type of analytics often answers the question, ‘how to adapt to change?’ Figure 1 shows the different types of analytics and their maturity in the analytics journey.
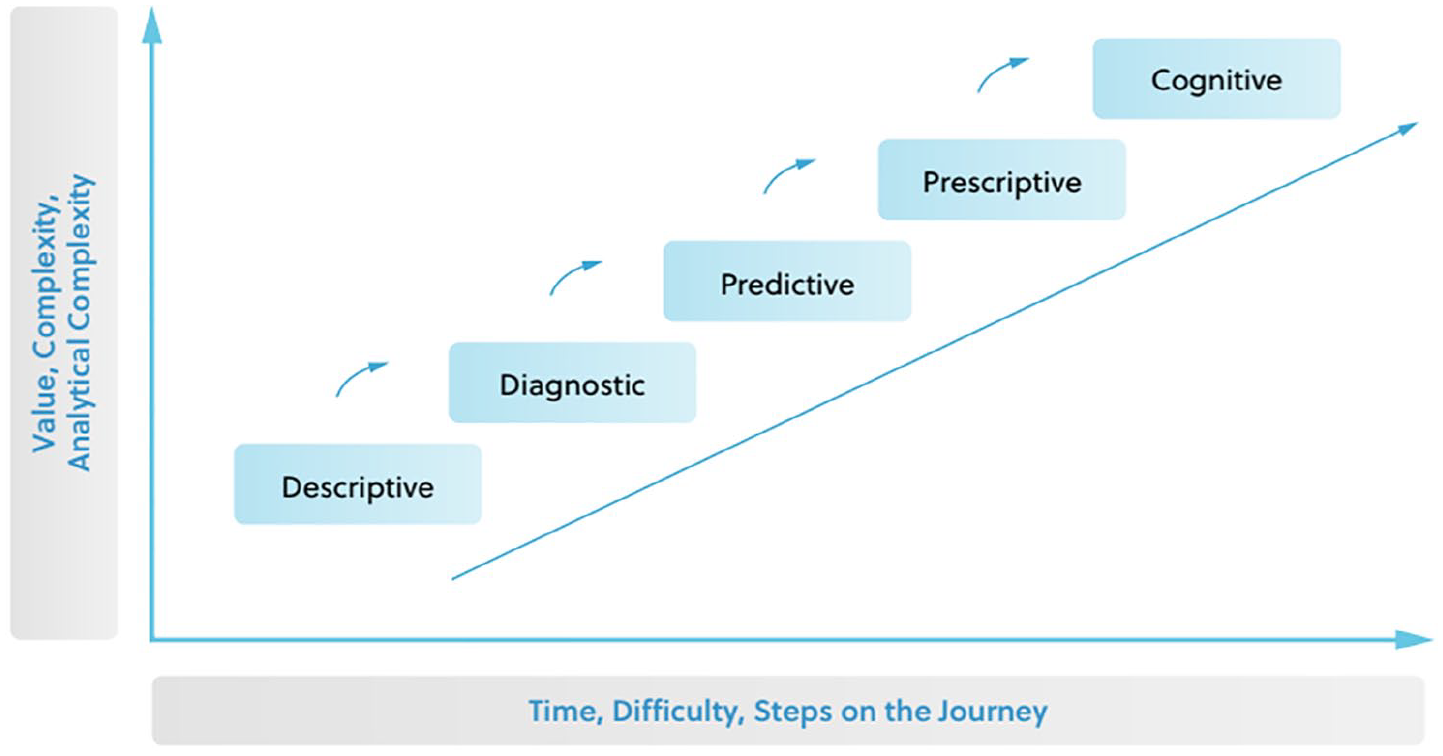
Aggregation of the typical visualisations of analytics maturity and the analytics journey (Bothe et al., 2022).
According to Liberatore and Luo (2010), Sarker (2021), analytics is analytical methodologies or techniques used in logical analysis and a process of transforming data into actions through analysis and insights in the context of intelligent organisational decision-making and problem-solving. However, the generation of analytics is changing rapidly. According to Davenport (2013), analytics 1.0 was a time of real progress in gaining an objective, deep understanding of essential business phenomena and giving managers the fact based decision-making decisions. In contrast, analytics 2.0 was the era of big data; some of us now perceive another shift in analytics which is 3.0. However, many analytics experts are now talking about analytics 4.0. For example, Mayer and Baeumner (2018) stated that analytics 4.0 would often rely on multi-sensing solutions to obtain the required reliability in an automated system.
Definitional views of data, big data (BD), business intelligence (BI), business analytics (BA) and data analytics
To harness the power of data, it’s essential to understand the hierarchy of data and its various levels. Understanding the hierarchy of data is crucial for unlocking the power of analytics and informing decision-making (Janssen et al., 2017; Khine and Shun, 2017). The following Table 2 illustrates the progression from raw data to actionable insights:
Basic data hierarchy as shown in Table (Khine and Shun, 2017).
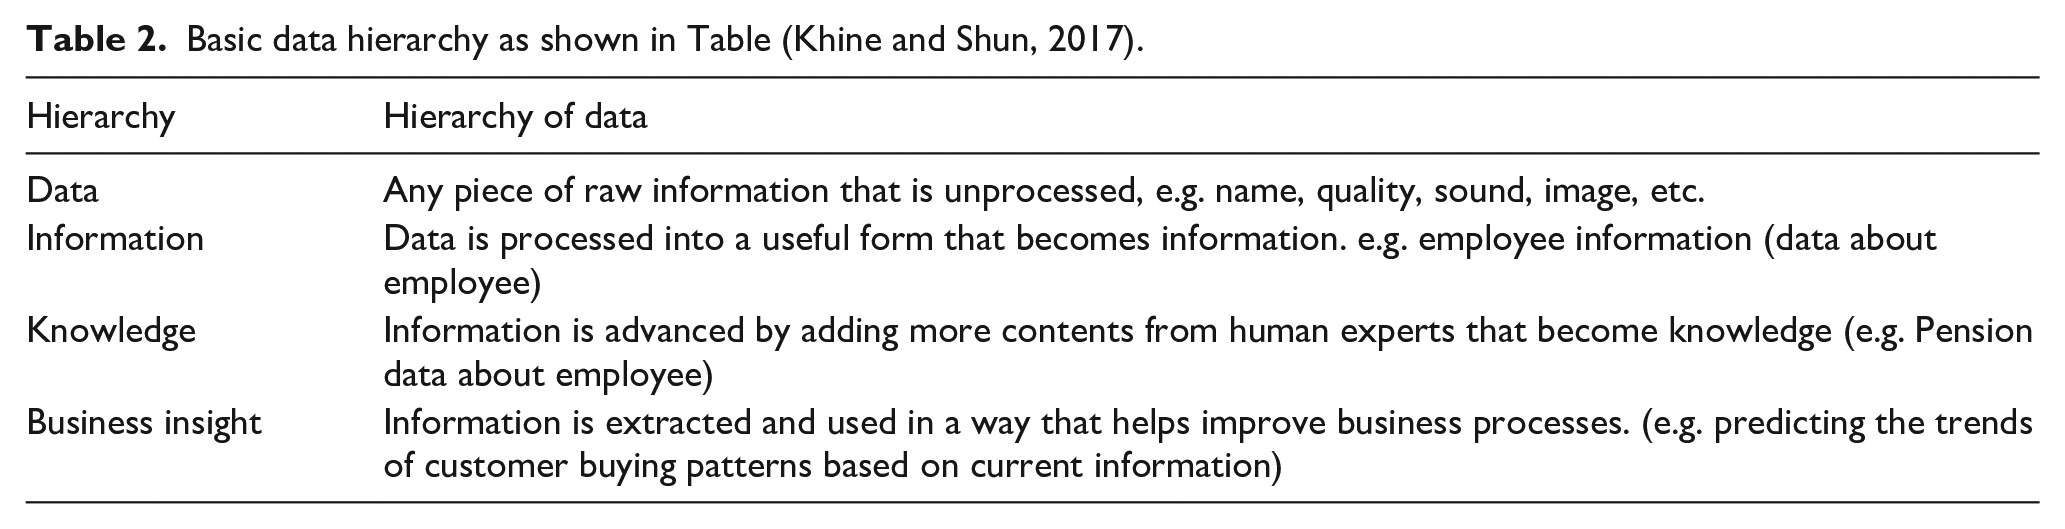
In the early 1990s, the terms ‘Business Intelligence’, ‘Business Analytics’, big data and their variations were coined to define a developing information technology that could take advantage of the growing amount of data, vast interconnectedness, and significant advancements in computing. According to Coronel (2017), data consists of raw facts. The word raw indicates that the facts still need to be processed to reveal their meaning. On the other hand, information is the result of processing raw data to display its meaning. Data processing can be as simple as organising data to show patterns or as complex as making predictions or drawing assumptions using statistical modelling. Information requires context to reveal meaning (Coronel, 2017). Coronel (2017) suggests knowledge means familiarity, awareness, and understanding of information as it applies to circumstances. Further, Coronel (2017) summarises some key points about data, information and decision-making:
• Data constitutes the building blocks of infor-mation.
• Information is produced by processing data.
• Information is used to reveal the meaning of data.
• Accurate, relevant, and timely information is the key to good decision-making.
• Good decision-making is the key to organisational survival in a global environment.
Organisations are generating significant volumes of data in various formats and at high speed than they used to. Such data is referred to as big data. This voluminous data can benefit organisations if better insights are drawn for management to improve decision-making. big data (BD) has been defined in various ways by different authors. According to Maheshwari et al. (2021), BD has five crucial V’s: Volume, Velocity, Variety, Veracity, and Value. They describe BD as huge in volume, high in velocity, diverse in variety, and requiring specific processing capabilities.
Garoufallou and Gaitanou (2021) defines BD as data that exceeds the processing capacity of conventional database systems, requiring alternative processing methods due to its size, speed, or structural complexity. According to Khine and Shun (2017), big data (BD) is characterised by its large volume, diverse data types, and varied sources, which are shaped by the specific needs and context of an organization. Additionally, BD is marked by its velocity requirements, which refer to the speed at which data is generated, processed, and analysed. Similarly, De Mauro et al. (2016), Wang et al. (2016) describe BD as information assets characterised by high volume, velocity, and variety, necessitating specific technology and analytical methods for value transformation. De Mauro et al. (2016) also emphasise that BD requires specific technology and analytical methods for its transformation into value, due to its high volume, velocity, and variety. Mayer-Schönberger and Cukier (2013) see BD as a phenomenon bringing three key shifts in information analysis: more data, messier data, and correlation overtaking causality. The National Institute of Standards and Technology (NIST; 2014) defines BD as extensive datasets with characteristics of volume, velocity, and/or variety, requiring scalable processing.
Difference between business intelligence, business analytics, and data analytics
The Difference between Business Intelligence, Business Analytics, and Data Analytics are included in this literature review to provide the reader with a comprehensive understanding of the various analytics concepts, how they are related, and how they apply to the study topic. Business Intelligence (BI), Business Analytics (BA), and Data Analytics (DA) are all terms used to describe the process of collecting, analysing, and using data to inform and improve decision-making. While all three concepts share some commonalities, they have distinct differences. Table 3 presents the concepts of business intelligence, business analytics, and data analytics and how they have been defined in the literature.
Views of business intelligence, business analytics, and data analytics.
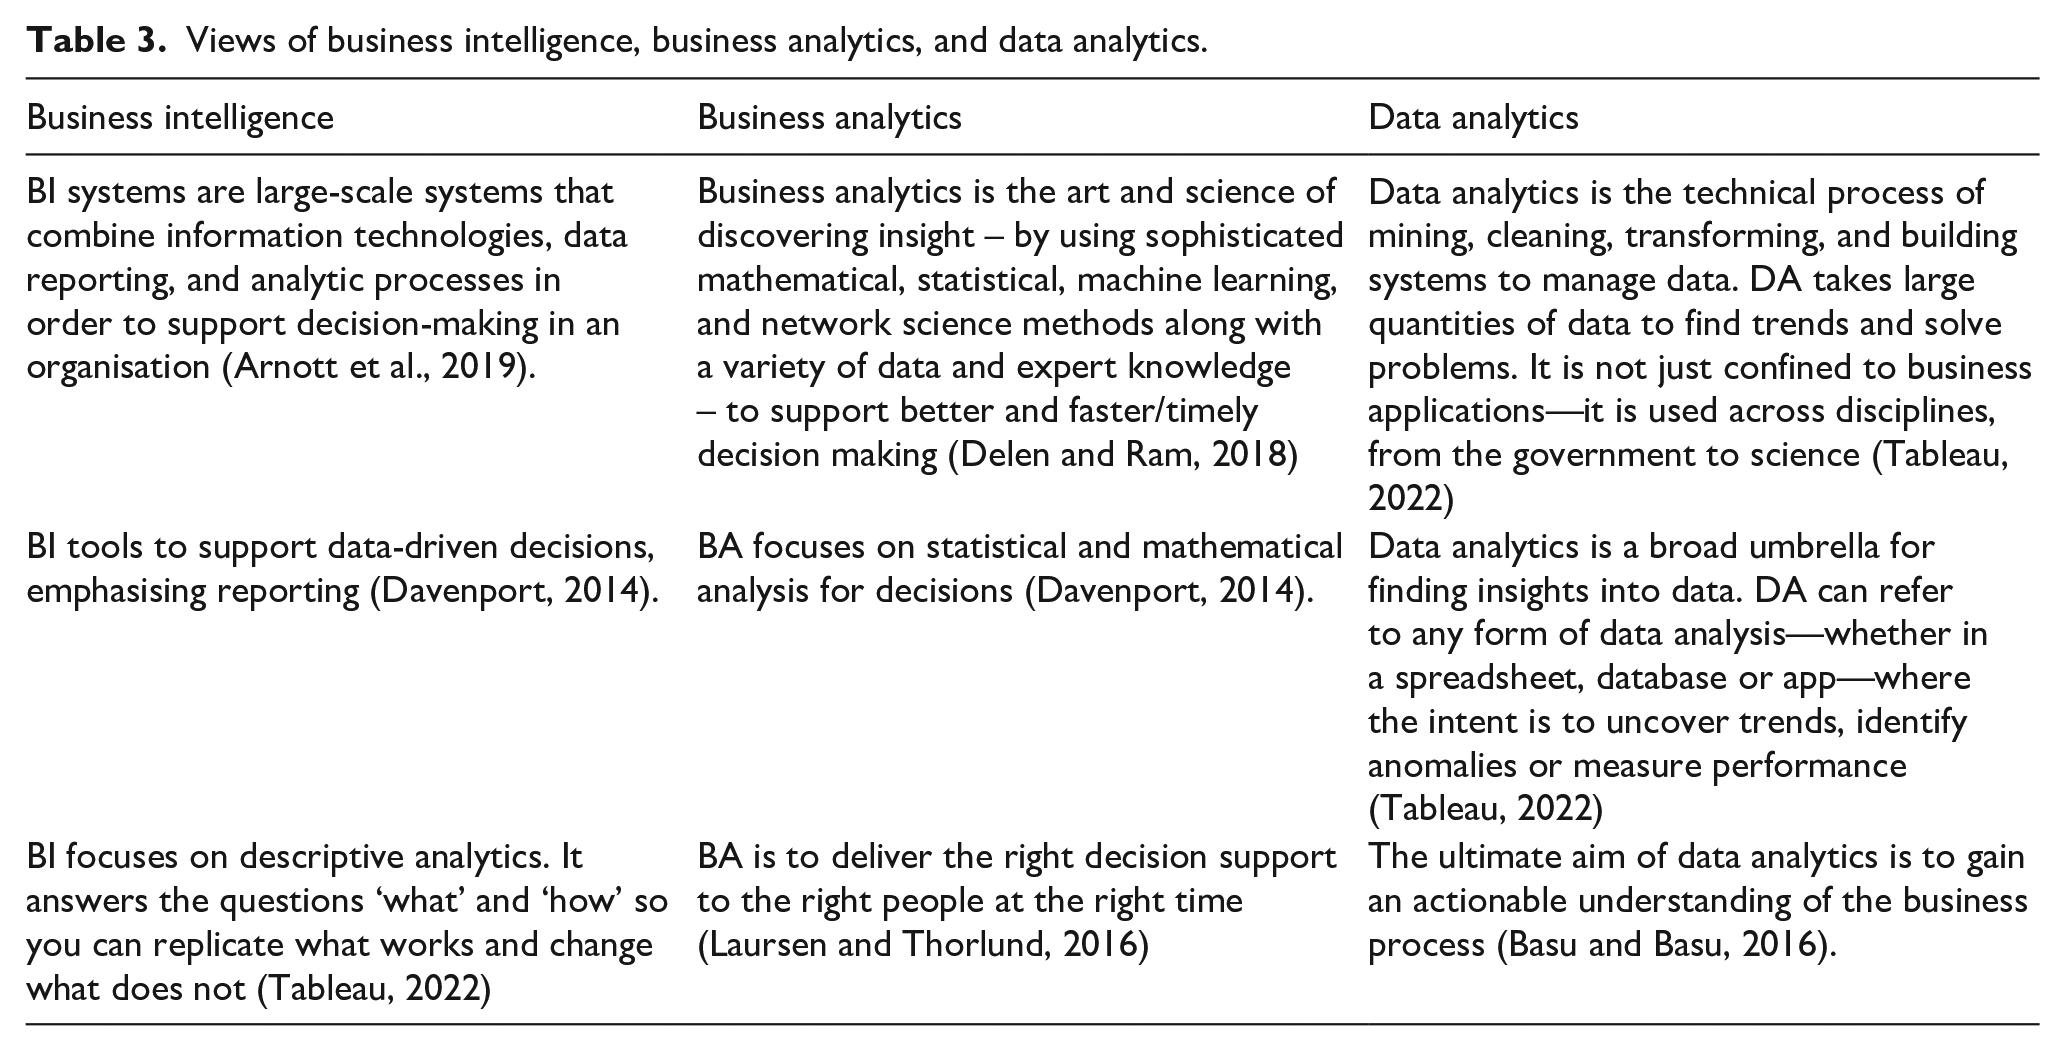
Notable features of BI and BA differentiate them from other organisation-level technologies and impact the construction of BI and BA competencies (Al-edenat and Alhawamdeh, 2022; Tableau, 2022; Velu, 2021). Business intelligence, business analytics, data analysis, and data analytics are often muddled and used loosely. Even though there is much overlap in the concepts, there are subtle differences (Velu, 2021).
According to Chandler et al. (2011) IT Glossary, ‘Business intelligence (BI) is an umbrella term that includes the applications, infrastructure and tools, and best practices that enable access to and analysis of information to improve and optimise decisions and performance.’ Similarly, a study Kimble and Milolidakis (2015) identified seven characteristics of Business intelligence which are: competitor intelligence, customer intelligence, market intelligence, product intelligence, strategic intelligence, technological intelligence and business counterintelligence. BI software is developed to understand the data and business needs more important than software training. (Kehal and El Alfy, 2021).
White (2021) stated three significant players (among many) in the analytics area. These are Tableau Desktop, Microsoft Power BI Desktop and Google’s Data Studio. While many different options exist, these three platforms highlight the capabilities of BI software to transform data into insight. Each is designed to work with data from nearly any source and to process data concentrated on various industry applications. Laursen and Thorlund (2016) weighted as analytics, or business analytics, is not only a technical solution but encompasses three elements: technological, human and business processes. By drawing on analytics and BI, Ramrathan and Sibanda (2014) have shown that BI facilitates connections in an organisation.
In contrast, real-time information is used to support analytics. This means analytics is a process of turning data into actions using advanced tools and techniques. Duan and Xiong (2015) also concludes that analytics is part of Business Intelligence (BI), which extensively uses analytical techniques. Several studies Laursen and Thorlund (2016), Ram et al. (2016), Xia and Gong (2014) also found that the BI could play an essential role in improving organisational performance by identifying new opportunities, highlighting possible threats, revealing new business insights and enhancing decision-making processes, among many other benefits.
In summary, we can define Business intelligence (BI) as a technological system that collects, stores, and processes data to combine descriptive information to support decision-making. On the other hand, Business analytics is a set of disciplines and technologies that use mathematical, statistical, machine learning and other quantitative methods focusing on predictive analytics to support better decision-making and indicate future outcomes. In contrast, Data analytics is a scientific method of mining, cleansing, transforming, and building methods to manage data, find trends and solve problems. DA refers to any data analysis intending to uncover trends, identify anomalies, or measure performance to achieve actionable business process knowledge.
A journey from data analysis to business intelligence and big data analytics
Several studies have revealed that today, data analytics is big business. Many commercial companies and government agencies are using these tools, along with AI and related capabilities, to improve production processes, understand their customers, target marketing, develop new drugs, and improve the effectiveness of their operations (Madry, 2019; Showers, 2015). Several studies such as Ayaz and Yanartaş (2020), Belotto (2018), Briney (2019), Hu et al. (2014), Khan et al. (2015), Madry (2019), (Bendre and Thool, 2016) have found that the analytics capability will significantly impact many things such as business operations, logistics, healthcare, governmental services, scientific research, crime prevention, disaster planning and response and more. A recent systematic literature review based on BDA studies, conducted by Sabharwal and Miah (2021), thematised the existing literature on BDA into five categories through a systematic analysis. Table 4 shows these BDA themes and summaries
BDA themes and summaries of existing literature (Sabharwal and Miah, 2021).
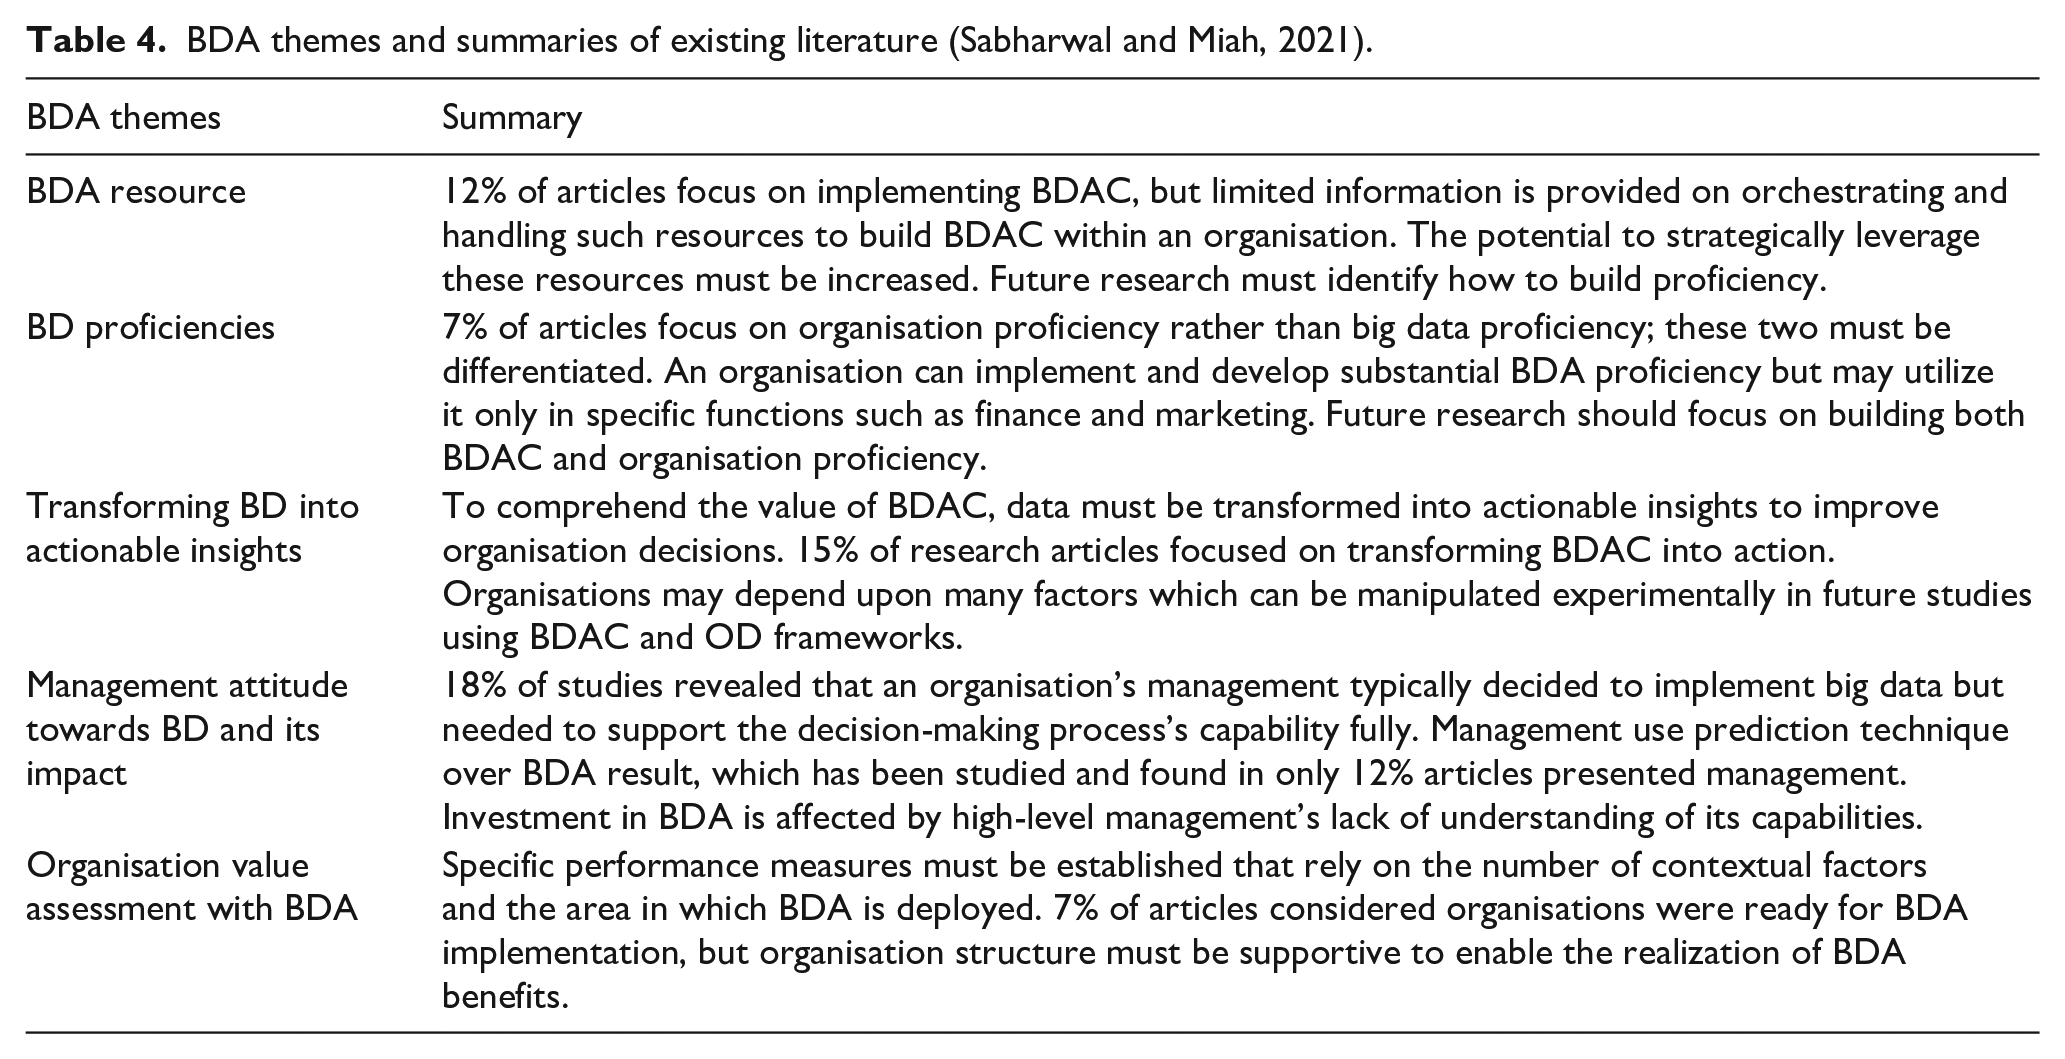
This systematic literature review has explained data analytics capabilities, including performance and resources limitation and organisational capabilities. One clear thing from this systematic literature review is that data must be transformed into actionable insights to improve decision-making. However, the organisation’s management decides to implement big data but does not fully support the capability of the decision-making process. A lack of knowledge of its capabilities by high-level management also impacts investment in BDA. This study presented the limitation examined in the theoretical model and identified organisational and individual levels as being influenced by organisational climate, culture, and capacity. This model can assist in understanding how BDA can improve organisational and individual performance. The study does not provide an in-depth analysis of the individual and organisational resources or offer new insights into the topics. The reviews suggested a further investigation to the potential limitations of analytics, such as organisational capability and the potential of analytics to enhance organisational performance.
The rise of analytics: Transforming data into actionable insights
Big data often uses analytics such as artificial intelligence (AI), machine learning (ML), and deep learning (DL; Al-Mekhlal and Khwaja, 2019). Nazir and Pinsonneault (2012) stated that predicting the future based on historical data or by determining patterns has become increasingly critical because handling present needs is identical to being late in today’s circumstances. In recent years, university libraries have started adopting data-driven approaches by data capturing and sharing with the university stakeholders to improve library services and to create future opportunities (Ashaari et al., 2020; Harper and Oltmann, 2017; Konchak et al., 2021; Showers, 2015). Besides, Zhan and Widén (2019), Segooa and Kalema (2018) noted that since librarians require knowledge management, the skills to maintain and utilise knowledge generated from big data analytics are also needed.
The power to better understand the movement of large amounts of data in a company and the capability to deploy that data to meet a customer’s needs is invaluable from a services standpoint (Litsey and Mauldin, 2018). Therefore, integrating the data of various systems and platforms is essential for enhancing and developing accurate decision-making systems. Showers (2015) found that analytics is a new tool that can be added to existing methods for better outcomes and services. Similarly, Agasisti and Bowers (2017) found that traditional data analyses are replacing more sophisticated analytics forms. As analytics becomes more pervasive, it is revolutionising how organisations collect, analyse, and apply insights, enabling them to drive growth, make strategic decisions, and measure success. By embracing analytics, businesses can optimise performance, boost efficiency, and unlock new opportunities for growth and improvement (Ashaari et al., 2020; Chandler et al., 2011; Konchak et al., 2021; Roy, 2024). According to Kaisler et al. (2013), however, the lack of direct experience with big data often leads to a limited understanding of both its opportunities and challenges. Addressing the unique characteristics of big data presents a range of ongoing issues that require careful consideration as the field advances. These challenges highlight the complexity of harnessing big data effectively to realize its full potential.
John McDonald, an industry and analytics expert, stated that ‘as an industry, libraries are fundamentally behind others in terms of the prevailing technologies that we use to support our institutions’. The existing literature on this field indicates that data analytics is essential for decision-making in any organisation (Monino, 2021; Pourshahid et al., 2014; Shi et al., 2015; Showers, 2015; Travis and Ramirez, 2020). Libraries are also implementing and utilising data analytics to make a decision. However, the central concern with this trend clearly shows that the library sector needs to be faster in accepting and practising data analytics Showers (2015), Tay (2016).
In contemporary organisations, analytics and information are increasingly essential to decision-making. Studies such as Rysavy and Michalak (2019), Stieglitz et al. (2018) found SM and social IoT data are the critical drivers for companies developing and operating these decision-making systems; However, Salim et al. (2022) highlight that data privacy remains a critical concern in these spaces. Ramrathan and Sibanda (2014) mentioned that analytics and BI had emphasised using analytical tools in decision-making. All these studies are limited by the need for more information on professionals’ attitudes toward analytics adoption.
Evidence-based practice for librarianship decision-making has become popular over the last few decades. Many models have been used in library sectors for a long time. Showers (2015) found that analytics is a new tool that can be added to existing methods for better outcomes and services.
Analytics can create insight and value for everyday activities in the Library. For example, Doty (2020), Jones and Salo (2017), Paul and Erdelez (2013) in their research studies, the authors found that participants identified the use of analytics as evidence in making important decisions.
These studies indicated that library professionals are now turning to evidence for decision-making, and the use of analytics support them.
Analytics and demonstrate values of university libraries
A growing consensus among scholars, including Chaurasia and Frieda Rosin (2017), Connaway et al. (2017), Garoufallou and Gaitanou (2021), Murray (2013), Showers (2014), and Wang (2015), emphasises the need for libraries to redefine their success metrics and demonstrate their value in alignment with the broader community’s objectives. The rising interest in library analytics reflects this shift, as libraries seek to showcase their impact and success. Historically, library data collection has focused on internal metrics such as material holdings, expenditures, staffing, and service activities (Rysavy and Michalak, 2019; Showers, 2015). However, Murray's (2013) study revealed that traditional library metrics and customer satisfaction surveys are insufficient to measure a library’s true value, highlighting the need for more comprehensive assessment methods.
Similarly, a study on data analytics and decision-making in the education sector conducted by Agasisti and Bowers (2017) explored how traditional data analyses are becoming substituted by more sophisticated forms of analytics. This study also provided a category for these recent movements (in particular, learning analytics, academic analytics and educational data mining). Their study indicates that the traditional library metrics have no value to library administrators without context for a library’s purposes. Furthermore, Kew and Tasir (2022) note that the application of learning analytics in online learning environments has been steadily increasing in educational research. This growth is attributed to its ability to provide standardised and measurable insights that support decision-making processes aimed at enhancing student success. The study did not explore the possible implications of data analytics and decision-making from the librarianship perspective. However, Student attitudes toward learning analytics in higher education have been explored, with some likening it to “the Fitbit version of the learning world” (Roberts et al., 2016), but data privacy remains a concern in these spaces.
A study by Chen et al. (2015) found that data was often compiled into library statistics and considered a way to assess a library’s resources and performance. The study saw that analysis was used to improve service delivery and justify the service to funding bodies – in the case of a university library, to justify the university’s expenditure on the library, its collections, resources, and staff. Library and university analysis systems now provide broader and richer data to support decision-making and service justification. However, further study is needed to understand better the impact of analytics and its community acceptance behaviour (Roy, 2021; Roy et al., 2018).
A report by the Association of College and Research Libraries (ACRL) and Online Computer Library Centre (OCLC; Connaway et al., 2017) validates and confirms that the academic library has an essential role in student success. This report recommended that academic stakeholders use analytics effectively for better student success. Libraries can connect their data with student outcomes to demonstrate the impact of library resources and programs on student learning and success (Connaway et al., 2017). Another study by Eclevia et al. (2019) found an increasing demand for data librarian positions in many libraries worldwide. Similarly, Showers (2015) and Tella and Kadri (2021) stated that libraries are expected to play an increasingly important role in extensive data analysis and information utilisation. Additionally, there has been an increasing interest in library analytics that can show the libraries’ value in recent years. Studies such as Garoufallou and Gaitanou (2021) and Tella and Kadri (2021) found that library decisions will be entirely evidence-based, and by virtue, libraries can progressively improve service. The library has a significant role in using analytics by collecting and analysing their user benefits (Garoufallou and Gaitanou, 2021; Sparks et al., 2016). Despite the valuable insights provided by these studies, a notable gap remains in identifying the current challenges, specific strategies, and financial investments required to support the implementation of analytics in university libraries. Furthermore, recommendations for effective analytics adoption and integration are lacking, hindering libraries’ ability to fully leverage analytics and maximise their impact.
In 2016, a long 5-year research on data and analytics was conducted with a collaboration between MGI and McKinsey Analytics and identified six archetypes for data and analytics–enabled disruption (Analytics, 2016). The research also noted that domains that could be disrupted include Insurance, Health care, Human capital/talent, Transportation and logistics, Automotive, Smart cities and infrastructure, Retail, Media, Education, Banking, the Public sector, and Technology and Material sciences.
The research aim was to help organisational leaders comprehend the possible impact of data and analytics, clarifying what the technology can do and the opportunities at stake. This study examines the significance of analytics in the rise of big data within university libraries. The industry’s attitude towards the adoption of analytics may be a factor. However, this study fails to mention what factors can play roles in accepting analytics for those industries.
Studies suggest university libraries face productivity and would need to assess success to show the value added to the university’s overall business (Gunapala, 2017; Showers, 2015). However, Ramrathan and Sibanda (2014) in their study has shown that, despite the prominent growth in the use of analytics within the organisation, its application still needs to be fully understood. Previous studies indicate that analytics improve decision-making and demonstrate success. University libraries are the centre of a scholarly environment transformed by data, and data-driven practices are increasing daily. However, most of these studies focused on something other than the library culture and professionals’ acceptance of analytics adoption. Therefore, this review advocates for further research to investigate the potential barriers to analytics adoption, including organisational readiness and the potential impact on organisational performance.
Application of data analytics and librarianship practices
Academic libraries have a long history of collecting data and reporting their analyses Adey and Eastman-Mullins (2017), Faulkner (1988), Garoufallou and Gaitanou (2021), Jones et al. (2020), Rysavy and Michalak (2019). Farney and McHale (2013), Kantanantha and Awichanirost (2022) found Google Analytics is a widely utilised, free web analytics tool that gathers and analyses the number of visitors, unique users, page views, and many other aspects that reports website traffic data. Its price tag and robust mechanism that shows a broad scope of reports and features make it a desirable choice for libraries to adopt for a long time.
Farney and McHale (2013) noted that although Google Analytics is a powerful web analytics tool, it has some limitations. For example, Google Analytics is designed to be a hosted service. The data gathered from website visitors will be captured and kept on a Google server, not the institution’s own. As a result, it generates legitimate concerns about who controls that data. For instance, once Google Analytics starts tracking data, libraries have no authority to remove that data other than by deleting the complete profile. Besides, Google Analytics is not designed to be an infinite repository for a website’s data.
Similarly, a study by Hamad et al. (2021) on Business intelligence in academic libraries and the opportunities and challenges conducted in Jordan has shown that the library staff agree that business intelligence improves decision-making, helping decision-makers make the most accurate and timely decisions for the Library. The study findings indicate a need for more awareness of business intelligence among library staff in the Jordanian academic libraries. The study also found that appropriate infrastructure is necessary to implement business intelligence in academic libraries in Jordan.
According to other study by Hamad et al. (2023), libraries face several challenges in their efforts to implement smart technologies and services, with resistance to change emerging as a primary obstacle. Privacy and confidentiality concerns are also significant, alongside financial constraints such as inadequate infrastructure and insufficient staff training. However, this study did not indicate why library staff lack awareness of business intelligence and their behavioural intention to adopt BI tools.
Data literacy and cultures in libraries
Studies by Eclevia et al. (2019), Robinson and Bawden (2017) and Zhan and Widén (2018) reveal a significant knowledge gap among librarians, highlighting inadequate understanding and practical utilisation of big data analytics.
In 2017, Robinson and Bawden (2017) published a paper describing librarians’ need to re-skill and change their self-identification and the philosophy that underlies it if they achieve confident data fluency. A study on Data-driven decision-making in the Library by Massis (2016) has found that there is an expectation by stakeholders that libraries can generate reports and decisions based on aggregated data for on-demand reporting. Thus, capturing, interpreting, and reporting data-based decisions is essential in today’s libraries. The research on data literacy and cultures in libraries has focused on the importance of analytics and challenges rather than a practical framework for analytics to support librarianship practices.
To become a data-aware organisation, a study conducted by Rose (2017) established a model to support the routine use of quantitative data for decision-making in access services based on Tableau’s interface. This study discusses a strategic initiative at NYU libraries to support data-driven decision-making by establishing a robust data warehouse paired with front-end access for library staff via Tableau Desktop.
Similarly, Silva and Migu’eis (2017), Farmer and Safer (2016) remarked that combining data analytics with layout improvement heuristics improves library service quality. This study proposes a prescriptive analytics solution to enhance library service by optimising libraries’ layouts.
With the rising importance of analytics as a tool for librarianship practices in decision solution, the factors influencing librarians to use analytics for librarianship practices requires more investigation. This study, therefore, explored the practical implications of how libraries can exploit these systems for increased service analysis and decision-making.
Evidence-based/data driven decision-making in librarianship
A considerable amount of literature has been published on decision-making. This study is based on decision-making in librarianship and librarians’ behavioural intention for analytics application in their decision-making process. According to Nagle (2014) decisions can be divided into three groups, depending on the degree to which they take place. These are strategic decisions, tactical decisions and operational decisions. Strategic decisions are set decisions of an organisation. Tactical decisions are decisions about how things are going to get done.
Moreover, finally, organisational decisions refer to decisions to run the organisation on a day-to-day basis (Nagle, 2014). A successful decision is logically compatible with our knowledge state and integrates the possible alternatives with our risk attitude with their associated probabilities and potential outcomes (Charlesworth, 2017). Several studies have revealed that analytics feature becomes more universal and affects information use, analysis and implementation of decision-making tools. For example, a study conducted by Rysavy and Michalak (2019) has found how libraries around the world have used Personally Identifiable Information (PII) to make informed decisions about authentication) and research assistance (virtual reference). In addition, this study discusses the use of learning analytics in library environments, including the benefits and concerns associated with its use hours (gate count), electronic resources (collection usage and authentication), and research assistance (virtual reference; Rysavy and Michalak, 2019).
Methodology
To fulfill study objectives, researcher utilised systematic literature review methodology, a comprehensive structured approach. This methodology gathers, evaluates, and synthesises topical research from diverse databases, journals and sources.
Systematic searches identify relevant studies, followed by meticulous evaluations of quality and relevance based on predefined criteria. Study findings are synthesised, analysed and compiled into a theme-based knowledge overview.
Literature search
This study employs a systematic literature review methodology to address a precisely formulated research question, adhering to established protocols (Dewey and Drahota, 2016). This SLR methodology ensures a thorough, unbiased examination of existing research, providing reliable evidence for informed conclusions. This study utilised three premier electronic databases - Web of Science Core Collection, Scopus and Google Scholar - accessible via university subscription. Systematic literature exploration ensured comprehensive coverage. This systematic review adopts a global scope, considering diverse geographical perspectives to provide a comprehensive understanding of data analytics applications in university libraries worldwide.
Web of science (WoS)
To maximise study retrieval, strategic search approaches were employed on WOS document search. Search terms – business intelligence OR business analytics OR data analytics OR big data – and were combined using search term university libraries within search boxes and drop-down menus. This nuanced technique targeted articles containing specified concepts or related ideas.
The researcher explored research articles examining data analytics’ impact on university libraries. Advanced search options and filters retrieved seminal studies aligned with study objectives. Search limiters ensured precise results.
Initial searches in Web of Science Core Collection yielded 12,819 manuscripts. To enhance relevance, the researcher meticulously refined search parameters, excluding unrelated disciplines such as fisheries, religion, remote sensing, medical informatics and engineering.
The targeted refinement, illustrated in Figure 2, focused specifically on the fields of Information Science and Library Science and related field, producing 128 relevant documents retrieved from Web of Science (WoS). This precise filtering ensured the dataset aligned closely with the study objectives.
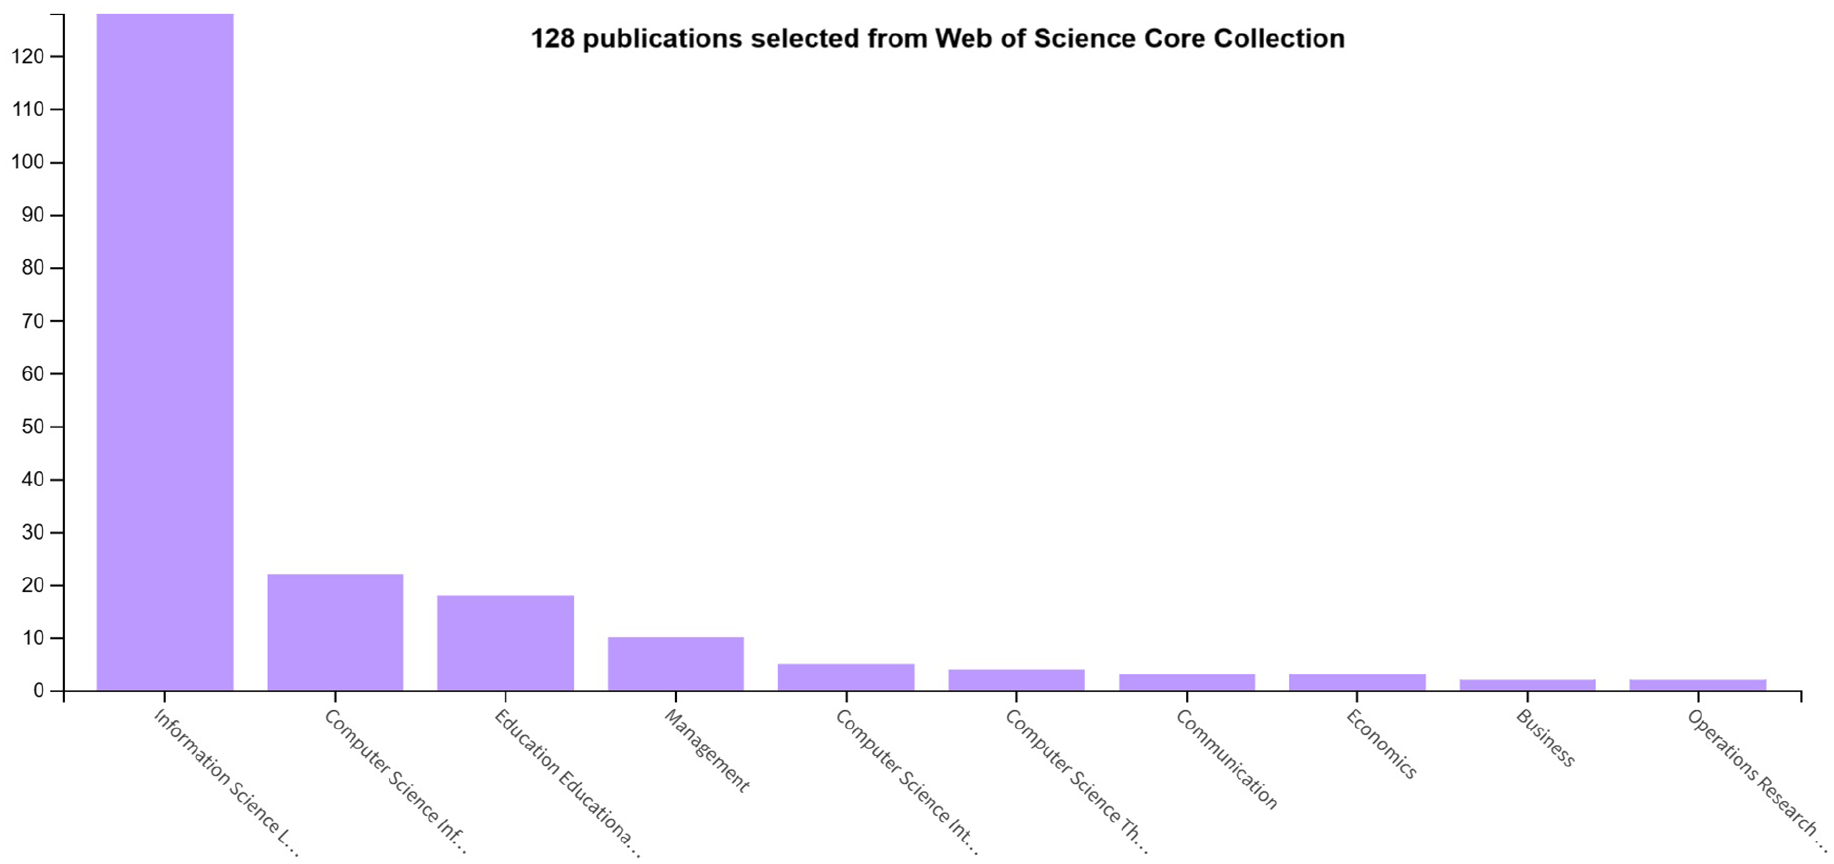
128 publications selected from web of science core collection.
Scopus
To ensure comprehensive coverage, the researcher replicated the systematic search approach in Scopus. This mirrored methodology guaranteed consistency across databases.
The Scopus search employed precise search terms: business intelligence OR business analytics OR data analytics OR big data analytics, combined with ‘university libraries’. This strategic combination retrieved articles addressing data analytics applications within academic libraries. Article search options facilitated targeted retrieval. Scopus searches produced 236 relevant studies, contributing significantly to the research on data analytics in university library contexts. The search results encompass a 37-year period, spanning 1987 to 2024, providing a comprehensive retrospective analysis. The dataset encompasses journal articles, book chapters, conference proceedings, forthcoming articles, and data papers, note, book reviews. The researcher meticulously selected relevant documents, ensuring alignment with study objectives. Figure 3 presents the Scopus search results categorised by document type, providing a detailed breakdown of the types of publications included in the dataset. Figure 4 illustrates the Scopus search results distributed by year, highlighting the publication trends over time within the dataset.
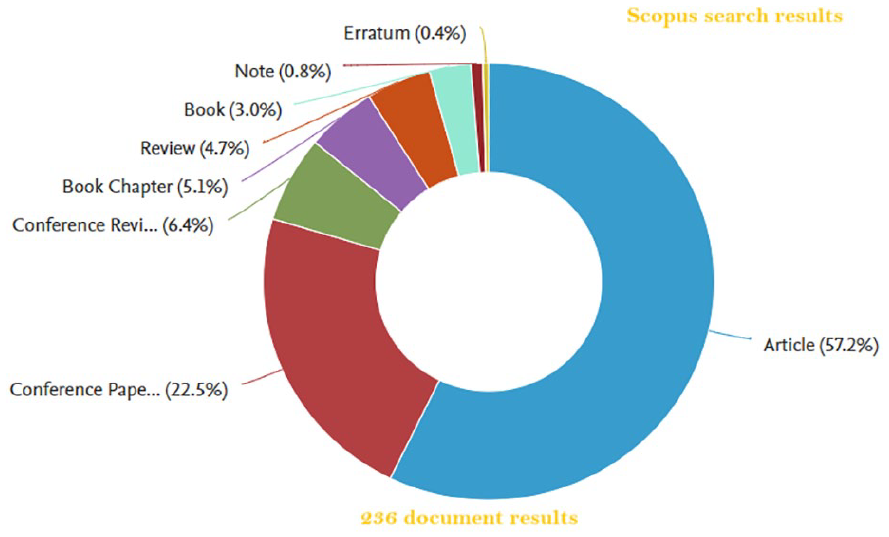
Scopus search results by document type.
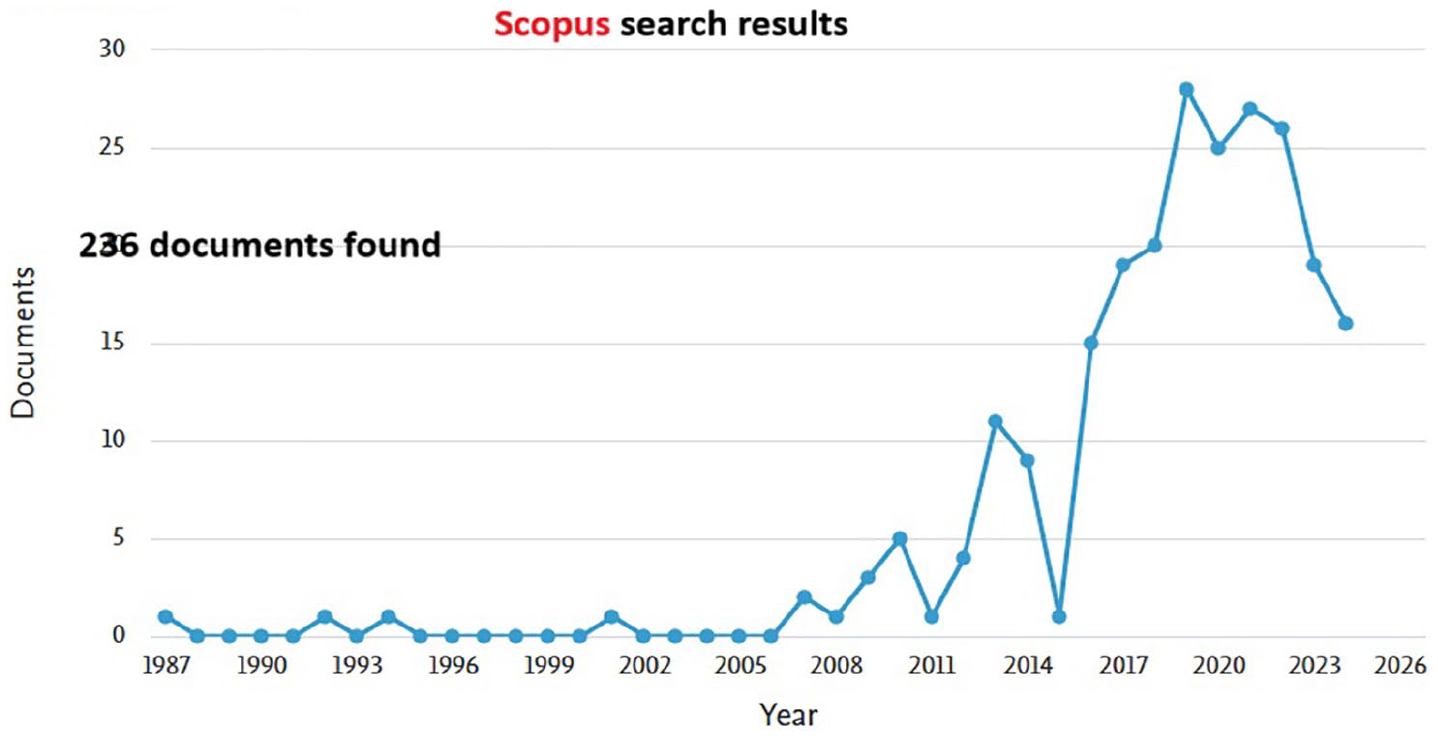
Scopus search results.
Google scholar
To enhance database search comprehensiveness, Google Scholar’s Advanced Search feature was leveraged. This robust tool provides eight adaptable search options, organized into three categories, allowing tailored query combinations.
The Advanced Scholar Search menu offers precise search term control through four specialized search bars, refining results.
Google Scholar was utilised to capture the latest publications and benchmark results against Web of Science and Scopus. Notably, most retrieved documents were previously indexed in Web of Science and Scopus, validating the databases’ extensive coverage.
A meticulous two-step screening process ensured the identification of relevant studies.
Initially, database records were exported as CSV files including the abstract to facilitate efficient data filtering. The researcher meticulously scrutinised abstracts, retaining those demonstrating clear relevance while systematically eliminating non-essential content.
Subsequently, a targeted search of the university library catalogue by title precision-located specific articles. Each identified article was then downloaded for comprehensive, in-depth review. This full-text analysis verified studies met predefined inclusion criteria, guaranteeing accuracy and relevance.
This dual-step methodology optimised the literature search, ensuring precision, efficiency and reliability. Transparent search parameters and filtering criteria enable replication and verification.
Inclusion and exclusion criteria
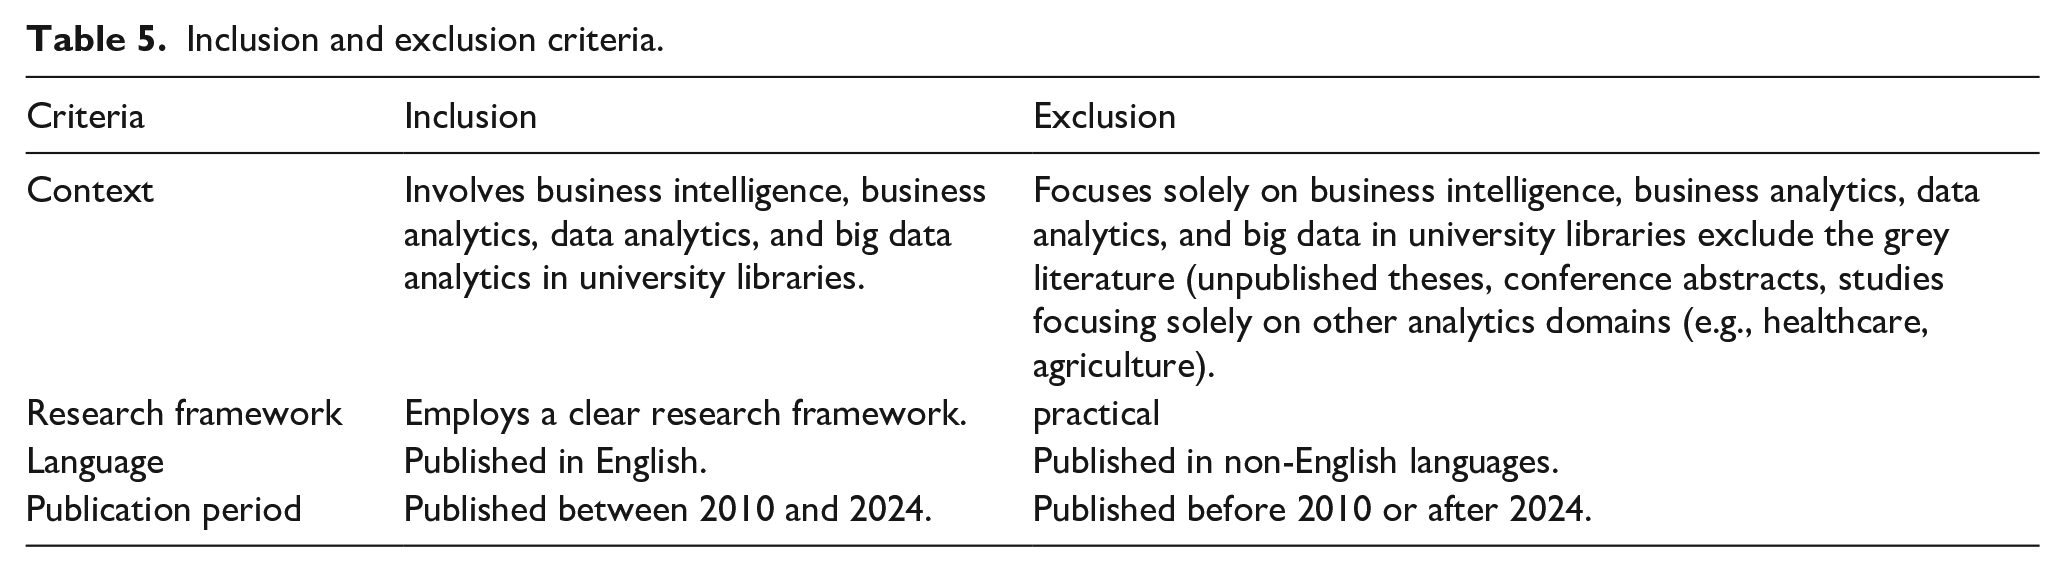
The methodology for this review includes specific inclusion and exclusion criteria to ensure a focused and relevant selection of studies related to the application of analytics in higher education libraries. The following Table 5 provides the inclusion and exclusion criteria used to guide the selection of studies for this review, ensuring a focused analysis of analytics applications in higher education libraries.
Inclusion and exclusion criteria.
Search strategy timeline
To ensure comprehensiveness and currency, two systematic searches were conducted.
The initial search took place in June 2021. A follow-up search, replicating the original criteria, was executed on October 24, 2024. This dual-phase approach verified consistency of results and incorporated recent literature updates.
By maintaining identical search parameters across both queries, the study guaranteed methodological consistency, enhancing reliability and validity of findings.
Results
This systematic literature review explains the transformative impact of analytics across industries and academia. Analytics, a dynamic field leveraging math, statistics, and machine learning, uncovers meaningful patterns in data (Basu and Basu, 2016; SAP, 2022). It encompasses descriptive, predictive, and prescriptive phases for informed decision-making.
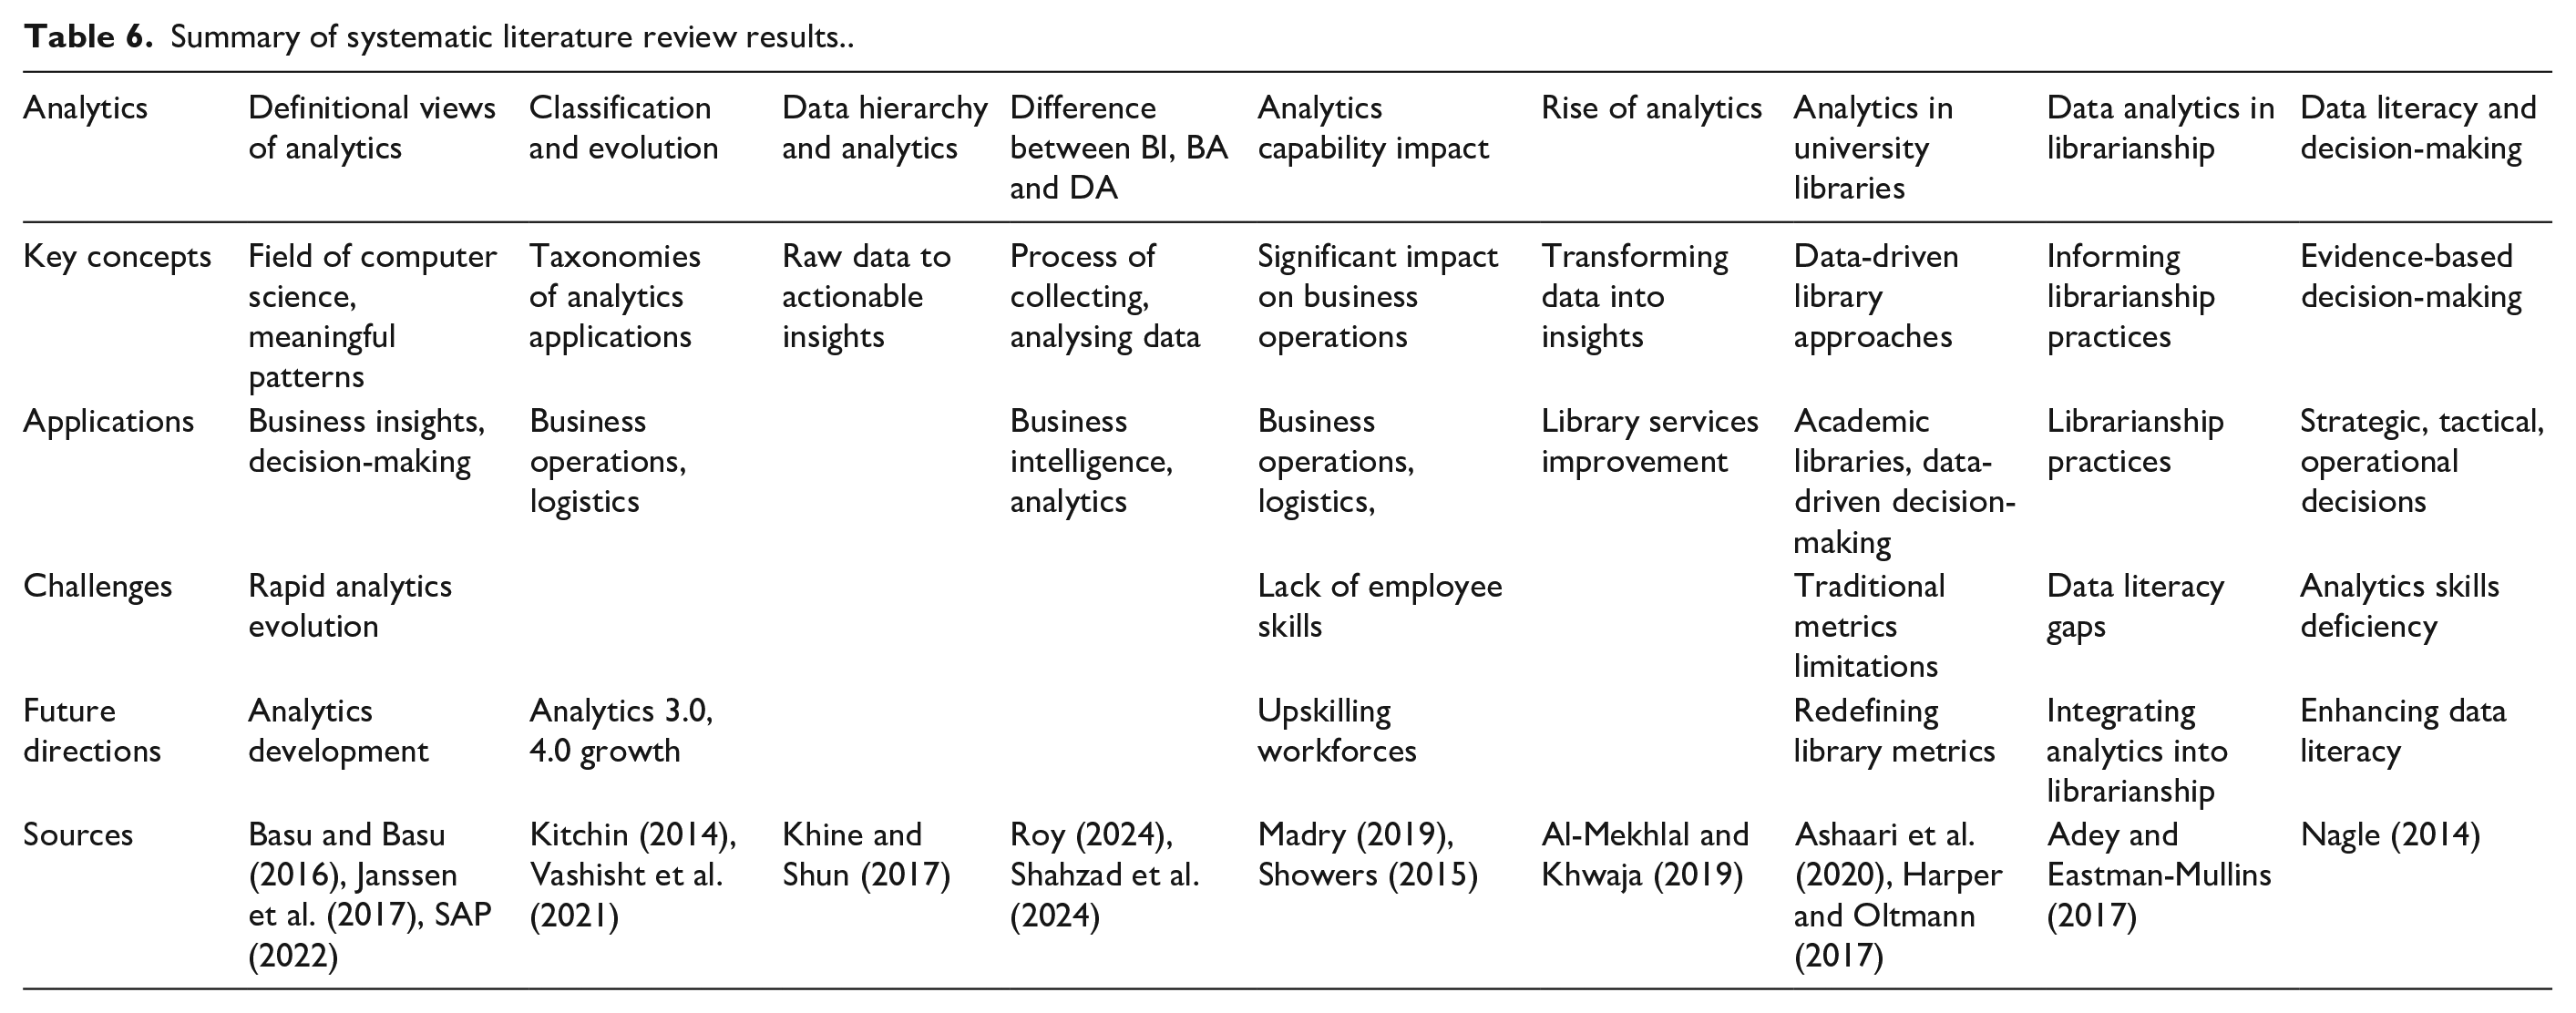
Various analytics applications include descriptive, predictive, prescriptive, and cognitive analytics for decision-making (Vashisht et al., 2021). The review confirms that data analytics significantly impacts business operations. Big data analytics harnesses the power of artificial intelligence, machine learning and deep learning to unlock transformative insights. University libraries adopt data-driven approaches for improvement. Libraries redefine success metrics, demonstrating value through analytics. University libraries leverage data analytics for informed decision-making. Google Analytics analyses website traffic. Decision-making involves strategic, tactical, and operational decisions. Analytics informs decision-making processes. Libraries use analytics for authentication and research assistance. However, the reviews finds that data literacy gaps hinder data-driven decision-making for university libraries. Table 6 provide a comprehensive summary of the systematic literature review results, offering key insights and an overview of the analysed studies.
Summary of systematic literature review results..
Discussion
The relevance of big data to libraries is widely acknowledged (Garoufallou and Gaitanou, 2021; Tella and Kadri, 2021). However, harnessing its potential is not without challenges. Showers (2014) highlights the complexities of identifying, collecting, and analysing data to inform service development and demonstrate impact. Similarly, John McDonald notes the difficulties in collecting and cleaning data from diverse software platforms and information services. The absence of a robust data analytics culture in libraries, coupled with limited staff skills in data analysis and visualisation, exacerbates these challenges.
Furthermore, the sophistication of learning analytics systems in the era of big data, artificial intelligence, and cloud services poses additional complexities (Konchak et al., 2021; Lytras et al., 2018). Researchers advocate for the development of a more robust professional role for data scientists in education to support data-driven decision-making (Agasisti and Bowers, 2017; Hernández-Leo et al., 2019), a sentiment equally applicable to libraries. Studies reveal that libraries face significant challenges in using analytics for decision-making, with nearly 60% struggling to leverage analytics effectively (Ramrathan and Sibanda, 2014). Garoufallou and Gaitanou's (2021) systematic literature review underscores the vast and complex nature of data generated in academic libraries, highlighting the need for more nuanced insights into the implications of these challenges. Ethical, political, and social concerns surrounding user data analysis also pose significant challenges (Ahmad et al., 2019; Deho et al., 2022; Jantti, 2016; Kitchin, 2014). Nevertheless, libraries are increasingly recognising the strategic importance of analytics in enhancing existing services and demonstrating their value and impact (Showers, 2014).
Summary of systematic literature review results
Research suggests that analytics can be a powerful tool for constructing librarianship practice, strategies, and frameworks (McDonald, 2017; Paul and Erdelez, 2013; Showers, 2014; Stubbing, 2022). While some studies have explored analytics in academic libraries, few have investigated university libraries’ data frameworks. Mani et al.'s (2021) investigation into developing a comprehensive data science framework for university libraries offers valuable insights, highlighting the need for further research in this area.
Limitations and future research directions
Effectively harness the transformative potential of big data analytics, future research must prioritise investigating and addressing the significant gaps in librarians’ comprehension and practical application.
This study’s findings are subject to several limitations, presenting opportunities for future research:
The current research did not extensively investigate challenges libraries face leveraging analytics for informed decision-making, particularly regarding data collection, analysis and visualisation hurdles.
Further exploration is warranted on ethical, political, and social implications surrounding user data analysis in libraries, ensuring responsible and transparent practices. Data framework development in university libraries and cross-departmental applications require deeper investigation. The evolving role of data scientists within libraries demands examination, emphasising professional development for robust data-driven decision-making support. An in-depth analysis of the technology acceptance theories among library professionals would provide valuable insights into perceptions, attitudes and intentions regarding business data analytics and business intelligence adoption.
Additional areas for future research include:
• Investigating analytics’ impact on library services and student success metrics.
• Developing targeted strategies for enhancing librarians’ data literacy and analytics skills.
• Examining cross-industry applications of library analytics innovations.
By addressing these limitations and exploring new avenues, future studies can comprehensively illuminate analytics’ transformative potential within university libraries.
Conclusion
This literature review marks a pivotal milestone in understanding data analytics, business analytics and business intelligence within university librarianship. It provides the first exhaustive exploration of these organised concepts, empowering library professionals with clarity and confidence to navigate complex data landscapes and inform data-driven decision-making.
Despite data analytics’ growing importance in university libraries, research in this context remains scarce. This review addresses this gap by investigating key aspects and providing comprehensive insights for effective navigation and informed decision-making. A systematic database search revealed significant knowledge gaps in understanding obstacles hindering data analytics’ effective application and the absence of comprehensive guidance for harnessing its potential. This review contributes to existing literature by identifying research gaps, providing a foundation for further investigation into analytics adoption in university libraries and extending current knowledge by addressing previously unexplored areas. In conclusion, this study highlights the need for further investigation into the factors driving librarians in higher education to adopt analytics, emphasising the potential of these systems to enhance service analysis and support data-driven decision-making in the sector. Ultimately, this influential work enhances librarians’ data literacy, informs evidence-based decision-making, and fosters innovative library services, paving the way for future research and exploration into analytics-driven excellence in academic librarianship.
Footnotes
Declaration of conflicting interests
The author declared no potential conflicts of interest with respect to the research, authorship, and/or publication of this article.
Funding
The author received no financial support for the research, authorship, and/or publication of this article.