
Abstract
Presentation of data is a major component to academic research. However, programming languages, computational tools, and methods for exploring and analyzing data can be time consuming and frustrating to learn and finding help with these stages of the broader research process can be daunting. In this work, we highlight the impacts that computational research support programs housed in library contexts can have for fulfilling gaps in student, staff, and faculty research needs. The archival history of one such organization, Software and Services for Data Science (SSDS) in the Stanford University Cecil H. Green Library, is used to outline challenges faced by social sciences and humanities researchers from the 1980s to the present day. To compliment this history, participation metrics from consulting services (1999–2021) and workshops (2000–2021) are presented along with updated workshop participant feedback forms (n = 99) and further illustrate the profound impacts that these services can have for helping researchers succeed. Consulting and workshop metrics indicate that SSDS has supported at least 27,031 researchers between 1999 and 2021 (average of more than 1175 per year). A t-test on the feedback form data indicates that participant knowledge in workshops statistically significantly increased more than one scale point from workshop start to completion. Results also indicate that despite our successes, many past challenges continue to present barriers regardless of exponential advances in computing, teaching, and learning—specifically around learning to access data and learning the software and tools to use it. We hope that our story helps other institutions understand how indispensable computational research support is within the library.
Introduction
University Libraries’ role is to support the scholarship of its research community through diverse acts of librarianship that help make resources available for study. This support exists for virtually all fields, their histories and literatures, main theoretical tenets, and data sources. A major avenue for researchers to contribute to legitimate, peer-reviewed bodies of knowledge is through data exploration, visualization, and analysis for sampling, description, inference, or prediction of a specific piece of data, topic, or issue. However, this stage of the research process is challenging because of the computational, technical, and methodological barriers it presents. Specifically, a researcher must learn computer and software skills to acquire, curate, wrangle, visualize, analyze, secure, and present data.
Formal data analysis tutoring was traditionally associated with departments of computer science, engineering, and statistics to support the inherent technical needs of those disciplines. Computer software for data analysis has not always been taught in “non-technical” academic disciplines and departments and is challenging to learn on one’s own. This is especially true for social scientists and humanists, who pose wide-ranging and highly specific questions for projects that frequently require data and statistical components. For example, Kenny’s (1982) pioneering work The Computation of Style introduced the statistical landscape for studying literature, humanities, and social sciences in the Information Age long before modern challenges posed by rapid technological advancements and (generally speaking) greater access to using computers (Boyd and Crawford, 2012; Castells, 1996; Davidson, 2010; Grimmer, 2015; Hanania, 2018; Rahm and Do, 2000; Varghese and Buyya, 2018).
Thus, many individual and departmental needs around data, computing, and software support catalyzed the creation of technical and interdisciplinary training teams. One of the earliest groups was the Carpentries (2022; https://carpentries.org/). Software Carpentry began in 1998 (followed by Data and Library Carpentries tracks) and consists of software and data science training for researchers that is now found in sessions all over the world, usually through university collaborations—including at the Stanford University Terman Engineering Library. The Carpentries have been crucial for developing pedagogical ideas and protocol-based approaches for community and inclusion, curriculum development, feedback, and teacher training that have been instrumental for the creation of other foundational initiatives such as the Raspberry Pi Foundation’s Teaching Programming in Schools (Waite and Sentance, 2021; https://www.raspberrypi.org/app/uploads/2021/11/Teaching-programming-in-schools-pedagogy-review-Raspberry-Pi-Foundation.pdf).These high-watermark institutions both inform and are informed by the profound challenges for empowering novice coders in their computational research pursuits (Black, 2006; Bubica and Boljat, 2014; de Raadt, 2008; Eckerdal, 2009; Eisner, 2003; Heintz et al., 2015; Horton, 2015; Iqbal Malik et al., 2021; Karvelas, 2019; Kross and Guo, 2019; Loksa et al., 2020; Nederbragt et al., 2020; Prather et al., 2018; Robins, 2019; Shi et al., 2018; Soloway, 1986; Vihavainen et al., 2011; von Vacano et al., 2020).
In academic settings, computational research support units might exist campus-wide, or other times to serve specific departments. Staff members sometimes liaise with their home departments to teach modularized lessons within formal course curricula. These groups are often successful because they purposefully seek to remove barriers at the intersection of researcher identity, subject knowledge, and technical skills in relaxed settings where learners receive hands-on training and can ask questions to learn in more individualized ways. While issues around computational education have long been known (Joni and Soloway, 1986), Dale’s (2002) unsettling—and impressively concise—summation of issues facing computer science education research highlighted depthless further concerns of planning, organization, administration, advertising and community, publication, and continuity maintenance. These concerns apply to computational research support units in libraries as well, specifically around changing technologies for data access and storage, compute power, and familiarity with computational software, methods, and statistics. Other issues such as staff turnover, funding, and training further complicate organizational coherence, collaboration with other library and campus units, and complicate internal measurement instrument construction and data collection – necessary tools to improve planning, prototyping, and evaluation of teaching, consulting, and data-related services.
Unsurprisingly, university libraries and associated collections and data repositories have long been instrumental hubs for collaborating with and training researchers for working with data of all types in preparation for careers in academia and industry. The Inter-University Consortium for Political and Social Research (ICPSR, founded 1962; https://www.icpsr.umich.edu) and the United Kingdom Data Service (founded 1967; https://ukdataservice.ac.uk/) have been the gold standards for social science/behavioral archives. In the United States of America, Princeton University Library’s Data and Statistical Services (https://library.princeton.edu/dss) and initiatives at the University of California, San Diego Library (https://library.ucsd.edu/) and the Yale StatLab (https://marx.library.yale.edu/data-gis-statlab/statlab) have long provided data and statistical support. Other notable programs include those in libraries at Columbia University, Cornell, Duke, Emory, University of North Carolina, University of Michigan, the University of California, Berkeley (and other UC campuses), amongst others in the USA and around the world. See Gold (2010) and Yoon and Schultz (2017) (and references therein) for useful information.
We present a brief history of our own computational research support organization in Stanford University Libraries that has grappled with these challenges. Software and Services for Data Science (SSDS; https://ssds.stanford.edu/) is the public service point within the Stanford Libraries’ Center for Interdisciplinary Digital Research (https://cidr.stanford.edu/) that frequently collaborates to provide consultation and workshop services to students, faculty, and staff. Our focus is on the acquisition of social science data and the selection and use of quantitative (and until recently, qualitative) software and methods through workshop trainings, one-to-one consultation sessions, and other less formal connections that occur in-person, through emails and asynchronous learning materials, and more recently, on Zoom teleconferencing calls. SSDS specializes in software onboarding and introductory programming, data acquisition, wrangling, visualization, analysis, survey design, working with text data, and machine/deep learning.
It is hard to tell how original the SSDS service model is because our own history is patchy, not well-organized, and not publicly available—this is part of our motivation for this study, to make public our history and participant statistics. As such, comparison to other institutions’ service models is complicated because they also suffer from the same challenges we face in curating and advertising their histories. Regardless of how unique SSDS’s history is, our service model focuses on a shared public space where consultations and workshop trainings occur and a small, lean staff that is diverse in their backgrounds and computational and methods expertise. Since its origins, SSDS staff structure has generally consisted of 1–2 (part or full time) data specialists who plan workshop and services, outreach activities, and maintain the website. The data specialists have been formally trained librarians, a humanist, and a social scientist/humanist (EM, current Head of SSDS). A small group of around 6–8 graduate students (paid hourly) consult on data, tools, and software, design and teach workshops, and write asynchronous learning guides. In the event we cannot help, we refer consultees to our network of on-campus partners.
We present three sources of SSDS data to explore the impact of our services: (1) an annotated historical timeline, (2) over 20 years’ worth of consulting and workshop participation metrics, and (3) workshop feedback form responses (n = 99) since December 1, 2021 when the form was overhauled. Results indicate that SSDS computational research support services in Green Library have remained in-demand, despite changes in tools, software, methods, online learning, and the global COVID-19 pandemic. Furthermore, issues that researchers attempted to address in the 1980s are still prevalent today, especially for onboarding beginner researchers to software and methods and for navigating large datasets and remote computing support. In conclusion, we discuss overarching trends and emphasize why University Libraries should build and maintain well-integrated computational research units as part of their broader support for researchers and provide recommendations for some of the challenges faced.
Data and methods
The SSDS archive
We explored the SSDS printed and written archival materials for the historical analysis of this research. A case study approach (Creswell, 2013) was used to analyze the SSDS physical archive, which dates from 1971 to May 2022. The archive contains much of SSDS’s internal documentation and is assumed to be representative of its activity and service history. Printed materials include old notes and emails, meeting agendas, invoices, teaching materials, learning guides, consulting and workshop registration and sign-in sheets, and yearly reports. Written materials included many notes about services, procedures, and attendance. Old newspaper clippings were also included when excitement was so great that it was publicized. The only digital items were a few emails and notes that were printed on paper and added to the physical archive. EM manually reviewed the materials and coded the historical categories, organization, and patterns. A matrix (Miles et al., 2013) was used to organize the archive entries into categories about computing, data, software, and methods support. They were entered into a timeline to explore inflection points and trends in social science computing in the library through time. Examples include needs assessments and reports, technological advancements, and new software documentation.
Consulting and workshop metrics
Participant data from consultations and workshops are presented to compliment the historical perspective. These data were curated and analyzed from multiple ingestion points such as emails, appointments, drop-in hours, paper sign-in sheets, electronic sign-in kiosks, shared storage hard drives, notes, summary reports, and Zoom attendance reports. The consulting data consists of academic years 1999–2021, while the workshop data is from 2000 to 2021. Stanford operates on the quarter system, with an academic year consisting of Fall (September to December), Winter (January to March), Spring (March to May), and Summer (June to September) quarters. A dot plot is used to illustrate the number of consulting and workshop participants through time.
The consulting dataset contains the following variables per academic year: total number of consultations, number of email and in-person consultations, and percent consultee affiliation, when available: graduate, undergraduate, faculty, staff, postdoctoral, or other (which includes visiting scholars/researchers, resident assistants, non-affiliated staff, etc.). The percent affiliation columns might not sum to 1 for some years because this information was not always captured and instead was often included in the SSDS physical archive as a random note or scribble. Due to the COVID-19 pandemic and the health risks for in-person consultations, in-person consultations for academic years 2020–2022 were held over Zoom, except Winter and Spring Quarters 2022 when in-person consultations resumed. The 2021–2022 data only represent Fall, Winter, and part of Spring Quarter and thus do not represent the entire year and are presented separately at the end of the Results section.
The workshop dataset reports the following variables per academic year: total number of participants, number of workshops, average number of participants per workshop, and percent affiliation, when available: graduate, undergraduate, faculty, staff, postdoctoral, or other (which includes visiting scholars/researchers, resident assistants, non-affiliated staff, etc.). Like the consulting dataset, the percent affiliation columns also might not sum to 1 because this information was similarly not always recorded. Attrition rate (percentage of those who register for a workshop but did not participate) for years 2020–2022 is 51%. In cases where only registrant information was present, this number was multiplied by 0.49 to estimate the actual participation in a given workshop. Also like the consulting data, the 2021–2022 data only represent Fall, Winter, and part of Spring Quarter and thus do not represent the entire year and are also presented separately at the end of the Results section. Finally, due to the COVID-19 pandemic and the potential dangers for in-person meetings, in-person workshops for academic years 2020–2022 were held over Zoom, except for Spring Quarter 2022 where in-person/Zoom hybrid remote formats are currently being experimented with.
Workshop feedback form responses
To provide a glimpse of how services impact learning computational software, tools, and methods, we overhauled the workshop feedback form on December 1, 2021, to gain a better understanding of workshop participant attitudes during the COVID-19 pandemic and the transition back to in-person/hybrid learning. Qualtrics is used to distribute the form, and the following workshop feedback form metrics are presented: mean item response, mean standard deviation, and Cronbach’s alphas and confidence intervals. The arithmetic mean of the response (x̄) is simply the sum of the responses divided by the number of responses. The mean standard deviation (σ) indicates the amount of dispersion in the responses around the mean. N is the number of responses. Cronbach’s alpha (α) ranges from 0 to 1 and indicates the internal consistency/reliability of a set of questions in a block, or more simply how related questions are to each other by block; closer to 1 means they are more reliable. Alpha was calculated for question blocks familiarity, content, instructor, and environment. The following agreeability statements and point scales are asked in the blocks presented below:
Pace of the workshop: 1 = very slow, 2 = a little slow, 3 = just right, 4 = a little fast, 5 = very fast
Familiarity with the presented workshop topic and/or tool before versus after the workshop: 1 = not at all familiar, 2 = a little familiar, 3 = familiar, 4 = very familiar, 5 = expert
The workshop content: A) I learned a new skill or skills, B) I learned something I can apply directly to my own research, and C) I learned something to help in a class: 1 = strongly disagree, 2 = somewhat disagree, 3 = neither agree nor disagree, 4 = somewhat agree, 5 = strongly agree
The workshop instructor: A) Clearly explained the workshop goals, B) explained the topic in a way that I could understand, and C) took time to answer my questions: 1 = strongly disagree, 2 = somewhat disagree, 3 = neither agree nor disagree, 4 = somewhat agree, 5 = strongly agree
The workshop environment: A) Considered my needs, B) made me feel welcome, and C) was appropriate for asking questions: 1 = strongly disagree, 2 = somewhat disagree, 3 = neither agree nor disagree, 4 = somewhat agree, 5 = strongly agree
Beginning April 1, 2022 we have also begun to ask: did the hybrid learning environment meet your needs? 0 = no, 1 = yes
To try and boost the response rate, we currently do not publicly report out participant affiliation by department from the workshop feedback form (i.e. are you an: undergraduate student, graduate student, faculty member, staff member, etc.) because some verbal feedback indicated that it is an identifying response item when groups are small, an apprehension expressed by some undergraduate students that has hindered their participation amongst groups of graduate students, faculty, and staff. A two-sample, two-tailed homoscedastic t-test was used to test for statistically significant differences between participant familiarity with the presented topic before versus after a workshop.
Historical context of Software and Services for Data Science (SSDS) at Stanford University
Early years
The earliest Social Science Computing at Stanford - Report to the Vice Provost for Academic Computing and Information Systems and the Dean of the School of Humanities and Sciences - in the SSDS archives was dated March 1984. For this report, Stanford’s Instruction and Research Information Systems Division surveyed faculty members in Fall of 1983 through interviews and questionnaires to understand substantive themes around computer use by social scientists on campus and identified two major themes. First, social scientists overwhelmingly used computers to perform text processing and statistical analysis of their datasets and faced myriad challenges when trying to manage databases, visualize data, and use data for instructional purposes. Second, social scientists were frustrated with the high cost of financial resources needed to use microcomputers, computer systems, and mainframes for their varying departmental needs.
By 1987–1988, two Stanford VM/CMS IBM operating system computers were made available for use by researchers. The first machine named Watson (2 CPUs; specs uncertain at time of writing this manuscript) was used for statistical processing, mainly by social science researchers in the College of Humanities and Sciences (H&S) (40% of users), Academic Data Services (ADS, 12.5%; discussed below), Institute for Mathematical Studies in the Social Sciences (25%), Graduate School of Education (10%), and Law (5%). The second, named Oberon (also 2 CPUs; specs also uncertain), was used for numerical processing by Chemistry (50% of users), various vector processing tasks (25%), and Law (12.5%). Researchers from Engineering, Earth Sciences, Medicine, and the Graduate School of Business became more frequent users as well. Besides the hardware itself, administrative challenges revolved around how to combine users with similar needs, problems, and applications while allowing for the maximum resource allocation in environments that would minimize software maintenance and still reserve space for one-off users not affiliated with main departments or projects. Servers named Power and Wisdom were also two others made available for faculty and student use.
SSDS’s history began a few years later following the 1989 Loma Prieta earthquake (https://news.stanford.edu/features/2014/loma-prieta/). During the interior renovation of the earthquake-damaged Cecil H. Green Library west wing, plans to expand library services were also underway. Responding in large part to the growing trend among research on campus toward more distributed computing, the planning group for the newly formed Social Science Resource Center (SSRC) within Stanford University Libraries considered how the library might provide better access to, and help for, finding, accessing, and using social science data. Their proposal called for a service for students, faculty, and staff that would incorporate library resources, statistical software, and computational expertise to support social science and humanities research.
However, Academic Data Services (ADS) was actually the forerunner to SSDS. It was officially founded in 1971, although formal documentation does not appear in the SSDS archive until 1986. ADS was a joint collaboration between SSRC and the Distributed Computing Group from Information Technology Systems and Services (now known as University IT). ADS provided consultation help for accessing, downloading, and wrangling data, published user guides, and troubleshooted SAS and SPSS on Unix. Two other complementary and colocated public services, Social Sciences Data Service (SSDS) and Statistical Software Support (SSS), opened in Fall 1999, although the group between these two services formed in 1992. During the first 3 years these services grew steadily and in 2003 SSS merged with SSDS to form Social Science Data and Software (keeping the original SSDS acronym). The change underscored a unique collaboration of services and resources first, by establishing a single name and point of contact for users. This included the website https://ssds.stanford.edu, with the earliest Internet Archive record capture of our home page dating to November 25, 2003 although the actual origin date might be even earlier. These collaborators collected and cataloged numeric datasets (and their documentation) in machine-readable format (e.g. data tapes) and staff members provided assistance to the Stanford community in finding computer datasets via the Libraries’ online catalog (“Socrates”, now called Search Works). Researchers could request access to Stanford-owned datasets on tape via ADS and mount them on the Andrew File System (AFS) Stanford-based data storage servers. Statistical consultants helped consultees select and use quantitative software to analyze data and provided workshop trainings.
Between 1986 and 1989, ADS received 1230 total requests (44% Political Science, 36% Economics, and 13% Sociology, in addition to other unknown percentages of departments) and averaged one request per day in 1988, and two requests per day in 1995. Libraries and Information Resources (https://news.stanford.edu/pr/94/940809Arc4164.html) statistical consulting in Fall Quarter 1993 reported that 54% of inquiries pertained to using SAS or SPSS packages on Unix, 34% dealt with application issues on PC and Mac (especially SAS on PC), with other questions pertaining to packages from the Bio-Medical Data, Time Series Processor, MiniTab, and Math softwares. Between Fall Quarter 1995 and Winter Quarter 1997, a total of 730 data tapes were ordered for 74 users (52 graduate students, 8 undergraduate students, 7 faculty, and 7 unknown). Students were mostly from Psychiatry (22%), Education (19%), and Sociology (16%) departments, along with unknown percentages from Economics, Economic Engineering Systems, Anthropology, Industrial Engineering, Medicine, and Business.
The Stanford University Library Academic Information Resources (SULAIR) was formed in 1991. SULAIR was a consortium of staff from the Information Center, Digital Library Systems and Services (DLSS), Branner GIS Library, Cubberley Education Library, Residential and Library Clusters, Academic Technology Specialists, the Integrated Data and Statistical Lab, and Communication and Documentation specialists. The Social Sciences Research Group was founded in 1992 to perform statistical applications consulting. Most users of these services between 1995 and 1996 were from the departments of Economics, Business, Political Science, Sociology, Health Research/Policy, Education, Law, and University of California, San Diego. In 1999 the Collection Redeployment Plan requisitioned Federal, California, and International government documents on Folio and Microfiche. Between Fall 2000 and Spring 2002, 734 datasets were requested (out of 3359 available) on the Stanford Ops.db server for acquiring tapes and print codebooks from organizations such as ICPSR. Sixty three percent of all requests came from students, many as research assistants working for faculty members.
The 2000s
The 2001 Computing Infrastructure and Academic Needs Report at Stanford University provided an updated assessment for several aspects related to social science computing. Hardware was to be updated on 3-year cycles and provide high performance computing clusters and multiprocessor arrays for students. Additional needs included the conversion and building of classrooms to accommodate rapidly changing technologies. Software was to be provided and supported with new market releases, along with commercial Internet access in the evolving campus-wide infrastructure, the updating and installation of high-speed wall ethernet ports in offices, labs, cafes, and common spaces, and facilitation of high speed Internet access to faculty homes. These upgrades required staff support in the form of computing and database professionals, expansion of the Academic Technology Specialist program (departmental specialists who utilize computers, software, and other technology to enhance departmental-specific teaching and research), expansion of the Software Licensing Office, and development of training programs and tools for faculty, staff, and students. At this time there was also a need to increase central and localized security protocols, provide a single access point for resource access, expand IT and curriculum resources to Stanford international campuses, develop a general endowment fund to support the prevailing initiatives, and kickstart an innovation fund to ensure that Stanford stayed on the cutting edge of social science computing headed into the future. Many users in 2001–2002 were from Human Biology, Graduate School of Education, Sociology, Graduate School of Business, Economics, International Relations, and Medicine.
By 2002, SSDS workshop and consulting topics included service overviews, how to access and download data, and support for the most popular quantitative and qualitative software such as: Microsoft Office ‘98, Adobe PageMaker, SAS, SPSS, Stata, S and S-PLUS, Stat/Transfer, MiniTab, Amos, DeltaGraph, Table Curve 3D, ArcGIS, ArcView 3.2, S+ for ArcView GIS, S+ Spatial Stats, SpaceStat, MapInfo, Adobe Flash, EndNote, NVivo, ATLAS.ti, Sudaan, HLM, MLwiN, and CVINET. Common support requests were made for help with data wrangling, text processing, database searching and management, survey design and text analysis, social network analysis, geospatial mapping and analysis, statistical procedures, and instructional uses for data.
From Fall 1999 through Summer 2012, SSDS reported 16,234 total in-person and email consultations (48% graduate students, 42% undergraduates, and 10% faculty, staff, visiting scholars, and others). Between Fall 1998 and Summer 2012, SSDS provided more than 257 workshops that covered social science data resources, data discovery and download strategies, and quantitative and qualitative software for beginning and advanced users that reached at least 2660 students, faculty, staff, and postdocs (average of more than 10 participants per workshop during this time period). SSDS and the Library also created the Social Science Data Collection which allowed Stanford researchers to curate, redistribute, and archive their projects. The earliest evidence of feedback form distribution in the archives is from 2002, which consisted of a staff email discussing which questions to send to Honor’s College workshop participants to improve delivery of services and what topics participants hope to see in future offerings, questions that are still on the feedback form to this day.
Many consultation topics at this time dealt with accessing numeric datasets on tape, CD-ROM, and diskette. The SSDS archive also included documentation to help researchers access email and navigate the Internet. Furthermore, SSDS continued support ICPSR, the Roper Center for Public Opinion Research, Association of Public Data Users, Data Documentation Initiative, and Data Extraction Web Interface (DEWI). ICPSR was immensely popular with a total of 68,920 data files downloaded between 1998 and 2005. The Roper Express service was also launched and in Fall Quarter 2004, 20 datasets and 25 codebooks were downloaded. In Winter Quarter 2005–2006 alone, Stanford users downloaded a total of 38,665 data files. DEWI was launched in 2003 and was a well-integrated web-based data search and extraction tool created by the Jonsson Library of Government Documents and ADS for accessing social science numeric data for research and teaching. It contained 156 datasets by 2005 and provided an easy-to-use resource for instructors teaching courses that used social science methods via secondary survey data, as well as a valuable discovery tool for research. DEWI outreach occurred in individual consultations, workshops, and course sessions in Sociology, Political Science, and Education. Other special sessions provided help for honors students in the Methods of Analysis Program to prepare them for summer data collection work, especially regarding survey design, text analysis, tips for data entry, and the available quantitative and qualitative software at Stanford. The majority of school affiliations of SSDS participants between 2002 and 2005 were Humanities and Science (77%), Graduate School of Education (16%), and Other (7%), which consisted of researchers from Economics, Political Science, Graduate School of Business, Business, Law, Sociology, Anthropology, Medicine, International Relations, Psychology, Public Policy, and Human Biology.
In 2005, four workshops were standardized and offered every quarter: Introduction to SSDS Data and Software Services and Resources, Choosing Quantitative Software for Research, Choosing Software for Qualitative Research, and Finding and Getting Data for Research and Instruction. Other services offered included software troubleshooting and tips for data entry, research planning and design, and writing. At this time, SSDS’s public teaching and consulting space, the Velma Denning Room (VDR), housed nine computers, 2085 non-circulating volumes (mostly consisting of software codebooks and volumes), 809 dataset codebook titles, 440 software manuals and texts on statistics and advanced methods, 504 CD-ROM, DVD, and diskette titles, and had distributed over 3000 asynchronous learning guides across campus. Researcher data were commonly stored on CD-ROMs, USB drives, diskette, and the AFS server.
Examples of collaborations during this period included those with subject matter specialists (traditionally referred to as librarians, selectors, or bibliographers) who worked with the Honors College, Undergraduate Advising and Program, Disability Resource Center, and other campus departments and various committees. Other successful collaborations were made with the Institute for Research in Social Science (IRiSS) to identify web survey software needs of Stanford researchers through the piloting of the Opinio web survey package to better construct, administer, and analyze web-based surveys. The resulting Survey and Data Analysis project was initiated between SULAIR and the University of California, Berkeley, Survey Research Center (SRC) and was eventually hosted on a Solaris server supported by DLSS. In 2007, SSDS, SULAIR, and IRiSS spearheaded the Social Science Needs Assessment Project to identify the current research, teaching, and learning needs of social science programs at Stanford University and hosted the 34th annual International Association for Social Science Information, Service and Technology conference (IASSIST) the following year (http://web.archive.org/web/20090524005219/http://stanford.edu/group/ADS/cgi-bin/drupal/). IASSIST is a professional membership organization comprised of data librarians, archivists, producers, researchers, and applications developers throughout the world whose members work in a variety of settings and often serve as directors of libraries, national data archives, statistical agencies, research centers, academic departments, government institutions, and non-profit organizations. The local arrangements committee was staffed by Ron Nakao, the UC Berkeley SRC, and UC Berkeley Library.
Between 2006 and 2009, researchers downloaded 3745 datasets and 3686 documentation files from the Roper Center. Between 2007-2009, 3415 projects were undertaken on 17,222 datasets stored in 58,381 individual files from ICPSR. Pedagogical trainings to improve SSDS workshop instruction were first implemented in 2008, while 2009 marked the appearance of R programming language support in the SSDS archive, a trend that would grow sharply into the modern era. Other supported topics included research planning, experimental design, Microsoft Excel, statistical procedures, geographic information software, NVivo, using Stata and R on Stanford remote servers, and asynchronous learning via the printed guides. There was also a noticeable need to improve reporting practices and a Drupal server upgrade glitch caused loss of a significant proportion of consulting log data. From 2010 to 2012, Roper Center reported 11,592 queries for dataset and documentation downloads, RoperExplorer Table Views, and iPOLL + Tab views. Like years prior, SSDS mainly continued to support SSPS, SAS, Stata, NVivo, Atlas.ti, survey research design, survey design, text preprocessing and analysis, geospatial mapping, network analysis, and statistical procedures. Similar trends continued through 2012, but with an increasing number of requests for R support.
The future
The years 2012–2017 marked a shift toward instruction and consultation support for Stata and R (and Python to an increasing extent). SSDS also began tracking consultations via the SSDS website consult log in 2012. As of 2017, the Velma Denning Room was home to 1159 books/volumes and 5083 data disks and CD-ROMS, and since then we mainly focus on R, Stata, and Python support for researchers querying APIs to access “big” data, data wrangling, visualization, and analysis, survey design, text preprocessing and analysis, and various forms of machine and deep learning. The year 2021 then marked another name change as SSDS then became Software and Services for Data Science (luckily again still using the same abbreviation!). Traditionally in-person consultations and workshops moved to Zoom format during 2020–2021 because of the COVID-19 pandemic, with hybrid workshop experimentation currently underway in Spring Quarter 2022. Requests for Python programming language support are rapidly increasing due to its generalized structure and strong data science capabilities. Our current standardized workshop schedule consists of R and Python trainings for: introductory programming, data wrangling, data visualization, introduction to text analysis, and introduction to machine learning.
Part of SSDS’s goals is to not only consult with our patrons on research software and training, but also to highlight the growing data collections of the Stanford Libraries. A natural partnership is one between computational research support units and other internal library staff, such as our bibliographers and subject specialists, who are uniquely positioned to provide the initial consultations with researchers regarding the identification of information resources pertinent to their work.
As patrons move from identification of the data resources, to access and exploration, to understanding how to use the data in their analysis, there is a natural liaising process that ultimately brings many patrons to SSDS for assistance. Through this process, the researchers may be exposed to some of the Libraries’ data storage and exploration tools including our primary catalog SearchWorks, the Stanford Digital Repository and the Stanford Data Farm (https://redivis.com/Stanford). Within these systems, patrons can find collections in machine readable formats such as the Washington Post and New York Times historical text archives, the Gallup World Poll, as well as various CoreLogic and L2 data sets. These collections are growing rapidly and we expect data sets to be a very large part of our collections and curation work as Stanford University continues to support data science and data-intensive research more holistically within the Library.
If co-consulting between librarians and computational research support groups like SSDS can happen in the early stages of a consultee’s research where there is overlap between the data acquisition and computational planning part, there arises an opportunity for all parties involved—the consultee, along with the librarian, and the computational research support consultant—to boost their data literacy. However, the term “data literacy” carries with it an inherent technical component, beyond the data itself, that is yet another necessary hurdle to access and use data. SSDS’s definition of data literacy is flexible and evolving but aligns mostly with the definition provided by Bonikowska et al. (2019, cited in Bauder, 2021: 8) as: “. . .skills necessary to access data, manipulate them, evaluate their quality, conduct analysis, interpret the results, and (in most frameworks) use data ethically.” We would add to this definition the needs for knowing how to explore, visualize, secure, and present data. It can be argued that higher education is failing its students through inadequate training around data, research, and preparation for the modern job market. To enact the necessary changes to make all students, faculty, and staff at all universities data literate however, there needs to be sweeping changes at the administrative, curricular, and faculty training levels to ensure that students are being prepared to find, use, and think critically about data for adequate career preparation, where an increasing amount of jobs have—or will soon have— data and technical components. Impacting students at the undergraduate level is one of the ways to make the most immediate change (Burress et al., 2021; Douglas et al., 2021).
Quantitative Results
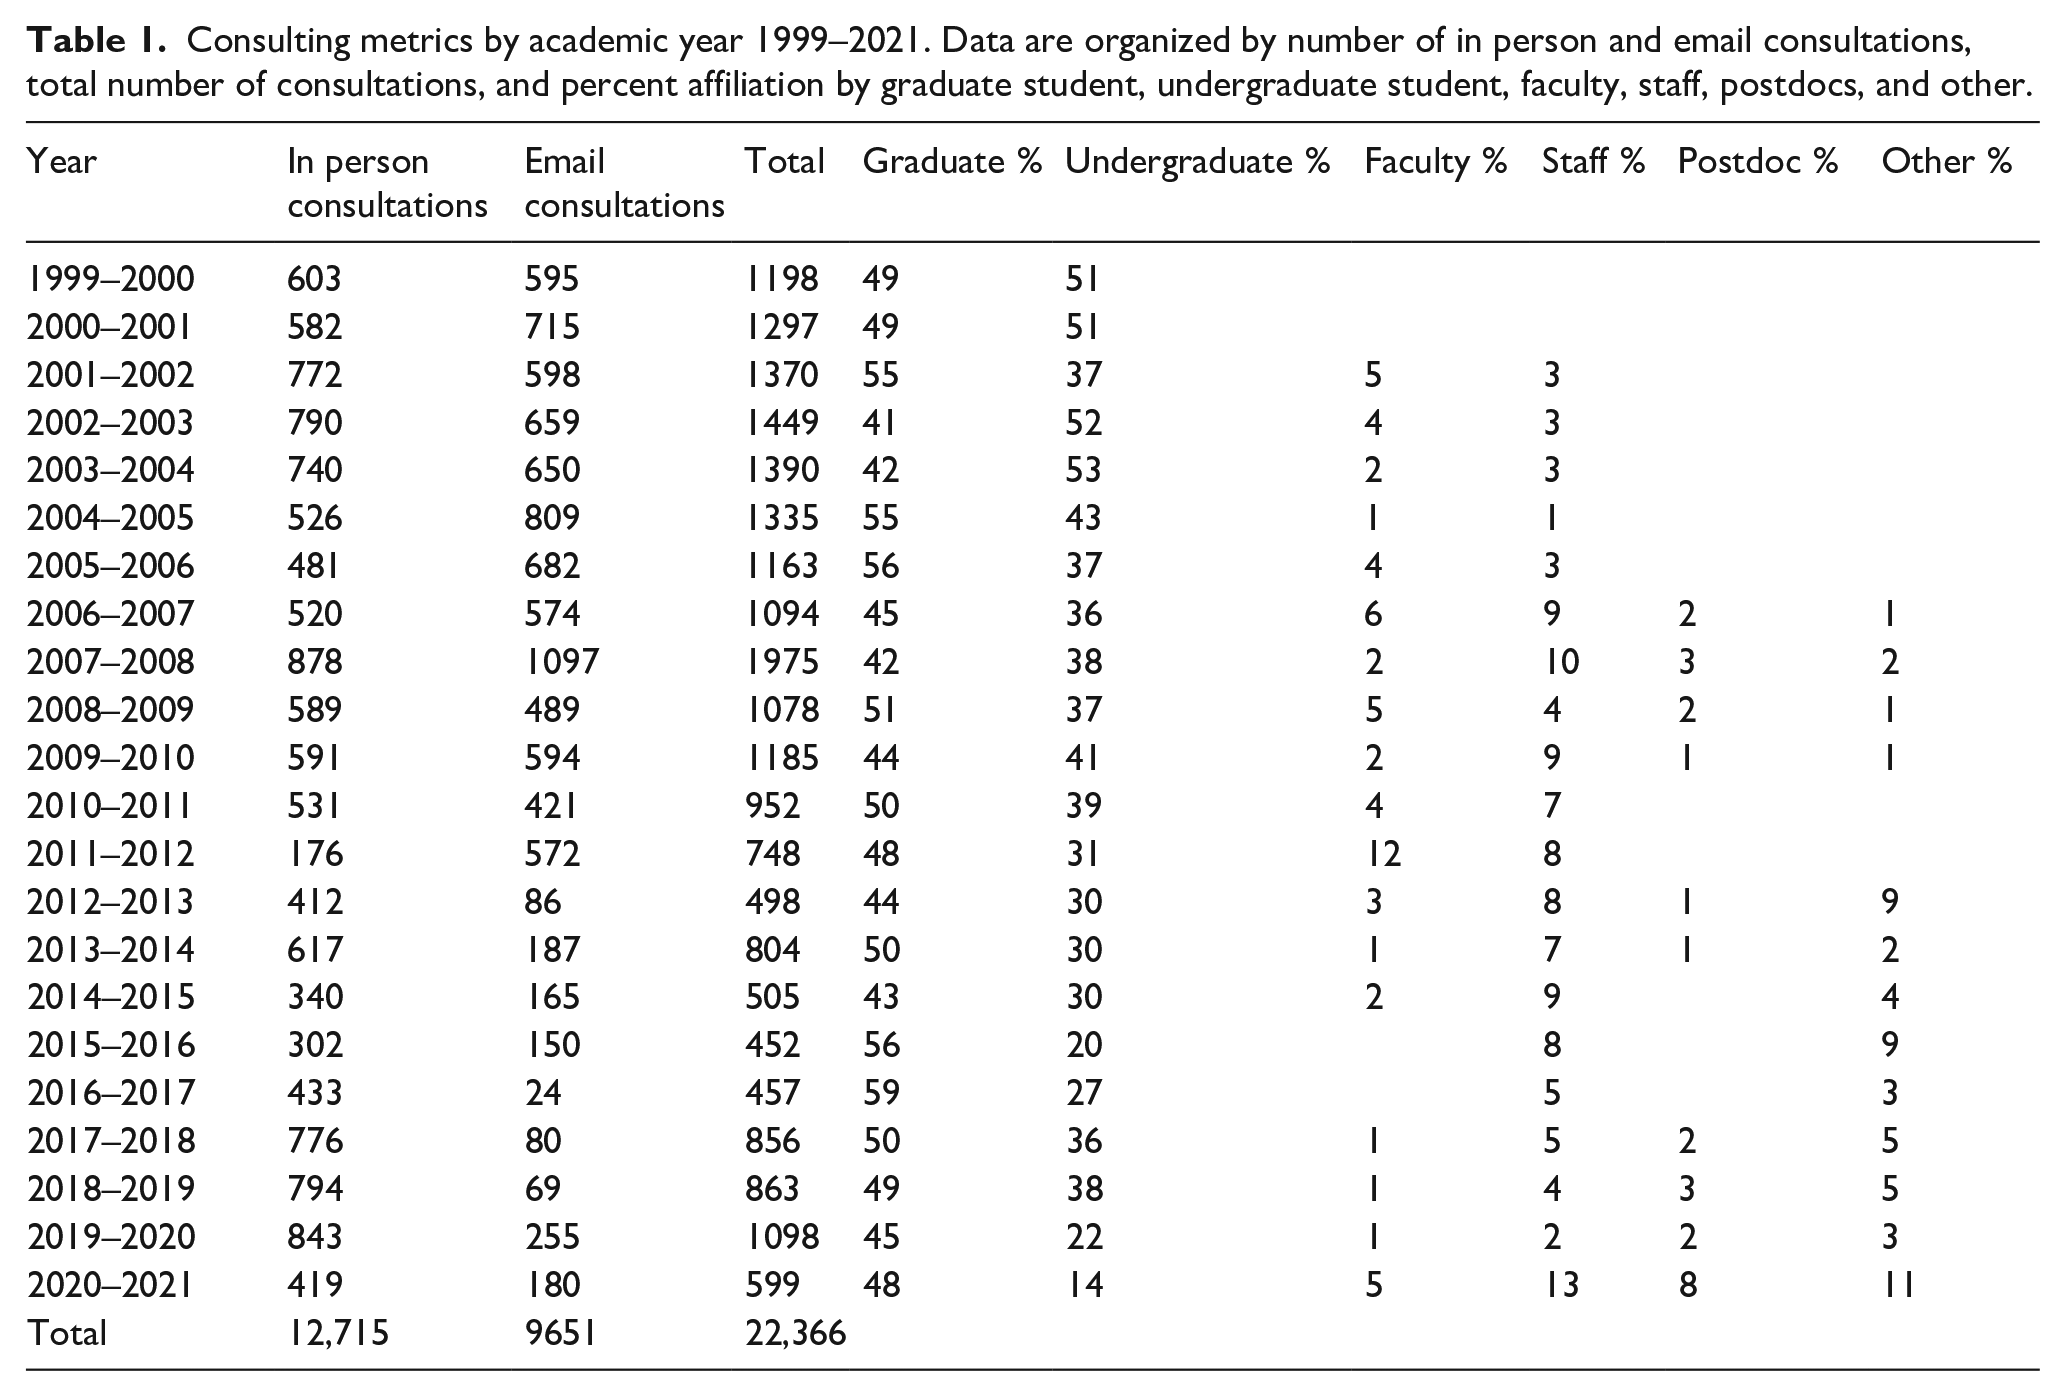
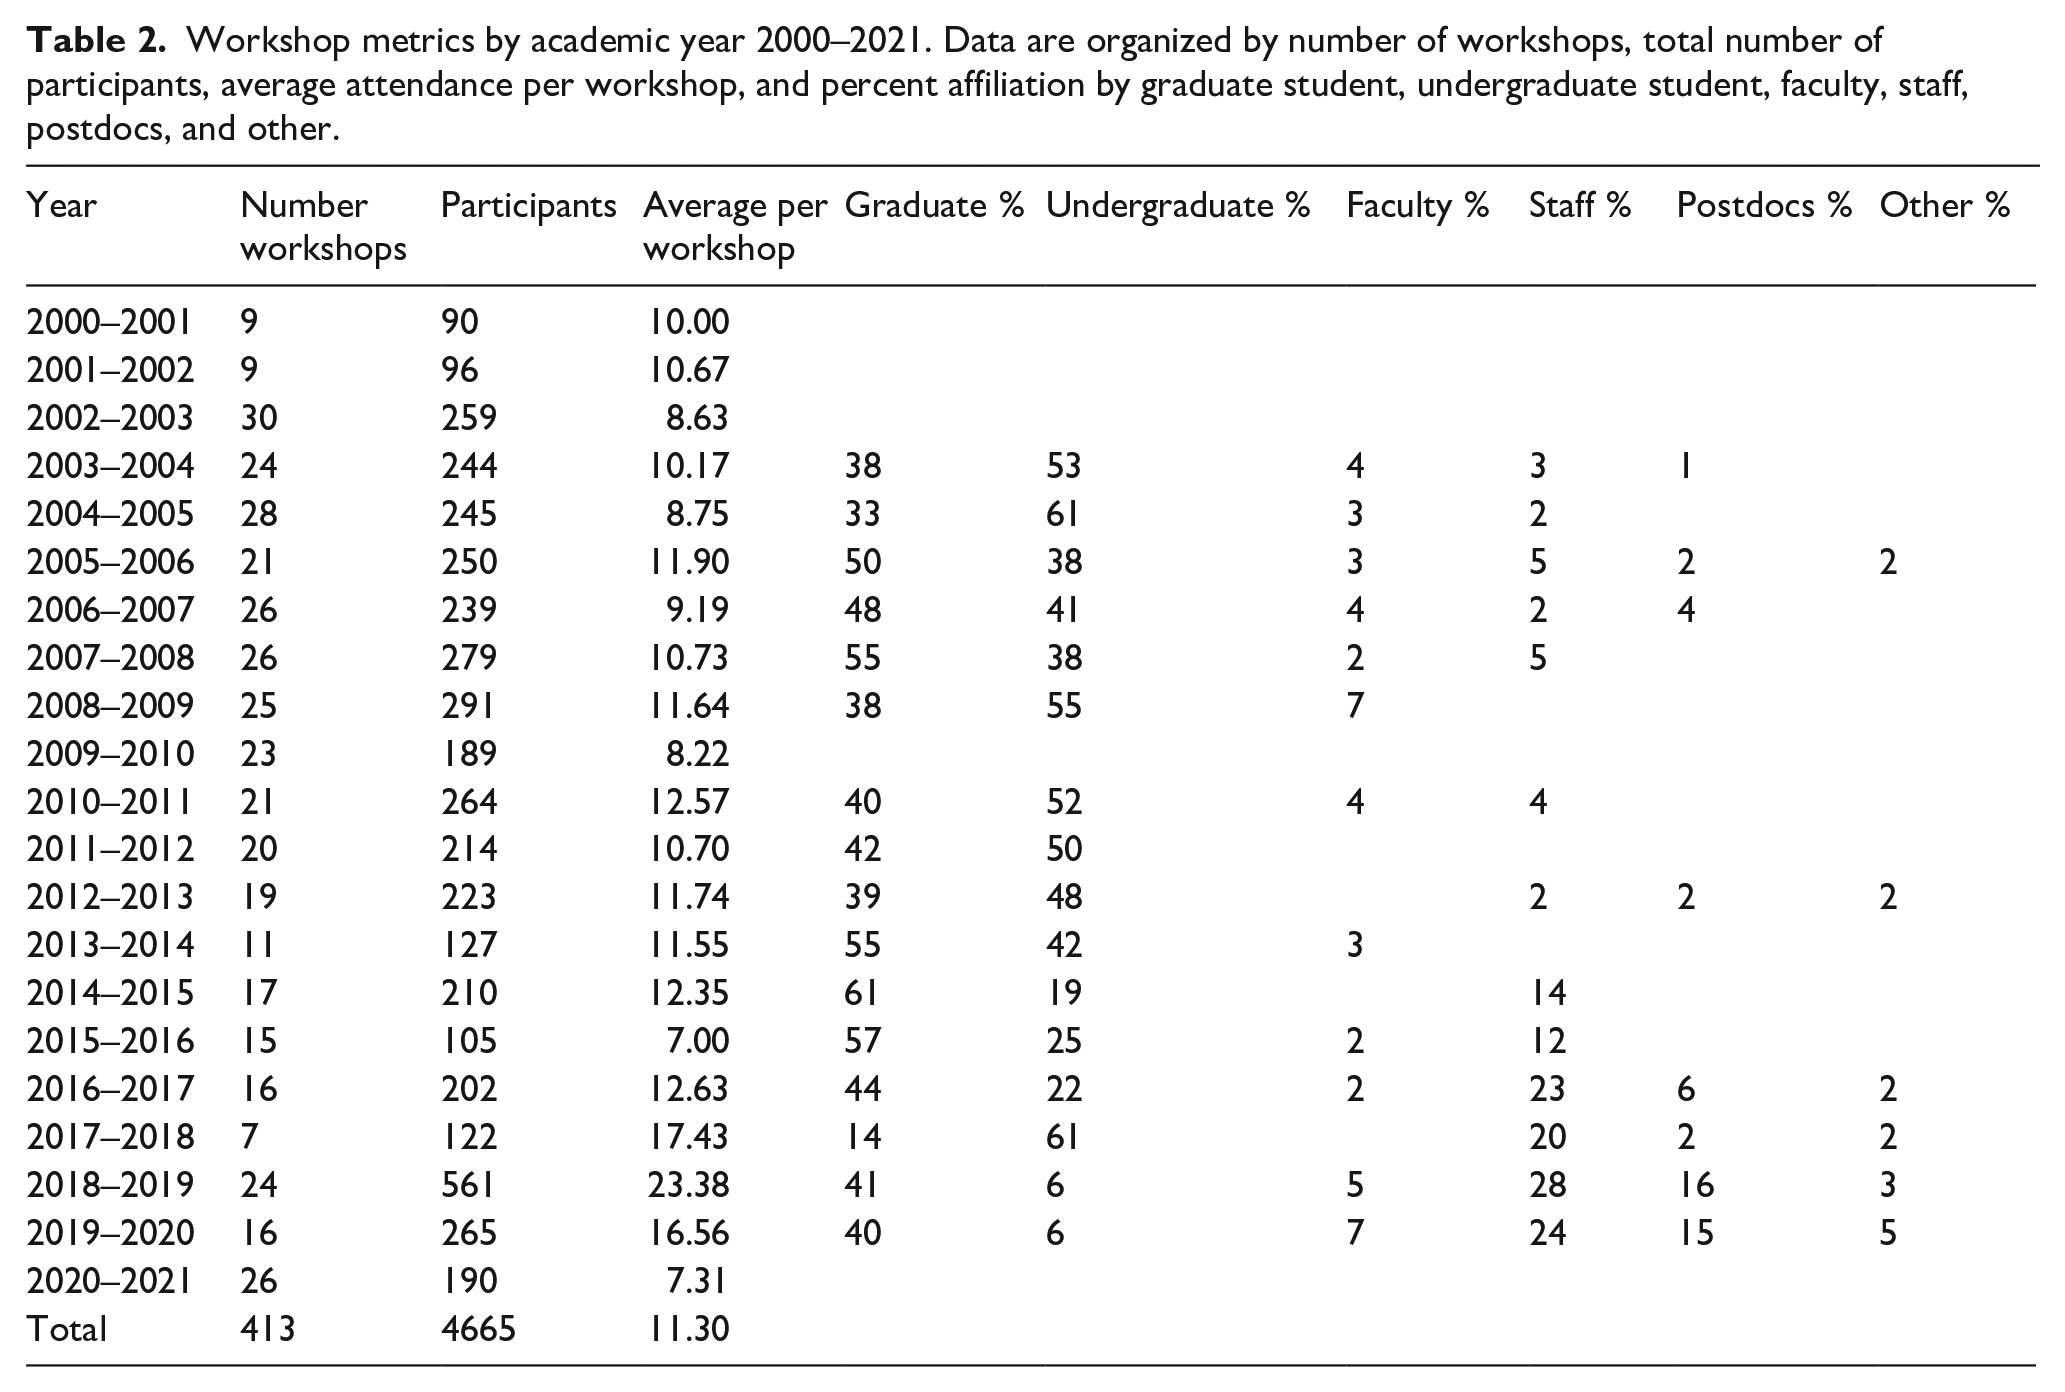
Quantitative results show that SSDS has impacted at least 27,031 researchers between 1999 and 2021 through 22,366 consultations (average of more than 1000 consultations per year) and 4665 workshop participants (average of 222 participants per year). Graduate students make up roughly half of these consultations, thus showing how critical computational research support is to the success of their presentations, posters, theses, dissertations, and publications. Undergraduate students historically have followed in a close second (and even surpassed graduate students in some years) for help with capstone and other research projects, but their engagement has tapered off a little in recent years. Staff are the next most affiliated group, and generally seek help with professional academic projects related directly to the University and/or their own professional careers. Faculty and postdocs comprise a smaller percentage of services, and generally contact us for help with specific aspects of nuanced, highly engaged grant and contract funded projects (and sometimes do so through their graduate students and postdocs). Consulting metrics are presented in Table 1 and workshop participation metrics are shown in Table 2. Consulting,workshop, and total participation numbers are illustrated as a dot plot in Figure 1.
Consulting metrics by academic year 1999–2021. Data are organized by number of in person and email consultations, total number of consultations, and percent affiliation by graduate student, undergraduate student, faculty, staff, postdocs, and other.
Workshop metrics by academic year 2000–2021. Data are organized by number of workshops, total number of participants, average attendance per workshop, and percent affiliation by graduate student, undergraduate student, faculty, staff, postdocs, and other.
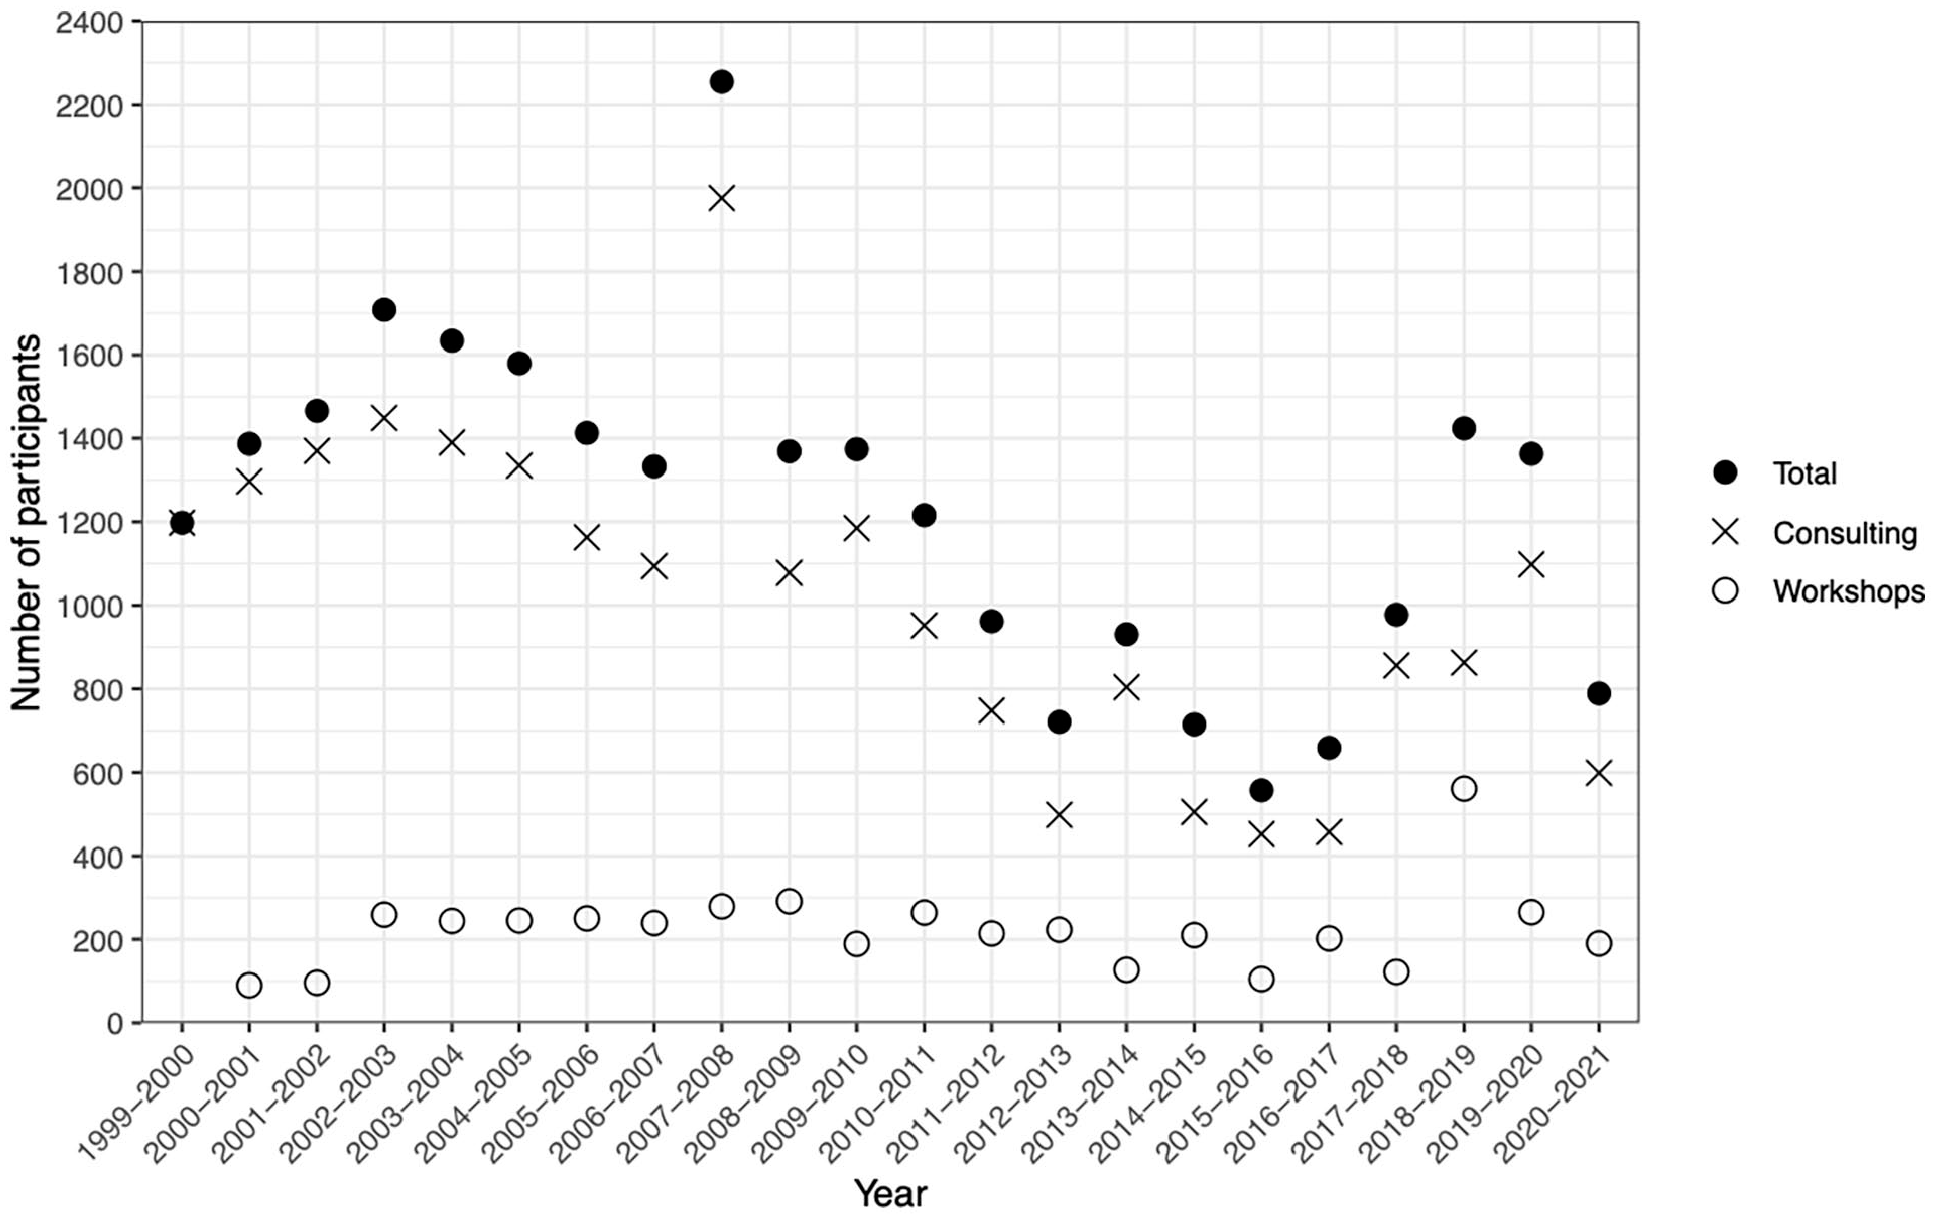
Dot plot showing number of participants (y-axis) by academic year (x-axis). For each year, the × symbol represents consulting participation, the ○ symbol represents workshop participation, and the • symbol represents the total sum of consulting plus workshop participation. No workshop data were present for academic year 1999–2000, thus the symbol is not marked on the figure.
Workshop feedback form results are presented in Table 3, and indicate that participants find the pace of workshops to be approximately just right (x̄ = 3.26, σ = 0.66). Participants report an increase of over one scale point for their familiarity with a topic before taking a workshop (x̄ = 1.78, σ = 0.70) compared to after (x̄ = 2.81, σ = 0.73), a statistically significant difference as identified by the t-test (p < 0.000, t = 9.92, df = 176.8). Responses indicate high marks for questions related to content: I learned a new skill or skills (x̄ = 4.21, σ = 0.93), I learned something I can apply directly to my research (x̄ = 4.22, σ = 0.91), and I learned something to help me in a class (x̄ = 3.86, σ = 0.97). Responses about the instructor were very high: the instructor clearly explained the workshop goals (x̄ = 4.67, σ = 0.79), explained the topic in a way I could understand (x̄ = 4.72, σ = 0.61), and took time to answer questions (x̄ = 4.70, σ = 0.76). Participants gave additional high marks for the workshop environment: that it considered my needs (x̄ = 4.52, σ = 0.83), made me feel welcome (x̄ = 4.76, σ = 0.63), and was appropriate for asking questions (x̄ = 4.76, σ = 0.68). Although the question was added late in the academic year, 100% of queried participants (n = 43) indicated that the hybrid in-person/Zoom learning environment suits their needs.
Workshop feedback form metrics since implementation of the updated form on December 1, 2021.
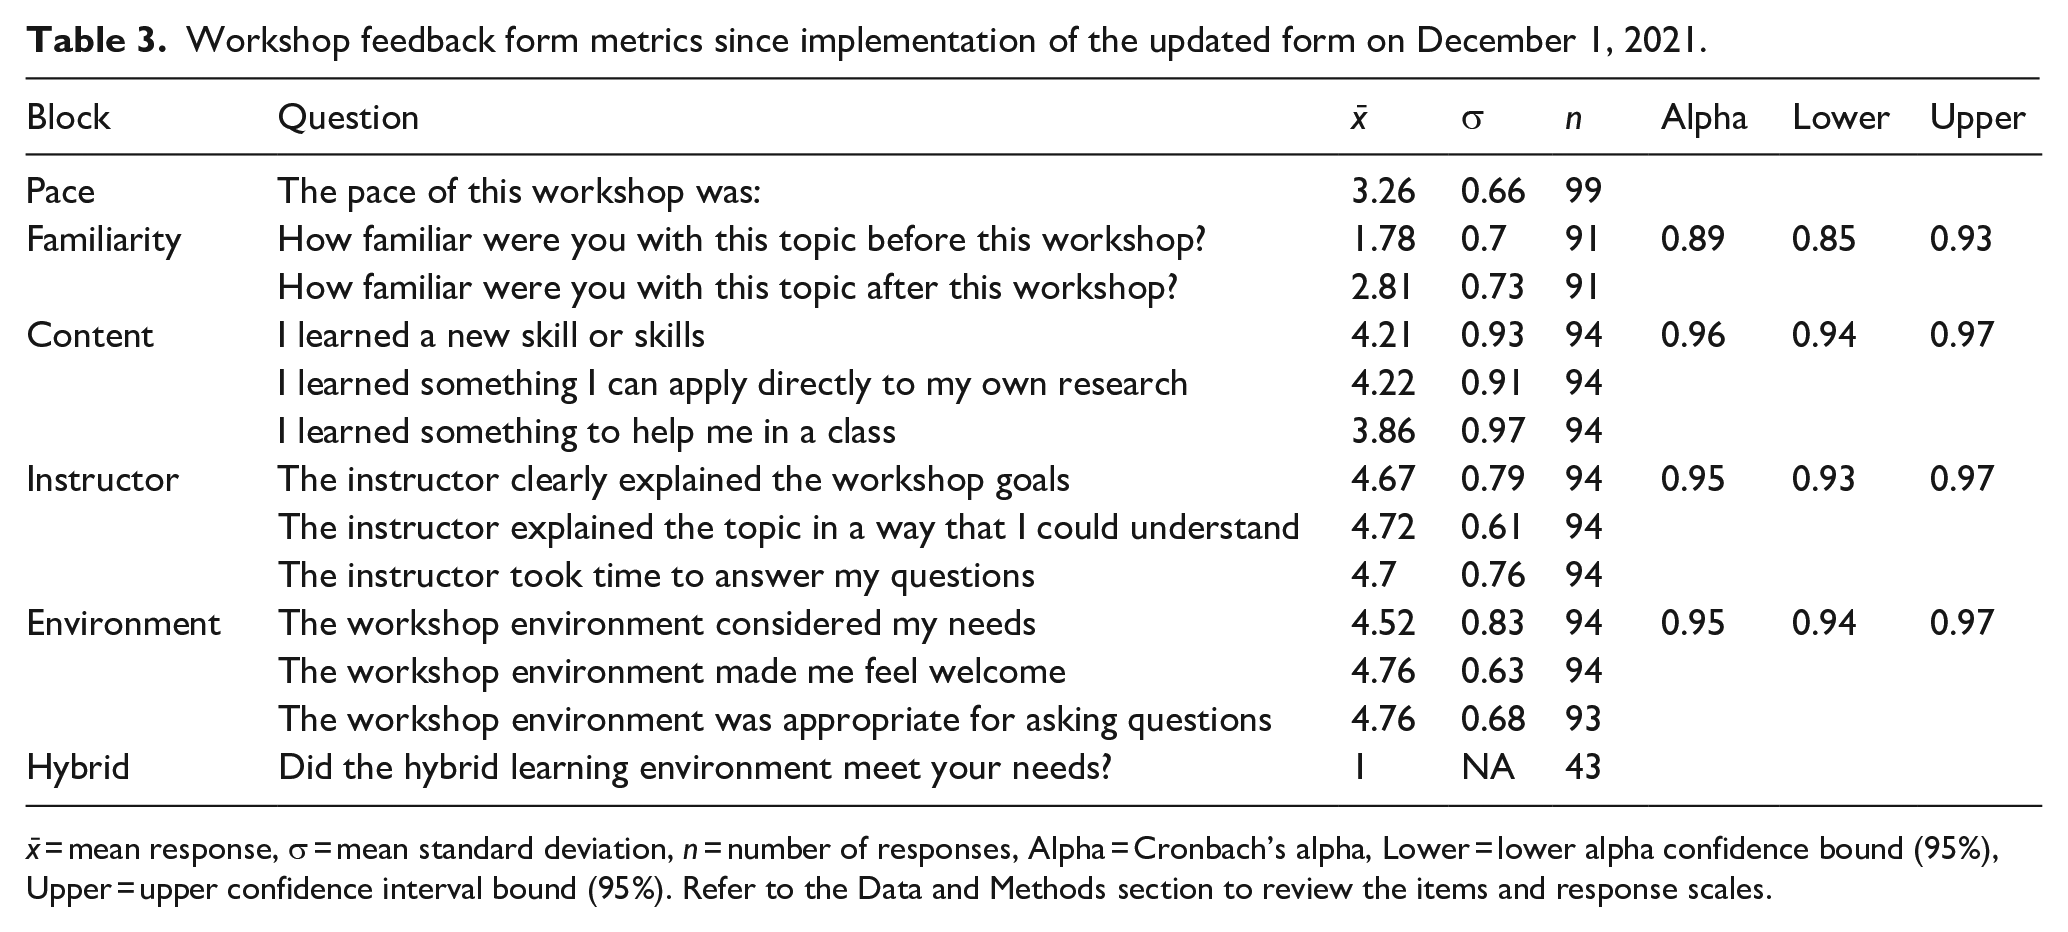
x̄ = mean response, σ = mean standard deviation, n = number of responses, Alpha = Cronbach’s alpha, Lower = lower alpha confidence bound (95%), Upper = upper confidence interval bound (95%). Refer to the Data and Methods section to review the items and response scales.
As of May 9, 2022, we report an additional 222 consultations and 223 participants (from 24 workshops; average of 9.33 participants per workshop), with 139 days remaining in the 2021–2022 academic year.
Discussion
The archival and data histories of SSDS presented here have demonstrated the far-reaching impacts that a computational research support unit housed in a university library can have on its researchers. Historically, fluctuations in participation are related to staffing availability, so that years with more staff can serve more researchers because they can potentially schedule more consultation hours and workshops, and bring with them more expertise. Graduate students are our main constituents, who undoubtedly are trying to gain research experience through completion of their theses, dissertations, and other projects in preparation for the job market. Despite rapid advances in computing power, data storage, and online learning, the challenges identified nearly 40 years ago still resonate with many researchers today. They still need to learn computers, software, programming languages, tools, and methods to acquire, preprocess, visualize, analyze, secure, and present data. However, as dataset sizes continue to grow at exponential rates, like the researchers in the early 1980s, today theywe still must navigate issues of inadequate memory, data transfer across systems, data storage, and utilization of remote computing solutions and their cost structures. Importantly, onboarding beginners to a programming language and teaching themlearning methods for visualization and analysis to accomplish research related tasks remainare in high demand, and training others through instruction and consultation remains and are equally as challenging.
SSDS’s service model uses workshops, consultations, and professional development opportunities to upskill and reskill our community by meeting researchers where they are at, removing barriers to entry, and democratizing the computational learning process in a way that helps individuals become self-learners on their own data literacy journeys.One of the most engaging aspects about using data literacy as a foundation for all of our interactions is how, in the hands of a competent instructor, consultant, or mentor, data skills can be shown to betransferrable to other topics, issues, and problems due to the contextual emphasis of accomplishing a specific task. Although interpretation of results depends on domain-specific knowledge (which takes time and a lot of close reading to acquire), learning the basic programmatic and theoretical tenets of how data are stored, accessed, wrangled, explored, visualized, and analyzed is arguably the most valuable and transferrable skills needed for the modern job market. This is absolutely necessary in the 21st Century, as sustainability science (Kates et al., 2001) is becoming a “new” major scientific focus to protect planet Earth and its inhabitants as neoliberal policies continue to decimate humanity and natural environments, particularly through devaluation of the lives of the most vulnerable populations. While it is challenging to interpret departmental breakdown because microlevel data are not available for all years and services, it is clear that SSDS has provided—and continues to provide—invaluable services for patrons from the Humanities and Sciences, the foundation of what is often referred to disparagingly as a “liberal arts education,” and ranges from the technification of disciplines ranging from Urban Studies to International Relations, to Languages and Theater and Performance Studies, and Chemistry, Biology and Statistics. This could also be interpreted to suggest that the Library does not inherently serve more or less “scientific” disciplines, but is a home to all since there are arguably technical barriers that must be overcome in data and the technological requirements to utilize data have permeated all disciplines and fields of study necessary for solving today’s most challenging problems.
Figure 1 shows that consultation and workshop numbers were generally stable from 1999 until 2011, when a variety of online learning platforms first launched: Khan Academy in 2008, Udemy in 2010, Udacity in 2011, Coursera and edX in 2012, and DataCamp in 2013, among others, that frequently offer basic coding skills training for free with more features and certifications available at cost. Importantly, Stack Overflow was also founded in 2008 and remains the world’s premier question and answer website for programming related questions, with the idea being that someone asks a question in the form of a reproducible example, the community can provide answers and comments, and the best answer gets upvoted as the accepted solution. Stack Overflow has become a ubiquitous part of the self-directed learning process, where it is generally acceptable protocol to search how to perform a data-related task to cobble together a solution to current task. This has interestingly caused Joni and Soloway’s (1986) assertion to come full circle again—that just because code works does not mean it is readable, interpretable, or that it provides the correct output. Thus, we then see a rebound in consulting and workshop numbers around 2017, perhaps as researchers began to realize difficulties of copy/paste learning and that they should still rely on communication with experts to get their questions fully answered. However, this rebound back to early-2000s numbers was upended by the COVID-19 global pandemic (The World University Rankings, n.d; DOE OCR, 2021; Godber and Atkins, 2021). Results for 2021–2022 might show signs of a return to pre-pandemic number but are incomplete at the time of this writing.
These trends speak to a few important points about community. First, we have understood that many people do not care for online learning when they know that they can experience the social, in-person aspects of learning as part of their tuition costs. Feedback indicates that these in-person, human interactions are invaluable for supporting researchers not just for their current problem or issue, but also for the many spin-off conversations that can be had. This often leads to professional development opportunities that might not otherwise be possible in terms of graduate school and job application coaching, networking, research paper acknowledgments and authorships, and interpersonal relationships. Second, remote learning is clearly here to stay and universities would be wise to invest sufficient funding in developing online learning programs, especially for computational support units within libraries. Many students are hesitant to rejoin in-person activities due to potential health concerns and unaffordable costs of living, transportation, and child care that can complicate attending events in-person. . One big challenge that remains is how to create new professional development experiences that tend to be more organic in in-person settings in online settings where engagement must still be built. Thus, these challenges present new opportunities for solving issues of learning in the modern world in ways that might exist outside of the traditional tuition structure, such as microcredential certifications, help with school and job applications, interview practice, and a host of other professional development opportunities that can augment regular, research-focused workshop and consultation sessions by placing research in its broader professional contexts.
Challenges and solutions for organizational data collection and use
Beyond challenges posed by funding, organizing, planning, coordinating and implementing services, and balance between in-person, online, and hybrid learning, computational research support units also face challenges for collecting basic data about those who use their services. This can help clarify who is being served and for what purposes and to also provide a data-driven perspective to identify old and new needs across campus and ensure that services remain cutting-edge. First, determining how data is to be collected can be a major point of confusion. It is therefore essential to streamline data ingestion points across services such as the organizational website, email addresses, Google and Qualtrics Forms, events webpages, paper forms, and other registration systems. These data run the risk of growing stale if they live in disparate locations that are not aggregated into a central location. A dedicated staff member must be responsible for the aggregation, analysis, and dissemination of results through reports and presentations to communicate the value of research support services. This person must also wrangle the challenges of potentially deduplicating and coalescing multiple ingestion points and create and follow protocols to prevent the loss of additional service metadata/contextual information. Like our own data, this can lead to issues of underrepresentation in the datasets and interpretation of the metrics that are reported out and acted upon. This missingness caused by failure to capture data can stem from many sources, including staff forgetting to distribute paper or electronic sign-in and feedback forms, forgetting to enter paper forms electronically, consultations that are scheduled through staff email addresses, etc. Additionally, the simple averaging method of workshop feedback scores might be less appropriate than something like a Rasch model for analyzing feedback (Wilson, 2004).
Second, there is also the issue of determining what counts as a consultation versus a contact. While a contact might be someone asking when a workshop will occur or how to sign up for a consultation, we determine a consultation to be anything that directly helps move a researcher’s project forward, even if done so through a brief informal conversation or email. It does not have to be a formal one-to-one consultation meeting nor is there a minimum time limit for it to count, as long as it legitimately solves a problem directly related to the research problem at hand. Third, advertising is a big challenge. People have said in the past things like “I just found out about SSDS! If I had known about your services, I could have finished my degree sooner and saved a year of student loans.” This is heartbreaking to hear and motivates us to keep finding creative ways to advertise our services and convey that our support services work and exist in non-judgmental and anti-bro-culture atmospheres. Finally, it is challenging to be consistent in the above points to produce an evolving community of practice. This can be accomplished through staff communications, trainings, and events. Library-adopted tools such as Slack and Springshare-powered LibCal have proved helpful for coordinating help during the COVID-19 pandemic, as coworking in the same space became impossible and calendars needed to be synced.
Solutions appear easy but are difficult to implement in practice. First, planning and organization of services should be kept as simple as possible. Service capacity should depend on the skills and availability of available staff and students to teach and consult. The further in advance that schedules can be set, the more regularly and widely they can be advertised and hopefully attended. Broad computational and data needs are difficult to understand but sending out a wide-ranging survey or talking to a few key faculty members could serve as well-informed start points; services can be matched if campus needs are otherwise known. Ingestion points for contacts, registration, and feedback should be minimal, ideally beginning through a single point such as a simple static website with one or minimal forms to track and store information in shared spreadsheets. Software such as Drupal, Qualtrics, Microsoft Outlook Mail, and Google Mail make it easy to track this information and send out automated reminders prior to workshops and consultations, and also afterward for feedback surveys. The administrator of these materials can track registration for workshops and assign consultations if they are not previously claimed by staff through a predetermined system. Staff can even protect their personal email addresses through use of a shared inbox for email replies if desired. Although paper signs posted on doors and in hallways might seem useful, they require manual updating and can easily cause confusion when they are forgotten about and information on websites and digital forms change.
Staff should be trained in minimal pedagogy for instruction and consulting. When possible, these pedagogies can be fundamentally shaped by university centers for teaching and learning, but the Carpentries offers essential foundational materials (https://carpentries.github.io/instructor-training/01-welcome/index.html). Exercises can include reading key pedagogical articles and book chapters and applying them to mock workshop instruction and consultation scenarios so that staff learn how to start a consultation or workshop, are able to provide an explanation of what services are available, clarify roles, expectations, and limits of services, spot the “gotcha!” moments, and generally improve social skills and how to think on one’s feet—all key aspects of success in academic settings. This professional development tends to develop naturally out of such training interactions and can help prepare students for co-consulting and team building, graduate school and job applications and interviews, and future success based on the wide-ranging applicability of these transferable and marketable skills.
Improving research starts with improving researchers
One approach to ensuring that patrons are learning when they visit SSDS is to shift the focus to an empathetic view of the researcher as a person. This will help you better understand the research question being asked. By getting to know the researcher a little bit, both in terms of their specific research interests and short- and long-term goals, we can contextualize the research problem in a more holistic way because we can identify a more productive start point. Oftentimes, a researcher thinks they need help with “Method X” because they have been told they need to learn about it without understanding why they need to learn it and without guidance for its application. Usually, basic questions to genuinely understand the research question and its context, the dataset, and the purpose of the software and methods can clarify the initial opaqueness. The consultee can then report back to their faculty advisor, supervisor, or lab group with feedback to catalyze more meaningful discussion and responsible research. This can also be used as a segue with faculty members and lab groups across campus to open higher-level dialog about specific research needs and custom trainings and consultations in newly forged third spaces where otherwise hesitant researchers can flourish by transcending traditional ideas of work and home in plain language and in terms of their own strengths and weaknesses (Gutiérrez, 2008). This can in turn lead to clearer ideas and greater confidence to plan for job searches and other professional development.
Many researchers contact us with little to no research experience but who want to execute immensely complex research objectives on large and complicated datasets using software and methods they are unfamiliar with, crammed within the confines of short time frames, and with the expectation that our organization will complete the majority of actual work for them. The fetishization of “artificial intelligence” is the most superfluous example of this. Most often than not, these researchers have no experience programming in languages such as Python or R and sometimes are not even familiar with essential spreadsheet programs such as Microsoft Excel and lack foundational knowledge about how to ask a research question, explore data, probability and statistics, data types and structures, distributions, sampling, estimation, or hypothesis testing. This speaks broadly to the mentorship void and lack of preparation students and young researchers receive combined with feeling the need to jump into buzzword projects without first understanding basic research principles and learning foundational research and statistical methods. If the consultee is open to the suggestion, we can then set them up on a path to basic literacy and make it clear we are happy to explore these topics with them at a future time and across multiple consultation sessions and workshop trainings. Unfortunately, the influx of third party vendors who seek to capitalize financially further contribute to misunderstandings of basic scientific principles by selling access to data and canned analyses for text analysis and machine learning that produce shortcut outcomes at the expense of these foundational research principles.
We recommend that computational research support organizations should start by focusing on the basics of software, tools, and methods to better address researchers as inherently creative individuals (Kelley and Kelley, 2013). There is often greater value for novice researchers if we can help identify and explain the different components of the general research process in terms that make sense to them, rather than just rushing to the fastest buzzwordy solution that is devoid of context. While there are scenarios where the fast solution is desired, like when helping more intermediate and advanced researchers, helping the novice situate their question in the broader context can provide information about how to: read and combine ideas to ask new and relevant research questions, formulate hypotheses, outline protocols for acquiring and preparing data, understand and develop statistical frameworks, visualize and test data, interpret results, and practice writing and presenting data and research. Different researchers come from different backgrounds, have different capacities for coding and levels of creativity, seek different goals, and learn in their own ways. This makes our ability to speak at their level perhaps the most important aspect of getting through to researchers who seek our help.
Researchers who are mentored in this manner often grasp these principles quickly, simply because nobody else has ever taken the time—or cared to—divide the research process into digestible chunks in postcolonial, individualized language. This usually means helping the researcher determine if their research design is justifiable and can stand up to questioning by a committee member or peer-reviewer, and then helping them understand their data using the most basic vocabulary terms and jargon in scaffolded ways. From there, data exploration often provides the researcher with “Aha!” moments that might be revealed through descriptive statistics, visualizations, and basic tests. Through this process, it becomes simple (but not necessarily easy) to demonstrate how this rationale could then be applied to the next phase of the project, which could be slightly more complex and utilize intermediate/advanced methods of computational text analysis and machine learning, for example. This approach proves that a research outcome can be greater than the sum of its parts because it becomes about helping the researcher better understand the generated results, within the scope of their own knowledge and skill set, and to set them on the path to autodidactic and transferrable learning. All of this is time-consuming and requires funding that universities would be wise to invest in sooner than later as tuition rises exponentially, and student learning experiences are arguably diluted. The 4-year cost of college is expected to cost more than $200,000 for in-state public college in the year 2039, or around a tuition increase of about 5% per year (College Cost Calculator, www.collegeboard.com). Not learning basic research skills will continue to dissuade enrollment when so many online courses, bootcamps, and data science influencers offer cheaper (or free) alternatives in part to spite higher education’s slow pace of change.
Practicing inclusion
One thing that many academics fail to realize is that the key to helping researchers succeed is to understand that it is not about gatekeeping or increasing barriers to research or showing off one’s own knowledge, but rather using every opportunity to use practical language and examples to help build mental models, discuss cognitive load management and visual learning strategies to internalize knowledge, help the novice understand the outcomes of their research question, how to find help, and learning works in general. Universities exhibit blissful/willful ignorance around issues that plague many of their programs and should be required to teach diversity training (Caldwell, 1996; Devine and Ash, 2022; Gay, 2000; Ladson-Billings, 1994) with a focus on shifting cultures toward anti-racist (Ash et al., 2020; Fritzgerald and Rice, 2020) and anti-gender bias (Carnes et al., 2015) attitudes and language.
Success in research depends on many things, but if we are to truly use our own success to open doors to novice researchers—instead of close them—we must understand how sense of belonging (Chen et al., 2021; Murphy et al., 2020; Walton and Cohen, 2007), stereotype threat (Aronson et al., 2002; Spencer et al., 1999), and social identity threat (Hernandez et al., 2021; Martiny and Nikitin, 2019; Stephens et al., 2015) undeniably impact engagement and manifestation of impostor syndrome (Canning et al., 2020) and thus impact motivation for science inquiry that can shape science identity (Hazari et al., 2013) and ultimately, positive outcomes that can be used to catalyze the building of science capital (DeWitt et al., 2016) and help close the achievement gap (Harackiewicz et al., 2016). This can be accomplished through (near) peer instruction and mentorship (Aikens et al., 2017; Balta et al., 2017; Destin et al., 2018; Evans and Cuffe, 2009; Schell and Butler, 2018; von Vacano et al., 2022) in spaces where negative personal judgment and ad hominems are unacceptable. We also must work to eliminate cultures of bullying, especially those perpetrated by staff supervisors and peers who promote the idea of safe spaces while simultaneously making them unsafe for many due to the self-aggrandizing attitudes they promote.
Finally worth reemphasizing to ourselves and the researchers we train is that we do not live in a post-fact world. But, facts are different from evidence of an assertion, a claim well-summarized in the response by J. Dirk Nies, Ph.D (Executive Director, Floriescence Institute in Crozet, Virginia) to Jureidini and McHenry’s (2022) exposé “The illusion of evidence based medicine” (https://www.bmj.com/content/376/bmj.o702/rapid-responses). Dr. Nies succinctly explained several crises in medical research pertaining to the erosion of scientific rigor, but that could also be extended to understanding the perspectives that students and novice researchers bring with them. There are many parallels with rushed academic research that is not properly designed, theoretically framed, and that utilizes poorly understood methods:
A fact is an occurrence in the real world. A thing that is indisputably the case. Something that has actual existence. A truth verifiable from experience or observation. Evidence is an assembly of facts indicating whether a belief or proposition is true or false. Evidence is always gathered and presented either in support of or in opposition to an assertion. Notice the distinction. Facts have no purpose or agenda associated with them. Evidence always does. Furthermore, evidence always considers relevance. Evidence is an intentionally selected subset of all available facts chosen because they are deemed relevant to determining the validity of an assertion. And therein lies the rub. Who determines what the assertion is? And who determines which facts are considered relevant? As a scientist, I seek solid data to guide my personal choices. . .
As we help the researchers we serve solve today’s most challenging problems, we must teach these researchers how to know about data, how it is presented, how to critique it, and how to interpret it in the context of its contextual assertion. That is, in many instances we must also help researchers with how to formulate an assertion and teach them to understand evidence both for and against that assertion; not simply the evidence that supports the argument being made. Every researcher is unique, and we must realize that one-size-fits-all approaches to teaching, consulting, and mentoring are no longer valid approaches because they often fail to teach students how to match an assertion to the evidence presented within a critical framework.
Evidence must still be presented in a manner where researchers understand the process and apply methods responsibly based on a basic understanding of their principles. While the shortcuts are there—and can often be helpful—computational research support units should help researchers understand the processes that are used to find an answer based on the motivations of the assertion and evidence in ways that they can understand. Although the goal is to make difficult problems easier to comprehend, applying such techniques should never be presented as “magical” and the researcher needs to understand the moving parts well enough to explain them to different audiences; to use plain language with public audiences, but to use the jargon with other professionals when necessary. Additionally, we must warn young researchers about applying techniques that they do not understand, which can help them be more self-reflective of their own work (and critical of the literature they read) and identify steps for proceeding in their own technical development. Overly complicated and poorly understood and explained statistical frameworks and representations are not always best and should never be substitutes for basic statistical reasoning paradigms (Box et al., 1994; Donoho, 2017; Kass, 2021; Kass et al., 2005; NASEM, 2017; Thompson, 2001; Tukey, 1977; Velleman and Hoaglin, 2012). This is particularly challenging in the era of data monetization and as higher education continues down its path of extreme neoliberal commercialization. It is up to us to continue to democratize data literacy and technological preparation for every single patron that we serve as we train the next generation of data visualizers, text analyzers, and machine learners in the social sciences and humanities – and beyond.
Footnotes
Acknowledgements
The authors thank Mike Keller and Dr. Matt Marostica for helping steer the direction of SSDS over the past decade of its existence, along with the countless community members dating back to the 1970s who laid the groundwork for us all. We are especially grateful to the many graduate student consultants and instructors who have provided the time, effort, and spirit for supporting computational research efforts at Stanford. We also thank Dr. Diana Pacheco for consultation on the qualitative analysis, and two anonymous reviewers that helped significantly improve the quality of the manuscript.
Funding
The author(s) received no financial support for the research, authorship, and/or publication of this article.