
Abstract
Based on a literature review, we present a framework for structuring the application of graph theory in the library domain. Our goal is to provide both researchers and libraries with a standard tool to classify scientific work, at the same time allowing for the identification of previously underrepresented areas where future research might be productive. To achieve this, we compile graph theoretical approaches from the literature to consolidate the components of our framework on a solid basis. The extendable framework consists of multiple facets grouped into five categories whose elements can be arbitrarily combined. Libraries can benefit from these facets by using them as a point of reference for the (meta)data they offer. Further work on formally defining the framework’s categories as well as on integration of other graph-related research areas not discussed in this article (e.g. knowledge graphs) would be desirable and helpful in the future.
Introduction
Although libraries collected vast amounts of (meta)data over the last centuries, only a few aspects of these data are commonly used in research. Instead, other data providers such as Web of Science (Birkle et al., 2020), Scopus (Baas et al., 2020), Dimensions (Herzog et al., 2020), Microsoft Academic Graph (Wang et al., 2020), Crossref (Hendricks et al., 2020), and OpenCitations (Peroni and Shotton, 2020) are regularly the source of (meta)data about scientific publications and research in general; citations and collaborations are two well-studied and famous examples. However, this leads to a situation where researchers focus on easily available data and their characteristics, missing opportunities to study other valuable and extensive sources such as library catalogs.
The growing interest in network studies since the early 2000s (Molontay and Nagy, 2019) created a large body of literature that uses network analysis techniques to study real-world data and phenomena. A variety of data sources were modeled as graphs, their characteristics described and compared. Bibliographic data such as keywords, citations, or collaboration information were investigated in numerous studies and projects. Graph modeling and analysis is still an emerging research topic.
Keeping track of research areas, topics, and developments in the context of network studies is a challenge. However, libraries should be able to understand research topics and needs in order to provide and compile useful data sets that can subsequently be used in network studies. This is especially the case since data from library catalogs contain vast amounts of intellectually compiled information not only about publications themselves, but also about the history of publishing, collection management, and resource description (Lahti et al., 2019). If libraries opened up their databases to network science as many of them did in the context of linked data (Suominen and Hyvönen, 2017), the scope of previous studies—mainly focused on citations, collaborations, and co-word analysis—could be broadened. We think it is essential that libraries become clear about the value and characteristics of the metadata resources they provide. Network analysis on bibliographic data from, for example, library catalogs is a central part of this process. The application of network analysis on metadata can help with data assessment, improvement, and enhancement. By this, further research objectives based on a solid data basis become eventually possible for researchers who seek to explore the manifold characteristics of bibliographic data from (academic) research libraries.
Since network studies usually use mathematical concepts derived from formal graph theory, it seems reasonable to take this mathematical viewpoint as a basis for describing research in this area. Moreover, a formal foundation of data used for graph modeling is helpful in developing standardized data workflows. These considerations are the starting point of the investigations presented in this article.
Based on a literature review, we present a framework for structuring the application of graph theory in the library domain. Our goal is to provide researchers—primarily from library and information science—with a standard tool to classify their work in this area. At the same time, our framework allows for the identification of previously underrepresented areas where future research might be productive. To achieve this, we compile graph theoretical approaches from the literature to consolidate the components of our framework on a solid mathematical basis.
The framework consists of multiple facets grouped into several categories whose elements can be arbitrarily combined. The combination of these facets as a whole is capable of describing studies that apply concepts from graph theory in the library context. This framework can also serve as a basis for developing a more detailed taxonomy that is able to represent knowledge in the fast growing area of graph technologies in libraries.
The contributions of this article are as follows: (1) summarizing and structuring the application of graph theory in the library domain based on a literature review, (2) introducing a framework for describing research in this field, (3) providing a basis for the definition and comparison of network types, and thus (4) allowing for discovery of areas not yet intensely studied.
In the following section, we first define the scope of this article. We then briefly describe the already existing work that deals with structuring and summarizing the use of graphs in the library domain in the section “Related work.” In the section “Graphs and networks in the library domain,” we give a literature overview by approaching the field under consideration from different perspectives, that is, by exploring data, sources, methods, and objectives of previous research studies. Eventually, we develop our framework in section “A framework for the application of graph theory in the library domain” and show how it can be used to classify research studies afterward. We conclude with a discussion of benefits from using our framework and a reflection on possible future enhancements.
To keep our investigation useful for a wider audience in the library and information science sector, we refrain from defining the introduced concepts in a strictly formal manner. Most of the concepts can be defined mathematically by using basic principles from common graph theory.
Scope
In this article, we understand graph theory as the application of graph theoretical concepts—derived from a formal mathematical perspective—on resources closely related to libraries. Primarily, this includes (meta)data administered under the aegis of institutions that consider themselves belonging to the library domain: catalogs, repositories, document databases, and so on—although, as we will show, other data can also be modeled as graph.
In other words, studies that model, describe, and examine these data using formal methods based in graph theory are in the scope of our investigation. This specification excludes, among others, cases where library data are solely described using terms from graph theory without referring to a mathematical fundament or where network visualization is the main focus of the study (e.g. in Kutlay et al., 2020). Note that we do not strictly distinguish between “graphs” and “networks” in this article because both expressions are often used interchangeably. We understand the term “graph” as to represent rather mathematical and technical aspects whereas “network” often refers to the structure and characteristics of data, but there is a lot of overlap between the scopes of these two terms.
We do explicitly not consider studies related to the following research areas: knowledge representation (usually in the form of so-called knowledge graphs), recommender systems, visualization, and graph data mining. Each of these topics embraces an extensive body of research literature that has relations to many different fields such as mathematics, computational studies, or economics. Although especially knowledge representation and recommender systems are applied in the library context already in many cases, studies focusing on these systems have a high granularity of topics, data sources, and methods. We do not think that these elaborated and highly dynamic research fields can be sufficiently represented in our framework yet and hence exclude these topics from our investigation. In addition, existing reviews of the use of knowledge graphs in the library domain use approaches to classifying research in this area that are different from the basic approach we use in this study (Georgieva-Trifonova et al., 2019; Haslhofer et al., 2018; Ji et al., 2015). Research on data visualization does not primarily focus on the modeling of data itself and is also excluded. However, we think that future attempts to structure the area of graph technological research might succeed in integrating these fields into our framework. We therefore construct our framework in a faceted way which allows for adding other research fields, directions, and topics in the future.
Related work
To the best of our knowledge, no comprehensive survey of the application of graph technologies in the library domain exists yet. Short synopses are given in several papers, single aspects are covered in dedicated studies and permit a first view on the structure of this field—for example, recommender systems (Bai et al., 2019; Bobadilla et al., 2013), citation networks (Petri et al., 2014), co-authorship networks (Kumar, 2015), knowledge graphs (Ji et al., 2015) in the library and digital humanities domain (Haslhofer et al., 2018), academic social networks (ASNs; Kong et al., 2019), and scholarly networks analysis (Yan and Ding, 2014)—but no dedicated overview of the application of graph theoretical techniques in the library domain can be found.
Kraft et al. (1991) give a superficial overview of graph theory in libraries. Powell et al. (2011) and Powell and Hopkins (2015) specify use cases in which concepts from graph theory are or could be applied to library data, focussing on citation, co-author, subject-author, and usage data. However, they give only a brief overview and do not go into detail nor construct a differentiated classification scheme, but examples for the use of graphs as tools in the library context (e.g. for author name disambiguation) are mentioned.
An extensive review of network structures, properties, measures, and mathematical modeling was conducted by Newman (2003). Newman classifies network structures into “social networks,” “information networks,” “technological networks,” and “biological networks,” which, for our purpose, is too vague and not specific to the library context. A framework for scholarly networks was presented by Yan and Ding (2012, 2014). Albeit these networks make up a noteworthy fraction of the use of graph technology in the library sector, this framework is also not extensive enough for our intention. Yan and Ding’s work is a good starting point for our study, though.
Graphs and networks in the library domain
In this section, we conduct a literature review to carve out main aspects of graph-related research in the library domain. These aspects will serve as foundation for the construction of our framework in the next section. We used especially the databases and search capabilities from Dimensions (Herzog et al., 2020), Library and Information Science Abstracts (LISA), 1 Google Scholar, and Lens.org. Our search was based on the keywords graph theory, network/graph, network science, network studies, library, library domain/context, (bibliographic) (meta)data, catalog, metadata, and multiple combinations thereof, to be as extensive as possible although it can never be guaranteed to find all relevant publications. Result sets were investigated manually and for each relevant resource found, the Reference section was considered to find more related literature.
We structure our review according to similar overviews (as given, for example, in Kong et al., 2019; Yan and Ding, 2014), starting with the presumably most prominent types of networks: citation and collaboration networks. In the course of the review, we further account for rather niche use cases where graph theory is applied in the library context. We will see that the following structure is primarily aligned with the data basis used for network/graph modeling. However, after we develop our framework, we will see that other feasible perspectives are just as beneficial.
Citation networks
Most of graph-related research uses either citation or authorship networks and thus can be related to the broad area of bibliometrics/scientometrics (Osareh, 1996a, 1996b). Early work by Garfield (1955) on citation indexes was the basis for a rapidly growing body of literature, leading to different techniques such as “bibliographic coupling” (Kessler, 1963) and the influential study by De Solla Price (1965).
Citation data are used in these early studies exclusively but the concept of linking data and focusing on their relationships is already coined and generalized as “literature network” (Tukey, 1962) which also encompasses relationships based on subject indexing (De Solla Price, 1965). Technically, citation networks are directed graphs, allowing for appropriate graph analysis techniques. Comparisons between different definitions of “relatedness” (Kessler, 1965) as well as extended measures like “co-citation” by Small (1973) were established in the following years. Formal definitions are rarely given, though, with Small (1973) being a mentionable exception since here a formal definition of “co-citation” is given at least in a footnote.
While Garfield began to develop citation indexing as a system for information retrieval (Garfield, 2006), focus of early research became mostly clustering and mapping of scientific literature (Griffith et al., 1974) using either documents or authors (or collections of their work as representative) with citation relations between them (White and Griffith, 1981). Over time, research objectives were augmented and results from citation analysis were often understood and used as science indicators, for example, when trying to find “research fronts” (De Solla Price, 1965) or “invisible colleges” (Crane, 1969; De Solla Price, 1963). The usefulness of these approaches was reviewed (Leydesdorff, 1987; Weinberg, 1974), criticized (Hicks, 1987; King, 1987), evaluated statistically (Oberski, 1988; Shaw, 1985; Sullivan et al., 1977), and confronted with word analysis (Braam et al., 1991a). Later, combinations of citation, co-citation, and bibliographic coupling were formalized using set theory (Persson and Beckmann, 1995) and citation networks were analyzed concerning also the context and content of citations (Hargens, 2000; Jeong et al., 2014).
The emerging interest in network science and the World Wide Web in the late 1990s (Watts, 2004) led to a more thorough examination of (mathematical) network properties (An et al., 2002; Egghe and Rousseau, 2002; Yong and Rousseau, 2001) and the transfer of the idea of co-citation to web documents (Prime-Claverie et al., 2004). Approaches to (co-)citation were combined with bibliometrics, network analysis, textual information, and author collaboration, (Ding, 2011; Ganguly and Pudi, 2017; Lim and Buntine, 2014, 2016) evaluated (Boyack and Klavans, 2010; Leydesdorff and Vaughan, 2006; Lu and Wolfram, 2012) and used in varying areas such as recommender systems (Habib and Afzal, 2017; Küçüktunç et al., 2012), journal ranking (Kalaitzidakis et al., 2003), and classification (Leydesdorff, 2004).
Increasingly, (co-)citation as an appropriate method for building science and literature graphs became commonly accepted (Radicchi et al., 2012) so that emphasis was placed on network metrics of these graphs in different domains (Brughmans, 2013; Caschili et al., 2014; Ji and Jin, 2016; Popp et al., 2018; Wei et al., 2015) and for a variety of use cases such as author name disambiguation (Schulz et al., 2014), comparing data providers (Šubelj et al., 2014), subject indexing (Wei et al., 2015), research trend detection (Asatani et al., 2018; Cabeza Ramírez et al., 2019; Hosseini et al., 2018; Kleminski et al., 2020), systematic reviews (Xu and Kajikawa, 2018), science mapping (Ferreira, 2018), journal citation networks (Leydesdorff et al., 2018), and information retrieval (Eto, 2019; Petri et al., 2014).
Since the (mathematical) concepts underlying these studies are well-known for decades (De Solla Price, 1965; Garner, 1967; Small, 1978), most studies do not make explicit the graph theoretical background of their data; however, network properties and metrics (where more innovation takes place) are usually specified formally. In addition, even though the data these studies use usually come from library catalogs, databases, and the like, it is not fundamentally clarified from a library perspective how these data should and can be represented to make it as useful as possible for this type of research. For instance, library catalogs often do not contain information about citations—for example, when it comes to books, not journal articles—or documents are not available in full text which makes these data hardly useful for many applications and methods (Brughmans, 2013). Even if we consider that library catalogs are usually not constructed to hold these additional data, this omission leads to a situation where research on bibliographic data is forced and constrained to the use of other databases (Zhu and Liu, 2020) that are often restricted to certain types of resources, for example, journal articles.
Collaboration networks
While the relatedness between two documents or authors in terms of citations usually indicates some kind of content or research similarity, author networks not based on citations can rely on a variety of relationships, for example, collaboration, affiliation, geographical closeness, or other forms of (in)formal communication (Crawford, 1971); although, as White et al. (2004) pointed out, a lot of implicit communication structure can also be assessed from the nature of citations. Hence, the study of author networks—gaining momentum during the 1960s—mainly arose from fields such as communication studies, sociology, and statistics (De Solla Price and Beaver, 1966) building on theories of social network analysis (see Scott, 1988, for a comprehensive description of social network analysis development). Goffman (1969) introduced the famous Erdős number that can be understood as distance in the Paul Erdős collaboration network.
The growth of collaboration networks has been characterized as a result of increasing professionalization over the centuries (Beaver and Rosen, 1978, 1979a, 1979b). Structures of collaboration/communicaton were found to be consistent throughout multiple disciplines or research types (Griffith and Mullins, 1972), and especially co-authorship was assumed to play a significant role in the understanding of complex author networks (Logan and Shaw, 1987). Several types of collaboration were identified and discussed (Subramanyam, 1983).
During the 1980s and 1990s, collaboration research focused on “science networking” (Andersson and Persson, 1993) and the growth of collaboration among nations, continents, and single research institutions (Melin and Persson, 1996). Moreover, the role of co-authorship as a measure for collaboration was questioned (Katz and Martin, 1997) while more elaborated mathematical applications were developed (Scott, 1988).
Concepts such as “co-author graph” and “communication-graph” were introduced formally and described, for example, as “labeled multigraph which is typically disconnected” (Shaw, 1983). Albeit most studies related to collaboration networks used statistical methods and thus were well-grounded on mathematical concepts, the modeling of collaboration networks using graph theory was the exception; often, graph structures were only implicitly present (Luukkonen et al., 1993).
Newman (2001d) published his seminal paper about the structure of scientific collaboration networks where these networks were described as “small worlds” (Milgram, 1967) and investigated using network analysis (Newman, 2001b, 2001c). Although concepts and ideas in this article were not entirely new—for example, the idea of “preferential attachment” (De Solla Price, 1976; Newman, 2001a)—it was the first application of (social) network analysis to a considerably large real-world data set and paved the way for numerous follow-up studies (Newman, 2004a, 2004b; Newman and Girvan, 2004). During this time, network science became a popular research field (Otte and Rousseau, 2002) not only due to the World Wide Web (Albert et al., 1999; Faloutsos et al., 1999) but also because important papers in network theory were published (Molontay and Nagy, 2019)—concerning “small-world” networks (Watts and Strogatz, 1998), scale-free networks (Barabási and Albert, 1999), and community structures (Girvan and Newman, 2002)—whose methods were, in turn, applied to social (collaboration) networks (Barabási et al., 2002; Grossman, 2002; Newman et al., 2002). Scientific collaboration networks were described in terms of self-organization (Ramasco et al., 2004; Wagner and Leydesdorff, 2005).
Studies on the relationship between collaboration and co-authorship (Ioannidis, 2008; Laudel, 2002), collaboration stuctures in different domains (Calero et al., 2007; Liu et al., 2005; Moody, 2004), network measures (Liu et al., 2005; Newman, 2006) as well as discussions of issues related to the construction and investigation of such networks (De Stefano et al., 2011) deepened the understanding of this research area. As research became more differentiated, collaboration networks were brought together with other representations of documents, authors, and research papers (Hou et al., 2008; Jung, 2015; Onel et al., 2011). Dynamic networks and the effects of manipulating network measures, for example, by disambiguating author names (Fegley and Torvik, 2013), were studied (Ebadi and Schiffauerova, 2015). Simultaneously, the application of network models for a variety of domains (Ji and Jin, 2016; Metz and Jäckle, 2017; Pisanski and Pisanski, 2019; Popp et al., 2018) and data sets (Chen et al., 2017) continued.
Recently, the introduction of more elaborate concepts such as multilayer networks (Boccaletti et al., 2014; Kivela et al., 2014; Zingg et al., 2020), hypergraphs (Ouvrard et al., 2017, 2018), and combinations thereof (Vasilyeva et al., 2021) supplements the view on complex networks (Boccaletti et al., 2006) and calls for new analysis methods (Fezzeh et al., 2021; Pisanski et al., 2020).
Content networks
A third type of network is treated more infrequently in scientific literature than citation or collaboration networks although it appears that this type is the most “natural” when it comes to defining relatedness between research objects. We call those networks “content networks” where representations of actual (textual) content—that is, keywords, topics, full-texts—are used for network modeling without making a detour via indirect dependencies such as citations or bibliographic coupling. Relations in a content network are usually undirected and based on similarity, hence combining attributes from both citation and collaboration networks.
These networks are of particular interest from a library perspective because, other than for the recording of citations or co-authorship, (meta)data about resource contents can be highly influenced by libraries, for example, by careful subject indexing.
First experiments that took advantage of representing documents and their terms as graphs had the goal of automatically generating thesauri for information retrieval systems (Augustson and Minker, 1970a) by finding clusters, that is, maximal complete subgraphs, of terms (Augustson and Minker, 1970b). These experiments were based on quantitative associations between index terms (e.g. taken from Library of Congress Subject Headings in Gotlieb and Kumar, 1968) using different measures of associativity that sometimes already respected citations (Salton, 1963) to improve retrieval systems (Lesk, 1969).
In the mid-1980s, the co-word analysis technique was proposed (Callon et al., 1986). Although relationship between words was the central subject of these studies, the application of graph theoretical methods or network measures remained uncommon. Primarily, statistical methods and approaches were used. Comparisons between using titles or keywords for co-word analysis (Whittaker et al., 1989) as well as clusters in word networks (Callon et al., 1991) were studied. Research was often driven by finding a way to describe the development of the sciences (Leydesdorff, 1996) or mapping the structure of scientific research (Callon et al., 1983), already mentioning the importance of dynamic analyses and “complex series of interactions which are typical of the network of innovation” (Callon et al., 1991).
(Co-)word analysis was used separately (Cambrosio et al., 1993), combined (Braam et al., 1991a, 1991b), and contrasted with co-citation (Callon et al., 1983) and authorship networks (Wouters and Leydesdorff, 1994). It was also criticized because it was found that words and their co-occurrences—that is, nodes and links of the co-word network—change over time, and what counts as a node or link, respectively, varies according to different theoretical perspectives (Leydesdorff, 1996).
It was supposed that studying the co-appearance of subject headings (i.e. keywords) assigned to articles in a journal could describe the content of this journal (Todorov, 1992). Graph structures were used only implicitly in this study, but a note on different similarity measures between articles already gives an idea of different possibilities to define links in a graph. (See also Kostoff, 1993, and He, 1999, on the development of co-word analysis up to the 1990s.)
Co-word analysis was still used in the 2000s (Ding et al., 2001; Liu et al., 2012; van Meter et al., 2004), for example, in document retrieval (Hui and Fong, 2004). But, with the advent of the World Wide Web and full text search engines, was outperformed by graph-oriented (Schenker et al., 2003) and vector models. Elaborated concepts such as conceptual graphs (Chein and Mugnier, 2008) or the semantic web (Berners-Lee et al., 2001) became prominent so that research on building networks by linking content parts (words, sentences, etc.) became deteriorated. However, approaches to combine word analysis and graph theory, first started in the 1980s (Courtial, 1986), can still be found (Polanco, 2005), occasionally applied to “meta-content” such as thesauri (Agirre et al., 2010).
Kostoff (2008) introduced Literature-Related Discovery as a means of linking concepts from literature that have not been linked before, which can also be interpreted in terms of graph theory (Sebastian et al., 2017b). Literature-Related Discovery encompasses the older concept of literature-based discovery (LBD) (Sebastian, 2017; Sebastian et al., 2017a; Swanson, 1986). Moreover, document content from citation networks can be the basis for entity networks representing relationships for knowledge units such as drugs (Ding et al., 2013). As it is the case for citation (Kim and Barnett, 2008) and collaboration networks (Ding, 2011), keyword-based bibliometric analyses and social network analysis were also combined in multiple studies (Bodlaj and Batagelj, 2014; Hu et al., 2013; Su and Lee, 2010), for example, to create complex co-keyword networks and keywords co-occurrence networks (Cheng et al., 2018; Kastrin et al., 2014; Li et al., 2016). Yet recently, subject headings are still used separately for mapping science (Shu et al., 2017), to detect journal similarity (Yan and Chien, 2021) or in combination with co-citation and other metrics (Cabeza Ramrez et al., 2019). Due to the establishment of network analysis on content networks, their characteristics are now studied intensely (Tang et al., 2020) in multiple fields (Wang, 2018) together with other state-of-the-art techniques such as topic models (Leydesdorff and Nerghes, 2017).
Library networks
A rather different kind of graph theory use in the library domain is the construction and analysis of library networks. In this category, we put both (physical) networks of library buildings (or parts thereof) and (virtual) networks of libraries as institutions, for example, concerning their services such as inter-library loan. Contrary to the aforementioned types of networks, bibliographic data are not used in these studies because the library itself is the entity under consideration. In other words, the nodes in a library network are libraries themselves whereas edges between nodes represent relations between libraries, for example, inter-library collaborations.
In the 1960s, the Library Network Analysis Theory (Lib-NAT) project (Duggan, 1971) looked at library networks from different views and acquired knowledge about purposeful and meaningful network design. Findings were presented on the Conference on Library Networks (Carnovsky, 1969). Networks were understood as “simply an extension of good reference services” that are “no longer limited to one collection” (Duggan, 1969). Twelve critical components—for example, identification of nodes and primary patron groups, establishment of a bi-directional communication system—were identified, which illustrated the complex nature of such networks. Network configurations were judged according to number of links in the network or the borrowing: lending ratio of single libraries, among others. A mathematical description of library networks was also developed during the project (Nance, 1970) which was generalized to a general network model (see Korfhage et al., 1972, where a revealing paragraph on the purpose of mathematical models is included).
In the mid-1970s, Rouse et al. (1974, 1975), Rouse and Rouse (1976), and Rouse (1976) developed further the mathematical concept of library networks, provided a model for the analysis of such networks (Rouse and Rouse, 1975, 1980), and assessed the use of computer technology in them (Rouse and Rouse, 1977). This led to a broader view on mathematical modeling of library systems (Rouse, 1979).
In the following years, although studies on library networks were still conducted (Hatvany, 1981; Martin, 1987; Mount, 1988; Schuman, 1987; Turock, 1986), mathematical interest in these networks declined. New technological possibilities and the widespread use of computers led to an increasing number of library cooperations and thus networks, even more simplified by the introduction of the World Wide Web in the 1990s. Kraft et al. (1991) mention library networks as one use case for the application of graph theory in libraries.
Library networks can be seen as a type of information network. However, this term is used and defined in various ways—for example, in human interaction (Saez-Trumper et al., 2012), cell biology (Hennighausen and Robinson, 2005), information theory (Harvey et al., 2006), and by Newman (2003) in the context of complex networks—so we consider it too broad for our purpose. There is a suitable definition of information networks that can be used in the library context (Nance et al., 1972), though. It might be possible to get a more concise definition of information networks in the future by using our framework, for example, to describe these networks on the basis of their characteristics (as done in Chung, 2010).
A quite unique problem that was studied using graph theory in the past and that can be classified as library network is the construction of library facilities (Seppänen and Moore, 1970). Graph theory was used to reach a consensus on library usage between different user types (students, library staff, instructors) (Foulds and Tran, 1986).
Metadata record networks
In this group, we subsume different approaches that make use of metadata records, predominantly in the form of library catalog data sets. Indeed, many of the studies mentioned in the previous categories used metadata records somehow—however, this category should serve as a demonstration that we can also find scientific studies that decide to look at metadata records per se, not only at a particular part (citations, authorship, etc.) of it. This is often accomplished by representing records or items as nodes in a graph (as opposed to authors, keywords, etc. as nodes). Yet, since a relationship between metadata records needs to be defined based on certain attributes of these records, boundaries between this group and others are fluid. Especially in citation networks, we also find full documents (or their surrogates) as nodes. The use of metadata records for gaining insights into the structure, quality, and quantity of data sets can also be interpreted in terms of the recently introduced concept of bibliographic data science (Lahti et al., 2019).
Not many studies that belong into this group can be found. One example is two conference contributions by Neugebauer et al. (2015) and Neugebauer (2017), respectively, in which network modeling of metadata records from a repository for contemporary visual arts publications, connected through authors, artists, publishers, keywords, and so on, helped with explorative data modeling and analysis. In a study by Vorndran (2018), clustering based on network modeling of metadata records was used to assort different editions or translations of a single work. In addition, to achieve better standardization and subject indexing, subject headings, classification information, and links to authority records can be shared among data sets in the same cluster.
Recently, Phillips et al. (2019) introduced the notion of metadata record graphs. Although the idea behind linking metadata records is not new, the explicit denomination of this type of graph allows for a more specific analysis of metadata records themselves from a library perspective. That is, the difference to other types of networks as described above does not consist in a different sort of data used for building these but rather in the objective or perspective of the data modeling. Based on this different angle of view, other network features, structures, measures, and characteristics are of interest, for example, metadata quality evaluation and augmentation (Phillips et al., 2020b). In metadata record graphs, records can be connected through a variety of data values and fields, for example, keywords (Phillips et al., 2020a). This recent field of study thus also demonstrates the challenge of integrating different approaches to network modeling with the goal of harmonizing citations, contents, authorship information, among others. By this, a sound, more global perspective on the data can be achieved.
A framework for the application of graph theory in the library domain
After this comprehensive review, we justify and demonstrate our framework in the following section. Technically, we (1) recapitulate existing frameworks and classification schemes, (2) explain our framework principles, and (3) delineate categories and example facets from our framework. Subsequently, in the following section, we show how the framework can be used to classify sets of research studies. Afterward, we discuss the benefits from using such classifications and eventually identify future improvements and refinements.
Existing frameworks and classification schemes
Kraft et al. (1991) described three library use cases for the application of graph theory: analyzing information structures (e.g. the public card catalog), scheduling library operations, and modeling library networks (as described in the previous section). They do not provide—at least not explicitly—a classification for different types of networks.
Newman (2003) loosely classified real-world networks as “social networks,” “information networks,” “technological networks,” and “biological networks.” It is generally reasonable that we can find all of these network types in the library domain, except biological networks, certainly. A social network consists of a set of social entities (people or groups of people) along with relationships, for example, patterns of contact or interaction, among them (Wasserman and Faust, 1994). Information networks, on the contrary, represent the structure of informational units, for example, scientific articles or web sites. Technological networks are usually artificially created to distribute some resource such as electricity or used as transportation routes, for example, airways.
Powell et al. (2011) give a good idea of graph use cases in libraries by distinguishing two main perspectives: informational graphs intrinsic to digital library systems and graphs as tools. They subsume three kinds of networks under the first perspective and already characterize their properties: citation networks (usually scale-free), collaboration networks (typically small-world networks), and expertise graphs, which are further split into subject–author graphs, institution–topic, and nation–topic graphs. According to Powell et al., graphs as tools can be used to identify collaboration opportunities, for author name disambiguation, to aggregate related materials, for bibliometrics, as temporal–topic graphs for analyzing the evolution of knowledge over time, for title or citation deduplication, as genomic–document and protein–document networks, for viral concept detection (e.g. usage of new keywords in the library), or as graphs of omission that allow for detecting cross-disciplinary collaboration or generating machine-supplied suggestions. Suitable node and edge definitions as well as network metrics for some of these graphs are depicted in another publication by Powell and Hopkins (2015).
Yan and Ding (2012) explored the similarity between six types of what they call “scholarly networks,” that is, bibliographic coupling, citation and co-citation networks (belonging to our group of “citation networks”), co-authorship networks (our “collaboration networks”), and topical and co-word networks (our “content networks”). They use a three-dimensional framework that covers network types (e.g. citation or co-word networks), approaches (i.e. type of network metrics applied), and aggregation levels (e.g. paper, journal, or institutional level). In the same paper, Yan and Ding then present different perspectives on scholarly network types that include “social networks” and “information networks” with different classes of edge types (citation-based, collaboration-based, word-based) that can stand for “real” or “artificial connections.” This framework thus integrates Newman’s as well as Powell et al.’s classifications with a focus on the type of relationship (“real” or artificial).
Yan and Ding (2012) express the demand for hybrid and heterogeneous networks that combine aspects of different approaches to successfully describe and use (scholarly) networks. To account for this, our approach enhances previous frameworks by not already including the network types but instead aspiring to deduce these from the facets that we apply.
In a follow-up publication, Yan and Ding (2014) expand their framework by including six key applications (evaluating research impact, studying scientific collaboration, studying disciplinarity and interdisciplinarity, identifying research expertise and research topics, producing science maps, finding knowledge paths) and by specifying approaches on the macro, meso, and micro level (e.g. degree distribution, community detection, and centrality measures). Besides, they now differentiate between “real connection-based vs similarity-based networks,” replacing “artificial connections” with “similarity-based ones,” which we think is a too narrow understanding of the possible types of connections.
Finally, Kong et al. (2019) gave a comprehensive overview from the perspective of Scholarly Big Data (SBD) and Social Networks, focussing on ASNs. They reviewed modeling, analysis, mining, and applications of ASN. Apart from describing network types, approaches, and applications, they also included “key mining techniques” in their “framework of academic social network survey,” which encompasses similarity measures and statistics, among others. However, by adhering to ASN, their framework is not fully compliant with our goal of presenting a framework for data in the library context that go beyond academic (social) relationships. Nevertheless, Kong et al. make explicit some suitable concepts such as dynamic, homogeneous, and heterogeneous networks that were not considered in previous frameworks.
We would like to point out that none of the available frameworks incorporates what we described as “Metadata Record Networks” in the literature review. We believe that this area of research shows especially great promise for the application of graph theory in the library domain since it concerns the creation and handling of metadata records themselves—an issue that has always been the central sphere of competence in libraries. In addition, we see the need for a suitable framework to include also those use cases that were already mentioned in early research studies, for example, library networks (Kraft et al., 1991), but not further investigated since.
Framework principles
Since graphs—in their most general form—are simply collections of nodes and edges, it seems reasonable to classify research based on the objects graphs are build of and on the relations between these objects (Yan and Ding, 2014). From a mathematical perspective, different types of graphs are constructed by using different nodes and edges, each of which might be useful to study different aspects of the data and hence to achieve different goals. Moreover, depending on the type of graph and its characteristics, different methods and algorithms are suited for the study of a data set.
We respect all these aspects in our framework by providing a faceted description of the application of graph theory in the library domain. Facets are grouped into five categories, where the assignment of at least one facet from each category is mandatory for describing a study. Categories are subdivided into subcategories, where appropriate. Graphs built on similar data or with similar characteristics—that is, with similar facets—can then be labeled and grouped to facilitate the identification of regularities and recurring principles in real-world data from the library context.
We agree with Svenonius (1978) that it is “both necessary and sufficient to name [. . .] aspects (facets) of a piece of information in order to bring all information on like subjects together” and that these facets can have a “syntactic function.” Moreover, according to Svenonius, they can be applied “in constructing standardized or canonical representations,” which supports the purpose of our framework.
In the following paragraphs, we demonstrate our faceted framework and show that the existing scientific literature as described above can be classified and structured according to this framework. Please note that the framework is extendable, that is, the following listing of subcategories is not exhaustive. Sub-subcategories are also possible but, for the sake of clarity, not used systematically. For illustration purposes, we point to familiar network types where this is reasonable.
Framework categories and facets
We now delineate the categories and facets our framework consists of.
Category 1: Node objects
In the simplest case, a graph is constructed using a single type of nodes, producing so-called homogeneous graphs. However, the number of different node types is not restricted, in fact, using heterogeneous graphs is common. Separating the node objects from other network aspects allows for comparing networks according to their constituent data. Node objects themselves can be grouped according to specific attributes which leads to the formation of several subcategories. Powell and Hopkins (2015) pointed at this fundamental distinction.
Category 1.1: People
Facets from this category are able to describe graphs whose nodes represent authors, editors, library staff, users, and so on; co-authorship networks are a well-studied example.
Category 1.2: Documents
Graphs whose nodes represent documents as a whole—for example, in citation networks—can be characterized using facets from this category.
Category 1.3: Journals
Some studies model relationships between scientific journals as a whole, that is, not just on the level of single articles.
Category 1.4: Words
Keywords from a thesaurus can be modeled in networks and are classified using a facet from this category if the keywords do not only serve as a representative for a document itself.
Category 1.5: Institutions
Library networks that model inter-library loan or similar processes have real library institutions as their nodes.
Category 1.6: Countries
A facet from this category can be used to represent, for example, nation–topic graphs as mentioned by Powell et al. (2011).
One can discuss whether metadata records themselves should be seen as documents and hence be classified using the appropriate facet, or if this type of node asks for a separate subcategory. At present, we prefer to treat them as a special kind of document because this simplifies the identification of appropriate network structures in which metadata records can be studied by adhering to similar research conducted on “proper” documents.
Category 2: Edge definitions
Since an edge connects at least two nodes (that do not necessarily have to be different), possible edges can be defined by describing the nodes connected through them, supplemented by edge meanings, that is, semantics. Edges in a graph can have attributes, thus be weighted/unweighted, directed/undirected, labeled, and so on, probably producing multi-relational graphs. Hence, this category allows for a plethora of possible facets and subcategories. We strongly argue for a formal definition of edges/relationships in a graph to facilitate the comparison across different studies and approaches (see also the discussion at the end of this article).
Category 2.1: Citation
Because citation in various forms (direct citation, co-citation, bibliographic coupling) is used in many studies, it seems reasonable to offer a dedicated category for this purpose. Separate subcategories could help to further differentiate possible facets.
Category 2.2: Collaboration
Facets from this category accomodate the existence of many studies in the co-authorship or collaboration context.
Category 2.3: Similarity
We keep similarity and citation facets separately because a direct citation between two journal articles, for example, does not inevitably indicate that these articles be similar. However, if this is the case, two (or more) facets can be used to describe a study. Many other forms of similarity are possible (Ahlgren and Colliander, 2009) and certainly not always easy to define. Graphs using similarity as edges are sometimes referred to as “associative networks” (Rodriguez et al., 2009).
Category 2.4: (Physical) connection
Facets from this category can be useful in describing research that looks at real, physically tangible connections such as local computer networks or more virtual connections such as travel paths inside a library facility (Foulds and Tran, 1986).
We do not follow the division into “real” and artificial connections by Yan and Ding (2014) because we are convinced that similarity too can be a “real” quality of entities. (Imagine a document connected to itself with, naturally, a similarity of 1, that is, identity. This identity can be hardly seen as something “artificial.”) We however adopt their notion of “similarity-based connections” by providing a separate subcategory for these.
Category 3: Research objectives
With this category, we cover what is called “key applications” by Yan and Ding (2014) or “graphs as tools” in Powell et al. (2011). Two identical networks—that is, the same nodes connected by the same edges—can still serve quite diverse goals. Often enough, studies focus on a single problem and try to solve it using network analysis or graph theory. But it remains regularly unclear whether the same problem was already tackled with other network configurations or if the same network was already used to approach other problems. By providing single facets for these research objectives, we aspire to enable an application-oriented perspective on graphs in the library domain. From this angle of view, answers to questions such as “Which network configurations are promising in assisting subject indexing processes?” can probably be found. For the sake of brevity, we primarily list only the use cases already mentioned by Yan and Ding and Powell et al. without discussing subcategory bounds further. Yet, we add and describe three subcategories that we deem important (Categories 3.13–3.15). Certainly, many more research objectives can be found.
Category 3.1: Studying scientific collaboration.
Category 3.2: Author name disambiguation.
Category 3.3: Aggregation of related materials.
Category 3.4: Producing science maps.
Category 3.5: Bibliometrics/evaluating research impact.
Category 3.6: Evolution of knowledge over time.
Category 3.7: Deduplication.
Category 3.8: Viral concept detection.
Category 3.9: Omission detection.
Category 3.10: Studying (inter)disciplinarity.
Category 3.11: Identifying research expertise/topics.
Category 3.12: Finding knowledge paths.
Category 3.13: Information retrieval.
In the beginning, citation analysis was primarily intended to facilitate information retrieval (Garfield, 2006), an aspect that was not foregrounded in most subsequent studies until the World Wide Web emerged. Especially when it comes to metadata record graphs, we are convinced that the application of graph theory can improve metadata quality and, both indirectly and directly, discovery and retrieval of resources these metadata describe.
Category 3.14: Analyzing information structures
This category represents another possible use case for the application of graph theory that was mentioned neither by Yan and Ding (2014) nor Powell et al. (2011), although already mentioned by Kraft et al. (1991). However, this use case was not examined in many studies since. Metadata Record Graphs may leverage the pursuit of this research objective.
Category 3.15: Library operations
The reason for mentioning this category explicitly is the same as for the preceding category.
Category 4: Graph characteristics
Even if the same type of nodes and the same edge definitions are used in two or more different graphs to achieve the same goal, these graphs may nonetheless exhibit different characteristics. This may, for example, be due to different data sources used or because of different collaboration structures in research domains. Therefore, next to nodes and edges a graph consists of, expressing this graph’s characteristics is central for allowing meaningful comparisons across similar, yet different graphs. We structure this category according to the network properties Newman (2003) mentioned but only elaborate on the first three to give an impression of possible characteristics. Descriptions of the other categories can be found in Newman (2003). Due to the diverse nature of real-world data, many more properties, for example, concerning network dynamics and evolution, are possible.
Category 4.1: Small-world
A facet from this category is used to describe graphs that show the small-world effect, that is, in which two nodes are mostly connected through only a small number of edges.
Category 4.2: Transitivity
If node A is connected to node B, and B itself is connected to C, then in many real-world networks, it is likely that A and C are also connected. If this is the case, using a facet from this category can express this property.
Category 4.3: Degree distributions
In this category different typical degree distributions can be represented. Examples are binomial, Poisson, or power-law distributions. Since graphs can exhibit complex degree characteristics, for example, in directed graphs with multiple edge and node types, this category should be differentiated through appropriate subdivisions. Networks with power-law distributions are commonly referred to as scale-free.
Category 4.4: Maximum degree.
Category 4.5: Network resilience.
Category 4.6: Mixing patterns.
Category 4.7: Degree correlations.
Category 4.8: Community structure.
Category 4.9: Network navigation.
Category 5: Methodology
Facets from this last category serve as a means to document the network metrics (“approaches” in Yan and Ding, 2014), algorithms, tools, software, heuristics, thresholds, and so on used to analyze and investigate graph structures. We think this is important because simply reporting the graph characteristics (Category 4) does not inevitably allow for insights into the precise methodology used. Graph-related studies in the library context may be conducted using different statistical tools, programming languages, algorithms, and so forth. Even a quite basic metric such as “betweenness centrality” might be defined in different ways depending on the software or data used. By introducing this category, we therefore aspire to make sure that all information related to the actual application of graph theory is documented and reproducible. This also allows for better comparison of research studies. After all, making these aspects explicit should as well raise libraries’ awareness of graph theoretical and mathematical foundations that the library data offered have to be in line with.
Category 5.1: Network metrics
Facets from this category represent network metrics on the macro, meso, and micro level (e.g. degree distribution, community detection, and centrality measures, see Yan and Ding, 2014).
Category 5.2: Software tools
For example, the Python programming language and its NetworkX package (Hagberg et al., 2008). Such a facet can help in making more clear what type of (import and export) data formats researchers use and need—an information especially relevant for data providers such as libraries.
Category 5.3: Algorithms
Not all graph analysis software implementations use the same algorithms in calculating network metrics. Making the algorithms explicit helps with determining whether appropriate techniques were used in a study.
Framework application
We will now show how the application of our framework can (1) help in structuring existing (and forthcoming) research, and (2) be the basis for defining concepts and research directions—which also allows for detecting areas not yet intensely studied.
Combining categories
By combining facets from all five categories, research studies can be flexibly described and compared to studies that use similar facets. For example, an article could be described by the following facets (Figure 1):
Category 1.1: People (possibly subcategory “Scientific Authors”).
Category 2.2: Two nodes of type “people” are connected if they both authored the same research paper. Edges are not weighted. A node cannot be connected to itself.
Category 3.13: Enhance information retrieval systems with co-author information.
Category 4.1, 4.2: Small-world characteristic, transitivity
Category 5.1, 5.2: Path lengths between nodes with and without direct edges were analyzed using the Python programming language and its NetworkX package
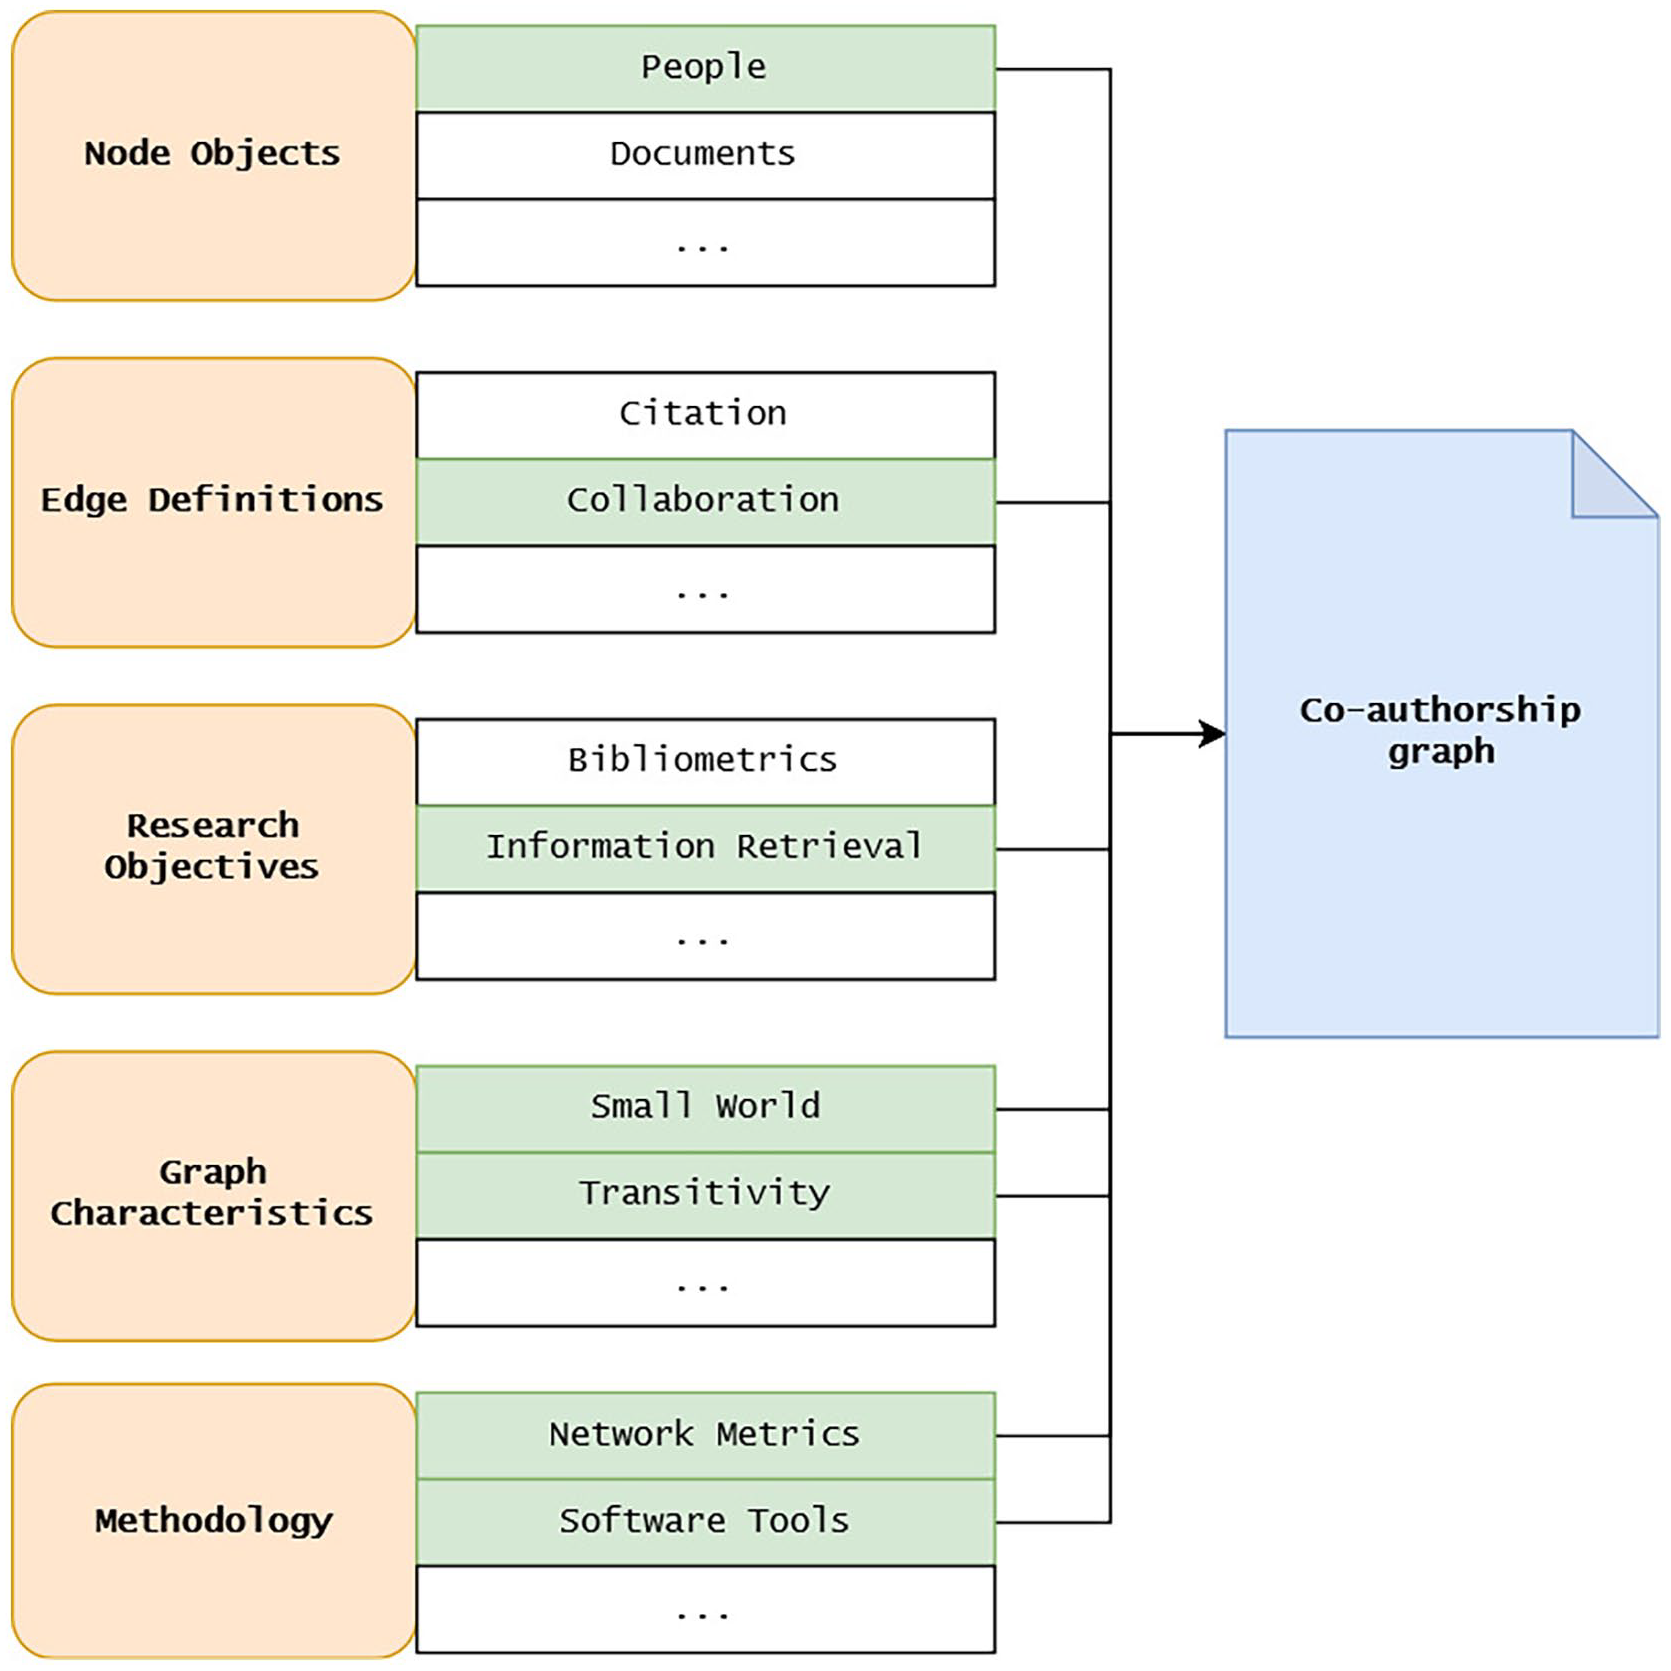
Application of the faceted framework.
The combination of these facets might then be described with an appropriate term, for example, the commonly used co-authorship graph. Other authors using the same network configuration should subsequently use the same term to show the relatedness between their networks or studies and the defining one. This leads to well-grounded definitions since graphs can be precisely, that is, mathematically, described by defining their nodes and edges. This is a precondition for a sound comparison of studies and network configurations grounded in graph theory.
Comparing many similar studies can support the generation of general conclusions such as “Coauthorship (collaboration) networks are typically small world networks” (Powell et al., 2011). Nevertheless, the more elaborated a study, the more facets from a single category must be used. This can lead to overlap between single facets because the subcategories in our framework are not necessarily disjunct (it is possible, for example, to use bibliometrics for the purpose of information retrieval). To achieve more disjunct categories, additional taxonomies, for example, from mathematics, could be used to define subcategories. Since our approach to developing a useful framework is based on a literature review in the library domain, we did not yet consider additional taxonomies.
Moreover, because the use of at least one facet from each category is mandatory, our framework can serve as a “checklist” to make sure that no essential information concerning the node and edge types, network characteristics, and graph tools used is missed in describing a study.
Defining concepts and finding research desiderata
As an example to illustrate the need for clarity in definitions, we look at a quote from Shaw’s (1983) article on “Statistical Disorder and the Analysis of a Communication-Graph”: For simplicity, a set of authors together with a set of co-author pairs will be referred to as a co-author graph, and any graph whose lines represent channels of communication, through which information can be transmitted or exchanged, will be referred to as a communication-graph.
Like we did in the preceding section, Shaw defines two kinds of graphs based on their node and edge types. Although not formally rigorous in a mathematical sense, definitions like this determine the ideas and concepts that researchers have in mind looking at certain data, which can broaden the view on phenomena, especially when they are new and described for the first time. Alike, a risk of limiting the scope of investigations is inherent in such definitions if they are applied for some time, because new, complementary, probably conflicting definitions might not be introduced. Third, the original context in which a definition was established tends to get overlooked in the course of time which leads to inappropriate usage of these definitions in contexts not identical to the original one. It is thus a proper procedure to bring these definitions regularly to mind, to reappraise and possibly redefine them in context of new knowledge. Our framework is able to assist in this process by providing a comprehensive, yet simple schema for comparing definitions of graph types, research areas, and network structures. This is the main contribution of our framework—besides the apparent function as a guidance through the research literature concerning graph theory and libraries to date.
The revision and assessment of definitions and graph-related studies will also allow for an examination of research areas that are not yet sufficiently studied. Imagine, for example, that such a revision will show co-authorship graphs are seldom studied with a facet from Category 4.9 (Network Navigation). This might indicate research directions that are worth being investigated. Our framework thus helps with structuring existing knowledge in the field of graph theory in the library domain which, in turn, supports the development of future research either by pointing at promising, well-studied network configurations or by hinting at research desiderata.
Discussion
Application domain
We attended to a literature review that focused on the application of graph-theroetical concepts and techniques in the library domain. This review is already a first contribution of our article since no comprehensive review from the library perspective exists yet. Since we also did not find any framework that was able to classify the reviewed literature in a satisfying manner, we aimed at developing a framework that is carefully compiled from previous research. This second contribution of our article can serve as a point of reference for libraries and related institutions if they intend to make their (meta)data more useful for research. This can happen, for example, by inferring from node and edge types used in network studies what kind of bibliographic data researchers need to achieve certain goals. These data then could be provided by libraries by enhancing and enriching already existing metadata records. This does not necessarily need to happen by reconstructing existing databases and data models to include these network data. As a first step, providing corpora of useful network data could already enable researchers to use metadata records as a resource as such, without being restrained to the manual extraction of these data from library catalogs.
We highlighted so-called metadata record graphs (Phillips et al., 2019, 2020a, 2020b) as a separate category in the literature review because we are confident this area of research will grow and its use be more acknowledged in the future. This will potentially happen under the idea of a bibliographic data science (Lahti et al., 2019) that uses metadata records not only as source for certain data, but also as a resource itself. We hope this emerging field can benefit from the structured approach our framework is able to support. In contrast to existing frameworks or classification schemes, our approach allows for defining network types based upon their particular characteristics and not a priori. Other perspectives on network studies that go beyond nodes and/or edges used—for example, from the research objectives a study pursues—become possible in a more structured way. This will also extend the variety of data sources used for network studies—currently, mostly citation databases are discussed and analyzed (Waltman and Larivière, 2020).
Bibliographic data
In many previous studies, the constituent data of citation, collaboration as well as content networks are described as “bibliographic data” (Ferrara and Salini, 2012; Jakawat et al., 2016) and these networks thus as “bibliographic networks” (Bioglio et al., 2017; Gupta et al., 2011; Küçüktunç et al., 2012), although there is no exact notion what “bibliographic data” means. In the majority of cases, however, this refers to (meta)data more or less inherent to scientific publications (e.g. Jensen et al., 2016). A further investigation and discrimination of what bibliographic data encompass in different scenarios and network configurations would be desirable in the future. Beyond that, other terms such as “scholarly networks” (Yan and Ding, 2012) were proposed.
Data sources
Note that a facet for describing the data source (e.g. a certain library catalog or a citation index) is not provided in any of the categories. Graphs and their characteristics solely depend on the information that is used for graph modeling; therefore, the source does indeed provide valuable information when comparing different sources using the same methodology but not when structuring the application of graph theory in the library domain as such. Additions to the framework that respect data sources are possible, however (see below).
Possible framework refinements
There are certainly a few aspects that could enhance the usefulness of our framework but that are not in the scope of this article, three of which are briefly covered in this section.
Formal definitions
First of all, a formally rigorous definition of nodes, edges, methodology, and graph characteristics would allow for a mathematically sound description and deduction of single facets and (sub)categories. For example, by generically defining representative edge types such as similarity between different kinds of nodes, a more concise classification of research studies could be achieved (see Belanche and Orozco, 2011, for a discussion of different definitions of (dis)similarity). By this, not only the comparison between different studies but also the construction of new approaches would be facilitated considerably—because precise parameters would be available to fine-tune different types of graphs. For example, imagine a generic edge type content similarity that depends on the value of a similarity score
Integrating more research fields
As has been mentioned at the beginning of this article, we did not extensively consider research related to knowledge graphs, recommender systems, visualization, or graph data mining. Certainly, these fields can be integrated into our framework via the appropriate categories. The development of recommender systems, for example, is a type of research objective for which a deeper analysis of those systems using graph theory would lead to a more detailed perspective in the other categories (e.g. user behavior as part of an edge definition). Knowledge graphs differ from many of the aforementioned graphs in what they consider a node or an edge. Graph data mining is a type of methodology to gain insights into data modeled as graph; visualization can be seen as a research objective.
The framework thus allows for a seamless integration of more research studies and, at best, serves as orientation for finding new research approaches that themselves contribute to intensifying the structure of the framework.
Designing standard workflows
In addition to frameworks, classifications, software tools, and algorithms, research on graphs and networks needs (standard) workflows to approximate data, their attributes, and characteristics. First attempts to develop such workflows can be found (Butt et al., 2021); however, publicly available data sets and benchmarks are still rare.
Conclusion
By undertaking a literature survey and providing a framework that is able to describe the use of graph theoretical concepts in the library context based on facets from several groups, we were able (1) to classify the existing literature in this field; (2) to facilitate the classification of new research works; (3) to allow for multiple perspectives on this research field by adhering to categories derived from graph theory, that is, nodes and edges, among others; (4) to give researchers in the context of bibliographic data an orientation toward the application of different network configurations; and finally (5) to streamline the numerous aspects and directions contained in previous scientific literature. In contrast to previous research, our framework does not define network and graph types a priori but deduces these from the facets applied. Thereby, more and richer perspectives on the data are possible.
Our focus was on libraries and related institutions and their application of graph-related concepts. By using our framework, these institutions can expand their view on (meta)data from a network perspective. Data providers can question the structure and content of their available data sets which might, in turn, facilitate the provision of suitable data sets which allow for analyses previously not possible or thought of.
To refine the proposed framework, we expressed the need for formal definitions of graph nodes and edges, for integrating more research fields, and for designing standard workflows. In addition, we are convinced that seeing metadata records as a resource itself from a graph perspective will be of use in the future and improve information retrieval, resource discovery, and data analysis in the library domain.
Footnotes
Declaration of conflicting interests
The author(s) declared no potential conflicts of interest with respect to the research, authorship, and/or publication of this article.
Funding
The author(s) received no financial support for the research, authorship, and/or publication of this article.