
Abstract
Introduction
The investigation focused on the function of LINC00958 in the development of oral cancer, as well as the influence of methylation on tumor formation.
Methods
To explore the role of LINC00958, both its overexpression and its methylated form were examined in oral cancer cells. Various assays including CCK-8, transwell, plate cloning, flow cytometry, and EdU staining were utilized to assess the activity, invasion, cloning efficiency, cell cycle progression, and proliferation of the cancer cells. The tumorigenic potential of these cells was evaluated through experiments conducted on immunodeficient mice. Moreover, the methylation status of LINC00958 mediated by the KIAA1429 protein was confirmed using MeRIP-qPCR.
Results
The study indicated that the overexpression of LINC00958 enhanced the activity, proliferation, and invasive capabilities of oral cancer cells, thereby increasing their tumorigenic potential. In contrast, overexpression of KIAA1429 led to a decrease in the proliferation, invasion, and tumorigenic properties of these cancer cells. Verification of methylation levels indicated that KIAA1429 overexpression resulted in heightened methylation of LINC00958. It was concluded that KIAA1429 diminishes the proliferation, invasion, and tumorigenesis of cancer cells through the methylation of LINC00958.
Discussion
This research provided insights into the role of LINC00958 in oral cancer cells and underscored the impact of methylation, offering a theoretical foundation for improving clinical diagnosis and treatment strategies for oral cancer patients.
Introduction
Oral and oropharyngeal cancers rank as the sixth most prevalent types of malignant tumors worldwide. 1 It is estimated that annually, over 400,000 new cases of oral cancer are identified globally, with approximately two-thirds occurring in Asian nations, including Sri Lanka, Indonesia, India, Pakistan, and Bangladesh.1,2 In these regions at higher risk, oral cancer represents the most frequently occurring malignancy, constituting over 25% of all new cancer diagnoses each year. 1 The likelihood of developing oral cancer rises with age, peaking in individuals over 60 years old, while there is also a notable increase in cases among those younger than 401. Risk factors for oral cancer are also linked to occupational exposures. For instance, studies have indicated that workers exposed to benzene in their occupations may have an elevated risk of developing oral cancer. 3 The prognosis for oral cancer is generally unfavorable, with an overall 5-year survival rate falling as low as 40%. However, if the cancer is detected in its early stages (stages I and II), this survival rate can surpass 80%. 4 Nearly 50% of oral cancers are identified at advanced stages (stages III and IV), mainly because many patients experience no symptoms during the initial phases and do not pursue medical attention until they present with prominent signs like pain, bleeding, or swelling in the mouth or neck (in cases where lymphatic spread has already occurred). 5 A delay of more than 1 month in diagnosis significantly heightens the risk of progressing to advanced oral cancer. 6 Often, the patients themselves contribute to the delay in obtaining a diagnosis; however, this lag can also stem from inadequate medical care, such as failing to suspect, diagnose, or treat oral malignancies in a timely and sufficient manner.6–8 Typically, as the disease advances and tumor locations become harder to access, the prognosis worsens (i.e., survival rates for lip cancer are generally more favorable than those for oropharyngeal cancer). 9 The clinical and pathological stages at diagnosis remain critical factors influencing prognosis. 9 Given the elevated mortality rates associated with oral malignancies, prompt detection and diagnosis are essential for improving prognosis and survival rates, as well as for decreasing the incidence of treatment complications. 10 Developing a mutational gene panel for the population is crucial for identifying significant driver genes of oral cancer, thereby facilitating early detection and treatment.
Non-coding RNAs (NCRs), including circular RNAs (circRNAs) and long non-coding RNAs (lncRNAs), are generated through gene transcription and are crucial in the context of cancer.11–13 CircRNAs and lncRNAs possess short open reading frames (SORFs)14,15 capable of translating small peptides consisting of fewer than 100 amino acids. The lncRNAs feature long, non-random SORFs and highly conserved exons that may interact with ribosomes to encode proteins or peptides. The lncRNA LINC00958 is significant in numerous cancers. Research focusing on head and neck cancer has indicated that data from the Cancer Genome Atlas (TCGA) revealed markedly different expressions of LINC00958 in cancerous samples compared to normal tissues. 16 Clinically, elevated levels of LINC00958 may correlate with lymph node metastasis in tumors as well as their TNM stage. Additionally, analyses using Kaplan-Meier survival curves and receiver operating characteristic curves have demonstrated that LINC00958 can serve as an independent prognostic marker for diagnosing oral squamous cell carcinoma and oral cancer. 17 Furthermore, the upregulation of LINC00958 has been shown to promote the epithelial-mesenchymal transition (EMT) process. 16 Conversely, the downregulation of LINC00958 can impede tumor proliferation. 18 Consequently, LINC00958 holds promise for aiding in the clinical diagnosis and treatment of patients suffering from oral cancer.19,20
Materials and methods
Cell line
Human pharyngeal squamous cell lines SCC-15, TSCCA, HSU3, Fadu and buccal cell line NHOK, were obtained from ATCC (https://www.atcc.org/). All cell lines were authenticated by short tandem repeat (STR) profiling within 6 months of use. Periodic mycoplasma testing was conducted using the mycoplasma detection kit (FM321, TransGen, China). Cell lines were cultured in MEM (PM150410)+10% FBS(164,210-50)+1% P/S(PB180120). All cells were incubated in a 37°C, 5% CO2 growth chamber, and the cells in the logarithmic phase were used for subsequent experiments.
Mice
SPF immunodeficient nude mice (BALB/C-nu) were purchased from Guangdong Medical Laboratory Animal Center. They were 4-6 weeks old, female and weighed about 20 g. They were randomly grouped into subcutaneous tumors and fed at 25°C and 40%-60% humidity, with daily light duration of 12 h. Animals were housed and cared for in accordance with national laboratory animal guidelines. The experimental procedures were approved by the Institutional Animal Care and Use Committee of Guangzhou Ruige Biotechnology Co., LTD. (Guangzhou, China), approval number (20231218-003), which was performed in accordance with the ARRIVE 2.0 guidelines.
Fluorescent quantitative PCR
Primers used for qPCR.

All primers were validated for specificity by melting curve analysis, and the results showed a single peak.
CCK-8
The cell suspension was inoculated into 96-well plates and cultured at 37°C in a 5% CO2 incubator until the cells adhered to the wall 4 h later, and then 10 μL CCK8 solution was added. After incubation for 2 h, the light absorption value at 450 nm was measured using an enzymoleter. The cell survival rate (%) = [(As-Ab)/(Ac-Ab)] × 100 was used to calculate the survival rate. As is the absorbance of the experimental hole (medium, cell, CCK-8 and compound to be measured); Ab is blank hole absorbance (medium, CCK-8); Ac is the absorbance of the control hole (medium, cell, CCK-8).
Transwell migration
The cell suspension of the two kinds of cells was diluted and added to the Transwell chamber. 800 µL medium containing 10% serum was added to the lower chamber and cultured in a cell incubator at 37°C for 48 h. After the liquid in the upper and lower chambers was sucked out, the cells were cleaned and repeated twice with PBS. To fix the cells, 5 mL methanol reagent was added for 15 min, and then 0.5% crystal violet staining solution was added for 20 min. After cleaning, the color was decolorized with 40% acetic acid, and photos were taken.
Plate cloning
The cell suspension was inoculated with gradient dilution and cultured in a cell incubator at 37°C with 5% CO2 and saturated humidity for 2 weeks. Culture is stopped when visible clones appear in the petri dish. Discard the culture supernatant, then carefully soak with PBS. Add methanol reagent and fix for 15 min. Add appropriate amount of Giemsa and dye with dyeing solution for 30 min. Wash the dye slowly and gently under running water and dry in the air at room temperature. Finally, the cells were counted under a 40-fold microscope. The clonal formation rate was calculated as: (number of clones / number of inoculated cells) × 100%.
Cell cycle
The DNA content detection kit (Cell cycle) (Solarbio, China) was used for cancer cell cycle detection. The digested cells were cleaned with PBS, slowly added with 5 mL pre-cooled 70%–80% ethanol, sheltered from light overnight at 4°C, then suspended with 200 μL PBS after ethanol removal, then added with 5 μL PI dye and 20 μL 1 mg/mL RNase. After incubation without light for 15 min, it was detected by BD FACS Calibur flow cytometry.
EdU cell proliferation assay
The cell proliferation detection was performed using EdU cell proliferation detection kit of Shanghai Shenggong Company. The adherent cells were added to EdU solution and incubated for 2 h. After EdU solution cleaning, the cells were taken and fixed with formaldehyde. Then, the cells were treated with glycine and Triton X-100 cell permeable solution. EdU was added to detect the light avoidance reaction for 30 min, and Hoechst 33,342 was added to the light avoidance reaction for 30 min after cleaning. Finally, after cleaning, it was excited by fluorescence microscope at 541 nm and 350 nm, observed and photographed at 567 nm and 461 nm.
WB
The total protein of the cells was extracted, centrifuged at a high speed at 4°C, and the supernatant was taken with 10% SDS-PAGE gel and subjected to protein electrophoresis at constant pressure of 120 V. The supernatant was then transformed at 75 V for 90 min after 1 h, sealed with 5% normal calf serum for 1 h, and cleaned with TBST buffer for 3 times. The primary antibody was added and incubated at 4°C overnight. After TBST buffer was cleaned, it was incubated with the corresponding secondary antibody at room temperature for 2 h. Then ECL color development was performed, and gray values were measured after collection by automatic gel imaging analyzer.
MeRIP-qPCR
MeRIP-qPCR was performed using the riboMeRIPTM m6A Transcriptome Profiling Kit (RIBOBIO, GuangDong). RNA extraction was performed using the reagent step in fluorescence quantitative PCR and the RIP step was performed using the instruction manual. The methylated primers were designed using MethPrimer software (https://www.methprimer.com/). The sequences of the primers are presented in Table 1.
Subcutaneous tumor xenograft models
The tumor cell suspension was prepared, and the mice were sidewise injected with a large-caliber syringe under aseptic conditions. After the injection was completed, the needle was drawn out by a third of the needle and the needle was rotated repeatedly. Three naked mice were used in each of the four treatment groups. After 10 days, the mice were killed by neck, the tumors were photographed, and the volume and weight of the tumor tissue formed under the skin of each mouse were measured. The data of long diameter, short diameter and three groups were measured using vernier caliper, and the tumor volume of each mouse was obtained according to the tumor volume formula calculated by the elliptic sphere: V = π/6 × L (long diameter) × W (short diameter) × H (height). The maximum diameter of the detached tumor does not exceed 20 mm. Group sizes (n = 3) were determined through preliminary data indicating effect sizes >3 standard deviations for primary endpoints, consistent with low-variability models in published literature. 21 Post hoc power analysis confirmed >99% statistical power (α = 0.05, two-tailed t-test) to detect the observed effects. This approach aligns with NIH guidelines for minimizing animal use while ensuring scientific validity.
Statistical analysis
Statistical analyses were conducted with GraphPad Prism 9.0.0 (GraphPad Software, USA) and SPSS 27.0 (IBM, USA). Data are expressed as mean ± standard deviation (SD). Each experiment was performed with a minimum of three independent replicates. The Shapiro-Wilk test was employed to assess the normality of the data sets, while Levene’s test was utilized to verify the homogeneity of variances. Multiple comparisons were analyzed using a one-way analysis of variance (ANOVA) followed by Tukey’s post-hoc test, with effect sizes reported as η2 (Eta-squared). Comparisons between the two groups were assessed using the Student’s t-test with effect sizes Cohen’s d. Confidence intervals (CI) were calculated. A P-value of < 0.05 was indicated as statistically significant.
Results
Cell screening and overexpressed cell construction
The levels of LINC00958 expression in normal oral cells (NHOK) and cancer cell lines (SCC-15, TSCCA, HSU3, and Fadu) were assessed using fluorescence quantitative PCR. Results revealed that the expression of LINC00958 was notably elevated in the four cancer cell lines compared to the normal cells (η2 = 0.964. NHOK vs. SCC-15: P < 0.05, 95%CI: −3.683 to −2.384; NHOK vs. TSCCA: P < 0.05, 95%CI: −3.064 to −1.765; NHOK vs. HSU3: P < 0.05, 95%CI: −1.620 to −0.321; NHOK vs. Fadu: P < 0.05, 95%CI: −1.036 to 0.2633) (Figure 1(a)). Notably, Fadu cells exhibited the lowest expression, while SCC-15 showed the highest. Consequently, the Fadu cell line was chosen for the transfection of the LINC00958 sequence to establish the oe-LINC00958-Fadu cell line. The LINC00958 expression level in the oe-LINC00958-Fadu cell line was then measured, revealing a significant increase in expression compared to the original Fadu cells (Cohen’s d = 1.022, p < 0.05, 95%CI: 8.087 to 20.43) (Figure 1(b)), confirming the successful creation of the overexpressing cell line. Construction of LINC00958 overexpressing cell line. A: The mRNA levels of LINC00958 in different cell lines. Compared to NHOK group, *p 
Overexpression of LINC00958 changes the proliferative ability of cancer cells
The activity of the two cell types was further assessed using CCK-8, and the findings indicated that Fadu cell activity continued to rise up to 48 h following the overexpression of LINC00958 (Cohen’s d = 0.1592, p < 0.05, 95%CI: 0.2285 to 0.2861) (Figure 2(a)). Additionally, results from the invasion experiments demonstrated a notable increase in the invasion capability of the cells post LINC00958 overexpression (Cohen’s d = 15.00,555, p < 0.05, 95%CI: 125.6 to 193.7) (Figure 2(b)). In plate cloning tests, a significant enhancement in cell cloning efficiency was observed after LINC00958 overexpression (Cohen’s d = 5.00,000, p < 0.05, 95%CI: 88.67 to 111.3) (Figure 2(c)), and flow cytometry revealed a reduction in the cell cycle duration (S: Cohen’s d = 1.36,779, p < 0.05, 95%CI: −11.84 to 1.701; G2/M: Cohen’s d = 1.92,307, p < 0.05, 95%CI: 1.289 to 13.25) (Figure 2(d)). Edu staining experiments produced similar outcomes (Figure 2(e)), showing that with an equal cell count in the visual field, the number of live Fadu cells was greater after LINC00958 overexpression, suggesting an improved proliferation capacity. Detection of biology function in Fadu cells. A: Cell activity measured by CCK-8 assay; B: Invasion capability assessed through Transwell assay; C: Cell cloning ability evaluated via plate cloning assay; D: Cell cycle detected by flow cytometry; E: The level of cell proliferation detected by EdU. n = 3 independent repeats with 3 technical replicates each. Compared to Fadu group, *p 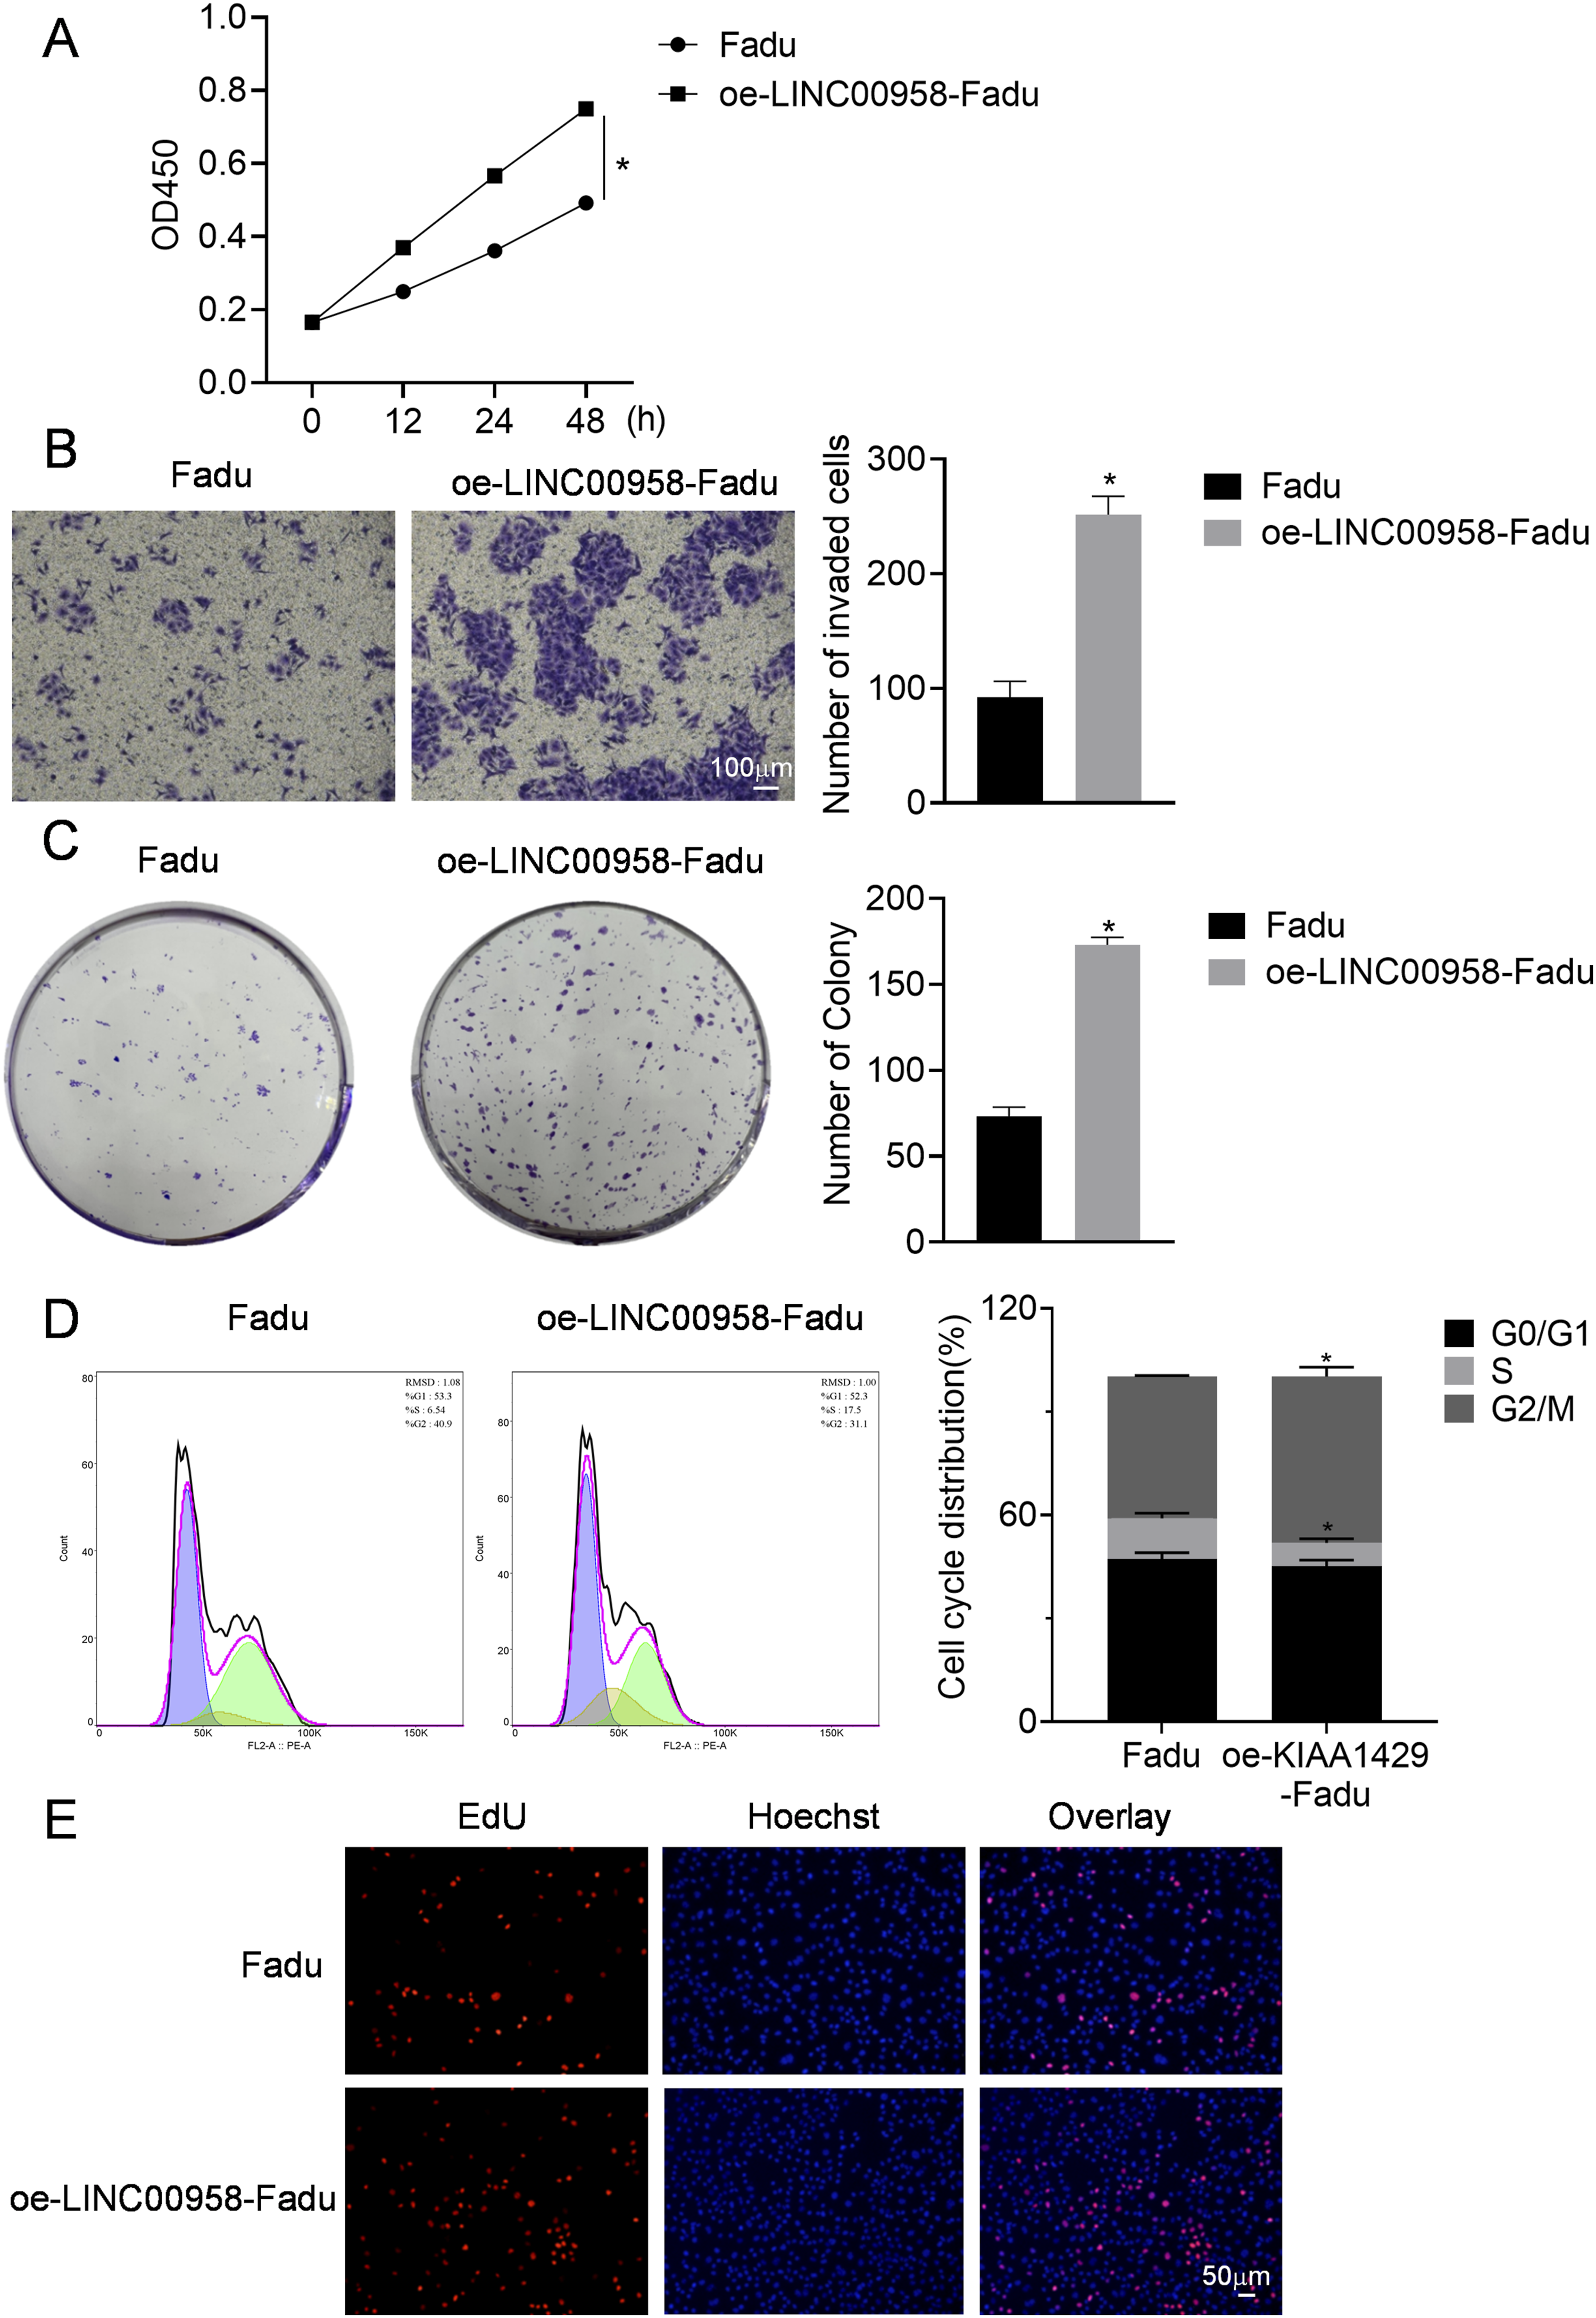
Overexpression of KIAA1429 changes the proliferative ability of cancer cells
The KIAA1429 gene expression level was measured in four different cancer cell lines, revealing that SCC-15 exhibited the lowest expression of this gene (η2 = 0.990. NHOK vs. SCC-15: p < 0.05, 95%CI: −1.343 to −0.5194; NHOK vs. TSCCA: p < 0.05, 95%CI: −2.499 to −1.676; NHOK vs. HSU3: p < 0.05, 95%CI: −2.063 to −1.239; NHOK vs. Fadu: p < 0.05, 95%CI: −4.557 to −3.733) (Figure 3(a)). Consequently, the SCC-15 cell line was chosen for transfection with a KIAA1429 overexpression sequence, leading to the establishment of the oe-KIAA1429-SCC-15 cell line. Subsequent detection of KIAA1429 expression in these oe-KIAA1429-SCC-15 cells indicated a significant increase compared to the original SCC-15 cells (Cohen’s d = 0.31,616, p < 0.05, 95%CI: 0.6048 to 1.749) (Figure 3(b)), confirming the successful establishment of the overexpressing cells. Further assessments of cell viability using CCK-8 revealed that the SCC-15 cells maintained a lower activity level than the oe-KIAA1429-SCC-15 cells for up to 48 h post KIAA1429 overexpression, with a slight reduction in activity noted (Cohen’s d = 0.07,721, p < 0.05, 95%CI: −0.6800 to −0.4007) (Figure 4(a)). Invasion assays demonstrated a notable decrease in the invasive capacity of the cells following KIAA1429 overexpression (Cohen’s d = 9.96,661, p < 0.05, 95%CI: −215.6 to −170.4) (Figure 4(b)). Additionally, plate cloning studies indicated that the ability to form colonies was significantly impaired after the KIAA1429 overexpression (Cohen’s d = 8.81,287, P < 0.05, 95%CI: −126.3 to −86.35) (Figure 4(c)), and flow cytometric analysis showed an increased number of cells in the cell cycle (S: Cohen’s d = 1.36,779, p < 0.05, 95%CI: −8.171 to −1.969; G2/M: Cohen’s d = 1.92,307, p < 0.05, 95%CI: 2.910 to 11.63) (Figure 4(d)). Consistent findings were obtained from Edu staining experiments (Figure 4(e)), where under the same visual field conditions, the oe-KIAA1429-SCC-15 cells exhibited fewer viable cells compared to the SCC-15 cells, suggesting a decrease in their proliferative capacity. These results indicate a contrasting role between KIAA1429 and LINC00958 in oral cancer, where LINC00958 promotes cancer cell growth, while KIAA1429 appears to inhibit it. Construction of KIAA1429 overexpressing cell line. A: The expression levels of KIAA1429 in different cell lines. Compared to NHOK group, *p Detection of biology function in SCC-15 cells. A: Cell activity measured by CCK-8 assay; B: Invasion capability assessed through Transwell assay; C: Cell cloning ability evaluated via plate cloning assay; D: Cell cycle detected by flow cytometry; E: The level of cell proliferation detected by EdU. n = 3 independent repeats with 3 technical replicates each. Compared to SCC-15 group, *p 

The overexpression of two genes changed the tumorigenic ability of cancer cells
Four kinds of cancer cells were injected into naked mice for subcutaneous tumor formation. The body weight of naked mice decreased gradually within 28 days, and the mice injected with oe-LINC00958-Fadu cells showed the fastest weight decline, the slowest was oe-KIAA1429-SCC-15, and the fastest growth in tumor volume was also oe-LINC00958-Fadu. The slowest was oe-KIAA1429-SCC-15, and the tumors formed by Fadu and SCC-15 cancer cells grew at similar rates and the mice lost similar amounts of body weight (Body weight: η2 = 0.890. Fadu vs. oe-LINC00958-Fadu: p < 0.05, 95%CI: 0.6436 to 3.423; SCC-15 vs. oe-KIAA1429-SCC-15: p < 0.05, 95%CI: −2.590 to 0.1897. Tumor volume: η2 = 0.919. Fadu vs. oe-LINC00958-Fadu: p < 0.05, 95%CI: −3.100 to −1.295; SCC-15 vs. oe-KIAA1429-SCC-15: p < 0.05, 95%CI: 0.04,539 to 1.850.) (Figure 5(b) and (c)). After 28 days, the mice were killed and tumors were taken. Weight measurement showed that oe-KIAA1429-SCC-15 tumors in the four groups had the smallest mass, and oe-LINC00958-Fadu tumors were the heaviest, and direct observation of tumor images also showed that oe-LINC00958-Fadu tumors were larger than those in the two control groups. oe-KIAA1429-SCC-15 tumors were smaller than the two controls (η2 = 0.940. Fadu vs. oe-LINC00958-Fadu: p < 0.05, 95%CI: −0.6023 to −0.3040; SCC-15 vs. oe-KIAA1429-SCC-15: p < 0.05, 95%CI: 0.05,032 to 0.3487) (Figure 5(a) and (d)). Further fixed tumor sections and HE staining showed that oe-LINC00958-Fadu in the four tumors was relatively dense and formed a certain vascular structure with a small number of blood cells, while oe-KIAA1429-SCC-15 had fewer hollow cavities and no obvious vascular structure (Figure 5(e)). Influence of overexpression of two genes on tumorigenic ability of cancer cells. A: Tumor appearance; B: The curve of body weight changes in mice within 28 days; C: Tumor volume change curve within 28 days; D: Tumor quality detection; E: Tissue structure of tumor sections stained with HE, scale bar, 20 μm. n = 3 independent repeats with 3 technical replicates each. *p 
KIAA1429 functions through the methylation of LINC00958
The methylation site of LINC00958 was predicted using MethPrimer software, and the corresponding methylation and non-methylation primers were designed (Figure 6(a)). MeRIP-qPCR analysis validated that the level of methylation modification of LINC00958 was significantly increased, while the level of non-methylation modification was significantly decreased in KIAA1429-overexpressing SCC-15 cells compared to the SCC-15 group (LINC00958: Cohen’s d = 0.11,770, p > 0.05, 95%CI: −0.2108 to 0.2149; LIN-M: Cohen’s d = 0.05,246, p < 0.05, 95%CI: 0.3351 to 0.5249; LIN-N: Cohen’s d = 0.08,847, p < 0.05, 95%CI: −0.4876 to −0.1675) (Figure 6(b)). Methylation of LINC00958 by KIAA1429. A: The prediction of methylation sites for LINC00958; B: The alterations in methylation levels of LINC00958 in cell lines overexpressing KIAA1429. n = 3 independent repeats with 3 technical replicates each. Compared to SCC-15 group, *p 
Discussion
In this study, the function of LINC00958 and the function of KIAA1429 on the overexpressed oral squamous cell cell line were detected through construction, and the methylation of KIAA1429 combined with LINC00958 was confirmed by RIP assay. It was found that KIAA1429 can inhibit the proliferation and migration of oral cancer cells through methylation of LINC00958, and affect cell tumorigenesis. LINC00958 has been reported in various cancer-related studies, such as colorectal cancer, bladder cancer, osteosarcoma, endometrial cancer, lung adenocarcinoma, thyroid cancer, etc.,22–27 so it may be considered as a new prognostic marker in various cancers.28,29 In head and neck cancer, the regulation of microRNA by LINC00958 is often the focus of research. 16 According to existing research results, the regulation of microRNA by LINC00958 is mostly upstream of common cancer cell proliferation pathways. For example, epithelial mesenchymal transformation pathway and AKT/mTOR signal transduction pathway30,31 have cancer-promoting functions and may positively feedback with MYC to regulate chemotherapy and radiotherapy resistance of cancer cells. 32 This is consistent with the results of the study on the function of this RNA in this study, the overexpression of LINC00958 caused the accelerated proliferation of oral squamous cell cells in vitro and stimulated the cell activity.
In addition, the regulation of LINC00958 was also studied. In MethPrimer database, we predicted that LINC00958 had KIAA1429 protein action site, and LINC00958 also had N6-methyladenosine (m6A) modification site based on structural prediction. The methylation effect of KIAA1429 on LINC00958 has been confirmed in liver cancer and gastric cancer,33,34 and it is concluded that this modification is correlated with glycolysis and lipogenesis. But in oral cancer, the relationship is less clear. Our research demonstrated that overexpression of KIAA1429 appears to suppress cancer progression, potentially via methylation of LINC00958. This modification helps maintain the expression level of KIAA1429, although its functional capacity may be diminished, ultimately leading to reduced proliferation and invasion of oral cancer cells. The KIAA1429 protein functions as an m6A methyltransferase, targeting various RNA types including mRNA, lncRNA, circRNA, and miRNA to influence downstream gene activity. In the realm of cancer research, KIAA1429 influences relevant RNAs both in M6A-dependent and M6A-independent manners, impacting processes such as alternative splicing, RNA maturation, translation, degradation, and stability, among others. 35 KIAA1429 promotes the m6A modification of RNAs in many target transcripts, KIAA1429 overexpression will increase the overall m6A modification of cellular RNAs. 36 Our results found that overexpression of KIAA1429 upregulated the level of methylation modification of LINC00958. KIAA1429 recruits methyltransferase-like 3 (METTL3), methyltransferase-like 14 (METTL14), and Wilms’ tumor 1-associating protein (WTAP) to specific sites of m6A modification. 37 Beyond LINC00958, 34 LINC00667 also serves as a modification target for KIAA1429. In the case of breast cancer, increased expression of KIAA1429 can elevate LINC00667 stability, thereby enhancing the proliferation and migration of breast cancer cells. 38
The KIAA1429 protein is known to regulate several targets, including DAPK3, ID2, GATA3, SMC1A, CDK1, and SIRT1. Additionally, it plays a significant role in stimulating the EMT pathway and influences processes such as cell proliferation, migration, invasion, metastasis, and tumor growth. In numerous cancers, KIAA1429 primarily functions to promote tumor growth. Liu et al. demonstrated that upregulated LINC00968 in gastric cancer served as a tumor promoter regulating cell growth and metastasis via modulating the miR-3202/VIRMA axis and regulating KIAA1429. Overexpressing KIAA1429 enhanced the expression of LINC00968 and mediated the effect of LINC00968 on gastric cancer cells in an m6A manner. 39 In multiple myeloma (MM), knocking down KIAA1429 can reduce FOXM1 expression through YTHDF1-mediated m6A modification, thereby inhibiting MM aerobic glycolysis and inhibiting tumor development. 40 However, a study utilizing data from TCGA and the Genotype-Tissue Expression (GTEx) databases conducted a differential analysis of KIAA1429 expression in cancer, revealing that KIAA1429 was downregulated in tumor samples from patients with acute myeloid leukemia (LAML) and ovarian serous cystadenocarcinoma (OV). 41 However, the specific mechanism of action of KIAA1429 has not been explored. This finding suggests that KIAA1429 may distinct roles across various tumor types. Our study revealed that the overexpression of KIAA1429 in cells might exhibit a tumor-inhibitory effect, suggesting that both KIAA1429 and LINC00958 hold potential for further research. The variations in their expression levels could contribute to the establishment of diverse regulatory networks, thereby playing a multifaceted role in tumorigenesis. In gastric cancer, studies have demonstrated that KIAA1429 interacts with the m6A modification site, promoting the enrichment of LINC00958. Subsequently, LINC00958 collaborates with GLUT1 mRNA to enhance its stability, thereby accelerating aerobic glycolysis in gastric cancer. 34 However, research on the mechanism by which KIAA1429 regulates LINC00958 methylation and its subsequent influence on oral cancer is limited.
Methylation patterns exhibit significant differences across various histologic grades of cancer and are closely associated with other clinical parameters, such as age and gender. Distinct histologic grades of OSCC may reflect varying methylation statuses, thereby influencing cancer prognosis and treatment strategies. 42 High-grade soft tissue sarcoma samples demonstrate a more pronounced hypermethylation pattern compared to their low-grade counterparts. This variation in methylation patterns not only aids in distinguishing between different histologic subtypes but also informs treatment decisions. 43 Furthermore, methylation patterns correlate with the age and gender of patients; for instance, methylation levels of specific genes are positively correlated with age, and these changes may exhibit different trends in males and females. Such gender differences could be linked to mechanisms such as X chromosome inactivation. 44
The limitations of this study stem from the need for further investigation into the regulatory mechanisms by which KIAA1429 influences the methylation and functionality of LINC00958. Future research should employ RNA sequencing (RNA-seq) to identify key genes and explore significant downstream pathways. Following the results obtained from RNA-seq, rescue experiments utilizing specific small molecule inhibitors or agonists in relevant cell models will be conducted to elucidate the mechanisms through which KIAA1429 regulates LINC00958 methylation and its associated functions. Additionally, it is essential to confirm mutations at the methylation sites.
Conclusion
Methylation patterns reveal significant alterations across different histologic grades of cancer and other clinical parameters. These alterations not only provide novel insights for cancer diagnosis and grading but also establish a crucial foundation for developing individualized treatment strategies. Future studies should further investigate the specific mechanisms underlying methylation changes in oral cancer.
Footnotes
Ethical considerations
The experimental procedures were approved by the Institutional Animal Care and Use Committee of Guangzhou Ruige Biotechnology Co., LTD. (Guangzhou, China), approval number (20231218-003), which was performed in accordance with the ARRIVE 2.0 guidelines. Efforts were made to minimize animal suffering. When mice exhibit humane endpoints, such as sustained weight loss and loss of appetite, they are euthanized via inhalation of an ether overdose.
Author Contributions
Pengjun Zhou and Wanning Li designed, performed the experiments, and wrote and revised the paper. Meiyi Ye performed in vitro experiments. Chunlan Chen reviewed and revised the paper. Yifei Wang designed the study and revised the paper. All authors contributed to analyze the results and approved the paper.
Funding
The authors disclosed receipt of the following financial support for the research, authorship, and/or publication of this article: This work was supported by the Science and Technology Projects in Guangzhou (2023A04J1143), Youth Program of National Natural Science Foundation of China (82002930), China Postdoctoral Science Foundation (2019M663398).
Declaration of conflicting interests
The authors declared no potential conflicts of interest with respect to the research, authorship, and/or publication of this article.
Data Availability Statement
The datasets used and/or analyzed during the current study available from the corresponding author on reasonable request.