
Abstract
Introduction
Three-dimension (3D) cell culture presents a promising alternative of drug-induced liver injury (DILI). To advance preclinical toxicology research, we developed an in vitro liver model using HepG2 for toxic evaluation.
Methods
The model was constructed based on the extracellular matrix. We assessed its long-term stability by monitoring the morphological change and anabolic capacity for 2 weeks, with functional analyses including albumin/urea production, lipid accumulation with Nile red staining, bile secretion with CLF signal, and transporter/enzyme expression including PGP, MRP2, BSEP, and CYP3A4.
Results
The model could be maintained for at least 10 days with enhanced hepatic synthetic functions indicated by albumin and urea nitrogen. Compared with the two-dimensional (2D) cultures, 3D culture exhibited enhanced lipid accumulation and biliary excretion. Key hepatic transporters PGP, MRP2, and BSEP and the metabolic enzyme cytochrome P450 3A4 were expressed between day 5 and 7. Single-exposure induced measurable apoptosis, mitochondrial disfunction and viability assays, while repeated treatment replicated impaired bile acid transport by reduced CLF intensity, and cytotoxicity with elevated AST, ALT, and decreased survival.
Discussion
Our 3D model surpasses conventional 2D systems in culture duration and functional complexity. It is suitable for DILI prediction after single- and repeated- treatment, which makes it particularly valuable for preclinical drug screening.
Introduction
Drug-induced liver injury (DILI) is a primary safety concern and a leading cause of drug development failure and market withdrawal. 1 Increasingly stringent ethical reviews require rigorous adherence to the 3R, and even 4R principles 2 during research, which entails replacing, refining, reducing and responsibility in animal models in preclinical studies. Moreover, animal models have a limitation of concordance among species, which hinders the sufficient prediction of DILI. 3 Therefore, constructing an effective in vitro model for DILI prediction is essential to compensate for the discrepancy between humans and animals. With the interdisciplinary development of biotechnology and toxicology, in vitro models become the potential alternatives of animal models to improve the accuracy of toxicity prediction at the early stage of drug development. 3 Owing to its inclusion in the scope of drug preclinical experiments by the US Food and Drug Administration in 2022, in vitro experiments are becoming significant in non-clinical research. 4 New emerging technologies, such as the application of organs, tissues, or cells as experimental materials, are promising experimental substitutes for traditional animal-based toxicity studies.
Recently, in vitro liver models based on three-dimensional (3D) culture technology have received significant attention. The 3D cultivation, constructed with the advanced cell culture technology and tissue engineering approaches, enhances in vitro hepatocyte metabolic function, thereby improves accuracy of DILI prediction. 5 To simulate the complexity of the liver environment in vitro, we constructed a 3D liver model in a scaffold simulating the extracellular matrix (ECM). As illustrated by previous research, ECM, including collagen, fibrin, and Matrigel, is commonly used in construction and bioprinting of alternative in vitro models. 6 The ECM-like 3D microenvironment formed by Matrigel better recapitulates the physiological and biochemical conditions compared to other scaffolds. By facilitating cell-cell and cell-ECM interactions 7 and extending the incubation period, 8 the model constructed by ECM is more suitable for repeated-treatment toxicity studies.
General toxicology study encompass dose exploration, single administration, and repeated administration tests, enabling a systematic and comprehensive evaluation of the toxicological properties of drugs. For acute toxic screening, various in vitro assays facilitate high-throughput screening and complex experimental design; however, repeated-treatment testing highly depends on animal models. 9 Evaluation of repeated-treatment effect remains challenging in toxic screening and risk assessment in vitro, while a long-time in vitro cultivation enables repeated exposure toxic screening and further toxicological study. Herein, to mimic the in vivo physiological environment, an in vitro liver model was constructed with Matrigel and HepG2 cell line. The stability and function of the model were profiled before evaluating the DILI of hepatotoxic drugs after single- or repeated-exposure.
Materials and methods
Cell culture
The human hepatocellular carcinoma cell line HepG2 was kindly provided by Stem Cell Bank, Chinese Academy of Sciences (Shanghai, China). The cells were grown in dulbecco’s modified eagle medium (DMEM, with sodium pyruvate, VivaCell, cat No:C3113-0500) supplemented with 10 % fetal bonus serum (FBS, Gibco), 1 % non-essential amino acids (NEAA, Gibco), 100 U/mL penicillin, and 100 µg/mL streptomycin at 37°C in a humidified atmosphere containing 5 % CO2. Cells were passaged every 2–4 days at a confluence of 80–90%.
3D liver model construction
Referring to a previous report, 8 Matrigel was premixed with the HepG2 cell suspension before seeding on 96-well plates at 10,000 cells/cm2. Following keeping in an incubator for 30 min, a medium was added for continuous culturing with Matrigel (final volume: 150 μL/cm2; final concentration: 5 mg/mL). Bright-field morphology and fluorescence distribution were observed using a high-content analysis system (PerkinElmer, Opretta cls) and microscope (Olympus IX71).
Cell number detection
Referring to a previous report, 10 cell proliferation was assessed through protein determination on day 2, 3, 4, 5, 6, 7, 10, and 14 using Pierce™ Rapid Gold BCA kits (ThermoFisher). Subsequently, the cell number was calculated according to the standard curve of cell and protein concentration.
Live/dead staining
A sensitive two-color fluorescence cell viability assay was selected to discriminate between live and dead cells using Calcein AM and BOBO-3 iodide (ThermoFisher), respectively. The live cell components produced an intense, uniform green fluorescence in live cells (Ex/Em 488/515 nm), and the dead cell components produced a predominantly nuclear red fluorescence (Ex/Em 570/602 nm).
Hepatobiliary transport function assessment
Hepatobiliary transport function assessment was performed on Days 3 and 7. We prepared the working solution of cholyl-lysyl-fluorescein (CLF) at 5 μM in a culture medium before adding it to each well and incubating for 1 h at 37°C, and the nucleus was stained with Hoechst 33342. CLF and Hoechst 33342 signals were detected at Ex/Em 488/515 and 358/461 nm, respectively.
Liver biomarkers and function detection
We collected supernatants on day 2, 3, 4, 5, 6, 7, 10, and 14 for albumin (ALB), urea nitrogen (UN), and lactate dehydrogenase (LDH) measurement according to the kit instructions. We detected lipid accumulation with Nile Red probe on day 4 through high-content analysis at Ex/Em 550/575.
Immunofluorescence detection
For in situ immunofluorescence staining, the intestinal membrane and 3D liver culture were washed with phosphate-buffered saline (PBS) thrice and fixed in 4 % paraformaldehyde for 30 min. Next, samples were permeabilized in PBS containing 0.5 % Triton X-100 (Solarbio) for 10 min and blocked with goat serum (Beyotime Biotechnology) for 30 min. Primary antibodies were applied to each well at a certain dilution referring to the manufacturer’s instruction and incubated overnight at 4°C. The primary antibodies used were anti-MRP2 (Abcam, ab172630,1:500), anti-ABCB11/BSEP (Abcam, ab255605,1:100), and anti-PGP (Proteintech, Cat No.25081-2-AP, 1:500), anti-CYP3A4 (ThermoFisher, MA5-17064,1:1000), and anti-Ki67 (CST, 9449S, 1:10000). Cells were washed and incubated with corresponding fluorescently conjugated secondary antibodies and co-localized with 4′,6-Diamidino-2-Phenylindole (DAPI). The secondary antibodies used were goat anti-rabbit IgG Alexa Fluor 488 (Abcam, ab150077,1:1000) and goat anti-mouse IgG Alexa Fluor 488 (Abcam, ab150113,1:1000). Results were evaluated through high-content analysis and fluorescence microscopy.
Single-exposure drug cytotoxicity detection
For single-exposure toxicity detection, the drugs were kept for 48 h. Positive drug included cyclosporin A (30 μM), benzbromarone (30 μM), acetaminophen (4000 μM), isoniazid (10,000 μM), troglitazone (30 μM), and sodium valproate (2000 μM). The control group received no medication, and the negative controls received drug-free medium, isosorbide dinitrate (84.7 μM) and eszolam (67.9 μM). Concentrations were selected based on prior in vitro studies and aimed to capture toxicity-relevant exposures, generally not exceeding 100-fold the reported human Cmax values. For positive drugs, concentrations were settled according to previous reports, which may induce cytotoxicity in vitro, whereas for negative drugs, we settled the concentration at 100 times the plasma concentration maximum. 11
Cell viability was tested using the Cell Titor Glo, and the toxicity and cell survival rate (%) were determined. For the two-dimensional (2D) cell model, cells were seeded in each well at 1 × 10⁴ and placed overnight before drug administration. The supernatant was discarded after drug treatment, and cell viability was determined. For 3D models, drugs were given on Day 3. After drug treatment, the supernatant was discarded, and cell recovery solution was added at 4°C for 1–2 h to fully depolymerize the gel. Cells were obtained through centrifugation (4°C, 1000 r/min, 5 min) before cell viability determination.
After drug treatment, medium was collected and the aspartate transaminase (AST), alanine transaminase (ALT), LDH, and ALB levels were determined according to the recommended kit instructions.
Oxazole yellow (YO-PRO-1)/propidium iodide (PI) was used to detect cell apoptosis/necrosis. Each well was treated with drug-free medium (control), benzbromarone (30 μM) or camptothecin (10 μM, positive control). Each well was treated with 48 before fluorescence detection at Ex/Em 498/509 and Ex/Em 535/617 nm.
Mitochondrial membrane potential was observed using tetramethylrhodamine ethyl ester (TMRE). Each wells were treated with drug-free medium (control), , benzbromarone (30 μM) or carbonyl cyanide m-chlorophenyl hydrazine (CCCP) (10 μM, positive control). Each well was incubated for 48 h. After drug treatment, TMRE and Hoechst 33342 fluorescence signals were detected at Ex/Em 550/575 and 350/461 nm, respectively.
Reactive oxygen species (ROS) was determined using CellROX (Thermofisher) to illustrate oxidative stress in the model. Each well was treated with Medium (drug-free), cyclosporin A (30 μM), benzbromarone (30 μM), acetaminophen (4000 μM), and troglitazone (30 μM). Each well was incubated for 48 h. After drug treatment, CellROX signals were detected at Ex/Em 498/509.
Repeated-exposure drug cytotoxicity detection
Referring to previous reports,12,13 drugs were given for repeat-exposure toxicity detection and each wells were treated with drug-free medium (control), troglitazone (15 and 7.5 μM), bosentan (15 and 7.5 μM), or cyclosporin A (1 and 0.5 μM).
Cell viability after 6 days of drug treatment was assessed with CellTitor Glo. In 3D models, drugs were administered for 6 days, and the medium was changed every 48 h. After drug treatment, the supernatant was preserved at −20°C, and the Matrigel was depolymerized using a cell recovery solution at 4°C for 1–2 h. Cells were obtained via centrifuge, and cell viability was determined with CellTitor Glo.
According to the recommended kit instructions, the AST, ALT, LDH, and ALB levels in supernatants were determined on day 2, 4, and 6. The hepatobiliary transport detection after 6 days’ treatment was detected as described in “Hepatobiliary transport function assessment” part with CLF probe, and probenecid (50 μM) was selected as positive control.
Statistic analysis
Continuous variables were presented as mean ± SD. The normality of data distribution was assessed with the Shapiro-Wilk test and P not less than 0.05 was considered evidence of normality, allowing for applying parametric tests (t-tests and ANOVA). Then, the homogeneity of variance was tested by Levene’s test, and P < 0.05 was considered inconsistent. Two tailed unpaired student's t-test was applied to investigate variations of Nile Red and cell viability results between two independent samples. For comparisons of cell viability after repeated administration in the liver model, post-hoc comparisons were conducted by one-way ANOVA using Bonferroni test when variance is consistent and Dunnett’s T3 when variance is inconsistent. For variables did not satisfy with normality distribution, nonparametric tests were adopted and Kruskal-Wallis H test was selected. For t-tests, Cohen’s d was calculated to quantify the magnitude of differences between groups. For ANOVA, partial eta-squared (η2) was used to estimate the proportion of variance explained by the independent variables. Data analysis was completed using SPSS version 25 (IBM Corporation). P < 0.05 was considered statistically significant.
Results
Construction and morphology of the 3D model
Following 3D liver model construction in Matrigel, we first assessed the growth status and morphology. Between 14-day cultivation, HepG2 cell initially showed uniformly distribution in the Matrigel, following by gradually expansion into spherical colonies (Figure 1(A)). To assess cell proliferation, we evaluated Ki67 signals and cell number, and the results showed that the Ki67 signal remained in the model on days 10 and 14 (Figure 1(B)), while the cell number exhibited an increasing trend (Figure 1(C)), indicating a continuous cell proliferation from day 1 to 14. Live/dead staining revealed an accumulation of dead cells on day 10 and 14 (Figure 1(D)), while LDH levels fluctuated steadily on day 1 to 7 (Figure 1(E)) and exhibited a sharp increase on day 10 and 14. These results demonstrate constant proliferation of the Matrigel-cultured HepG2, following by necrosis and slight cell damage on day 10 and 14. To minimize the interference of the injured cell with the liver injury detection test, we conducted the test within 10 days. Morphology of the 3D model (A) Bright field (bar = 500 μm). (B) Ki67 expression on days 10 and 14 (bar = 100 μm). (C) Cell number. (D) Live/dead staining (bar = 100 μm). (E) LDH levels. Data are shown as mean ± standard deviation, n = 3.
Detection of the liver function
To illustrate the hepatic functions of the model, we analyzed the liver anabolic biomarkers ALB, UN, and bile acid secretion. ALB (Figure 2(A)) and UN (Figure 2(B)) exhibited increasing trends on day 2–14, indicating enhanced overall metabolic function. Functions of the 3D model liver. ALB (A) and UN (B) secretion. (C) Analysis of Nile red/DAPI fluorescence in 2D and 3D liver cultivations. (D) Nile red/DAPI staining. (E) Detection of CLF/Hoechst 33342 (bar = 100 μm). Data are shown as mean ± standard deviation, n = 3.
Subsequently, lipid accumulation capacity was examined (Figure 2(C) and (D)) with Nile red. Compared with the 2D model, the Nile red fluorescence signal intensity increased in the 3D model, indicating a higher lipid accumulation level in the 3D model. Finally, bile acid secretion was examined with CLF, a fluorescein-labeled bile acid that can be transported across the canalicular membrane by a bile salt export pump and detected through its fluorescent signal. It is common in the qualitative and quantitative assessments of the bile ducts in hepatocytes. In the 3D model, CLF was undetectable on day 3; however, the signal accumulated inside the spheroid on day 7, indicating visible bile duct generation (Figure 2(E)).
The expression of transporters and metabolic enzymes was determined on day 5 and 7. Immunofluorescence staining showed scattered signals of functional transporters BSEP, MRP2, and PGP and metabolic enzyme cytochrome P450 (CYP) 3A4 (Figure 3), indicating the generation of these liver transporters and metabolic proteins. Distribution of transporter protein and metabolic enzyme in the liver model BSEP, MRP2, PGP, and CYP3A4 expression on days 5 and 7 (20X) (bar = 100 μm).
Single-exposure drug toxicity detection
Cell viability (%) after 48 h incubation (data are shown in mean ± standard deviation, n = 3).

Cell viability (%) after 48 h incubation (data are shown in mean ± standard deviation, n = 3).

Compared with relative level of Medium group, *: P < 0.05 versus medium group, **: P < 0.01 versus medium group.
Apoptosis and necrosis were labeled with YO-PRO-1 and PI, respectively (Figure 4(A)). Following 48 h treatment in the 2D and 3D models, necrosis signals were evident observed after camptothecin and benzbromarone treatment. The results indicated the model’s potential to simulate hepatotoxic drug-induced apoptosis and necrosis. Then, for mitochondrial function determination, TMRE was selected to evaluate the mitochondrial membrane potential. A strong TMRE signal was detected in the control group (Figure 4(B)); however, after treatment with positive control CCCP and benzbromarone, the TMRE signal disappeared, indicating impairment of the mitochondrial membrane function. Under the given concentration, both 2D and 3D models exhibited significant damage in the mitochondrial function without significant differences. These results demonstrate that the 3D model can effectively illustrate the change in mitochondrial function following treatment. Furthermore, we detected the oxidative stress of cyclosporine, benzbromarone, acetaminophen, and troglitazone after incubation for 48 h. We observed that ROS signal intensity was enhanced after 48 h exposure (Figure 4(C)). The results demonstrate that signals of necrosis, mitochondrial dysfunction, or oxidative stress in the model can be detected with fluorescent probes. Detection of apoptosis, necrosis, and ROS in liver models (A) YO-PRO-1, propidium iodide (PI), and Hoechst 33342 stainings of control, positive control camptothecin (10 μM), and benzbromarone (30 μM) after 48 h of incubation in the 2D and 3D liver models (bar = 100 μm). (B) TMRE and Hoechst 33342 staining signals of control, positive control CCCP (10 μM), and benzbromarone (30 μM) after 48 h of incubation in the 2D and 3D liver models (bar = 100 μm). (C) CellROX staining signals of control, cyclosporin A (30 μM), benzbromarone (30 μM), acetaminophen (4 mM), and troglitazone (40 μM) after 48 h of incubation in the 3D liver models (bar = 200 μm).
Repeated-exposure drug toxicity detection
Troglitazone, bosentan, and cyclosporin A were selected for repeated exposure for 6 days to induce cholestasis (Figure 5(A)). Probenecid was selected as the positive control to observe a downregulation of the CLF signal intensity. Troglitazone, bosentan, and cyclosporin A caused a decreased CLF signal intensity owing to their inhibition of bile acid secretion, indicating that the model simulated hepatic cholestasis caused by drug repeated treatment. Cytotoxic examination after repeated treatment in the 3D liver model. (A) Hepatobiliary transport detection in the 3D model. (B-D) Cell viability after repeated treatment and change of AST, ALT, ALB, and LDH levels during repeated exposure of troglitazone (B), bosentan (C), and cyclosporin A (D) for 6 days. Data are shown as the mean ± standard deviation, n = 3. *P < 0.05 versus control group, **P < 0.01 versus control group.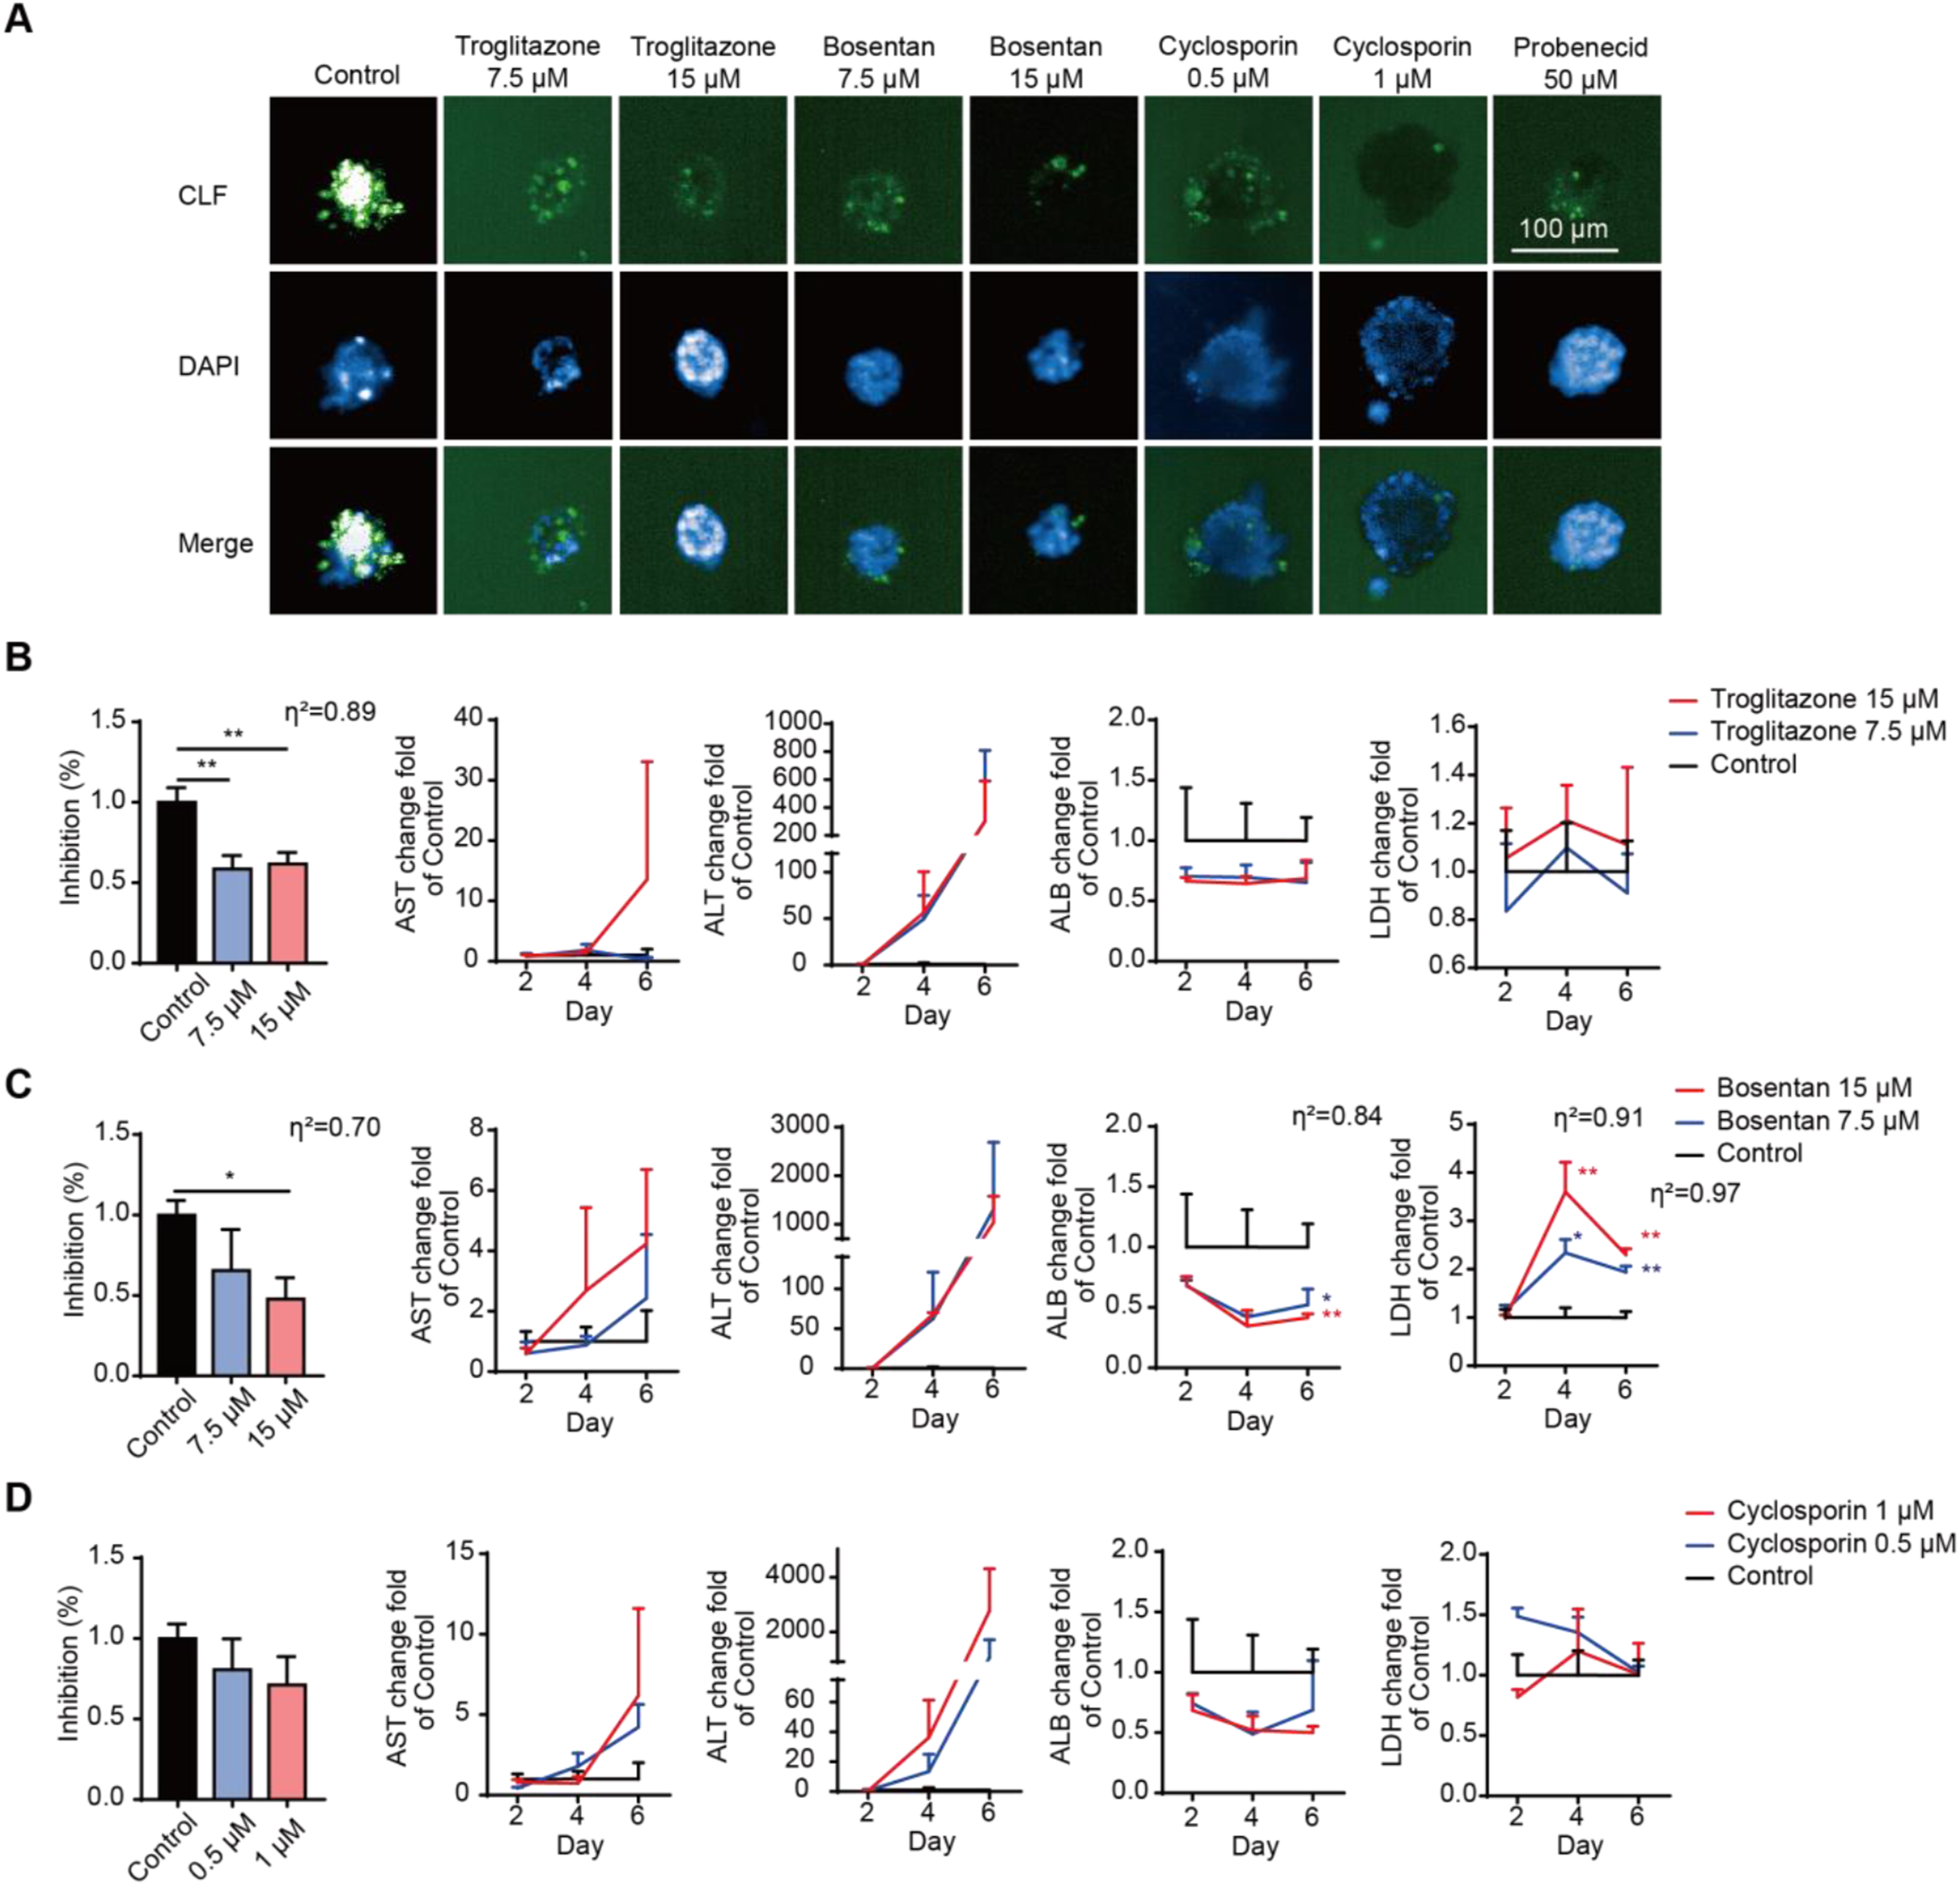
Cell viability after repeated treatment was assessed (Figure 5(B)–(D)) through ATP determination. The cell survival rate after troglitazone (P < 0.01, η2 = 0.89) and cyclosporin A treatment was less than 80 %, indicating strong cytotoxicity. Meanwhile, bosentan- and cyclosporin A-induced liver toxicity showed significant dependency.
Finally, cell supernatants on day 2, 4, and 6 were collected for AST, ALT, ALB, and LDH evaluation (Figure 5(B)–(D)). Troglitazone, bosentan, and cyclosporin A induce elevation of AST and ALT levels at high concentration. Notably, bosentan and cyclosporin A caused concentration-dependent increases in AST and ALT levels, consistent with the cell viability. Bosentan treatment significant increased LDH levels compared to control, whereas troglitazone and cyclosporine A treatment had no effect. In contrast, all hepatotoxic compounds reduced ALB levels, with bosentan treatment showing a significant ALB decrease. These results indicate the model’s utility for monitor drug-specific hepatic toxicity patterns during repeated treatment. Integrating the single-exposure results revealed biomarker-specific sensitivity patterns under repeated treatment. Notably, ALB and ATP demonstrated greater sensitivity than AST, ALT, and LDH, consistent with our previous observations.
Discussion
DILI is a liver injury that occurs after exposure to prescription-only or over-the-counter medicines, herbs, and xenobiotics. 15 The mechanisms of DILI include mitochondrial damage, inhibition of biliary efflux, lysosomal impairment, reactive metabolites, endoplasmic reticulum stress, and immune system-based liver injury. 16 In this study, we used HepG2 to establish a 3D cell culture model in the Matrigel scaffold, and the cell viability and liver functions were stable for 10 days. Compared with the 2D culture, the Matrigel-based 3D model can be sustained longer. We tested the capacity of cytotoxic prediction, and the results indicated the 3D model is suitable for single- and repeated-exposure.
The HepG2 cell line retains most of the metabolic functions of hepatocytes and is common in drug screening 17 ; hence, our 3D model was constructed based on HepG2. The 3D cultivation enables better distribution of cell, nutrients, and oxygen compared to conventional 2D cultivation. 18 In the 2D model, cell proliferation is largely limited by internal architecture, 18 while the 3D scaffold facilitates spontaneous formation of spherical multicellular aggregates from individual or adjacent cells. 19 In this model, HepG2 proliferated continuously in the Matrigel scaffold, developing homogeneous spherical structure. Cell distributed across multiple scaffold layers, growing in different directions, accompanied by rapidly proliferation between day 6–14. Taha et al. 18 attributes the increasing cell density to the increased scaffold structure, consistent with a high cell density observed in Matrigel scaffold in our study. Park et al. 20 alerts that the indefinite proliferation of carcinomic cell line can restrict nutrient diffusion and an oxygen gradient towards the necrosis core when constructing 3D models with cancer cell lines. Considering the change of signal distribution of dead cells and the LDH levels, we kept the model within 10 days for drug toxicity testing.
Hepatobiliary secretion, fat storage, and metabolism are the substantial physiological functions of the liver. 21 To illustrate the physiological function of the 3D liver model, we profiled the liver function biomarkers, hepatobiliary secretion function, transporter expression, CYP3A4 metabolic enzyme expression, and lipid distribution of the model. ALB and UN secretion cover specific hepatic organellular functions, which may offer an aspect of the health state of hepatic cells. 22 In the 3D model, ALB and UN levels showed an increasing trend, indicating the increasing hepatic functions (synthesis and metabolism) of the model. Subsequently, the hepatobiliary secretion function was manifested with CLF, which cannot be detected in the traditional 2D culture method. 8
The unique polarization arrangement is another crucial factor in preserving the specific function of the liver. To reflect polarity formation, we evaluated the expression of BSEP, a transporter expressed on the tubular membrane of hepatocytes. 23 We observed the scatter distribution of BSEP involved in liver spheroid on day 5, following the observed PGP and MRP2 expression in the model. The model also metabolic enzyme CYP3A4, the most abundant phase I enzyme which metabolizes approximately 50 % of marketed drugs. 24 Meanwhile, the lipid distribution in the 3D cultivation was higher than that of 2D cultivation, consistent with previous reports. 24 The 3D model efficiently performed liver functions, including ALB secretion,8,25 UREA production, 8 bile acid secretion, 8 and lipid accumulation.25–27 The increasing lipid accumulation illustrated by Nile red, a selective dye for cytoplasm lipid droplets that exhibits yellow-gold fluorescence, 28 is consistent with patterns in previous liver spheroids. 27 The model maintained robust synthetic and metabolic functions for 10 days, exhibiting polarized morphology and functional bile secretion.
After stability and functional profiling, we tested the response to hepatotoxicity compounds of the model. The mechanism of DILI includes mitochondrial damage, inhibition of biliary efflux, lysosomal impairment, reactive metabolites, endoplasmic reticulum stress, and immune system-based liver injury. 16 Referring to the LiverTox database, 14 a source of hepatotoxic drug details about related hepatotoxic parameters, mechanism, and clinical examples, we selected hepatotoxic drugs with clear hepatotoxicity mechanisms and different toxic mechanism as test compounds. Two negative drugs were selected as control. Concentrations we used referred to previous reports, where researcher observed obvious significant cytotoxicity of cyclosporin A, 29 benzbromarone, 30 acetaminophen, 31 isoniazid, 32 troglitazone, 33 and sodium valproate. 34 For acetaminophen, 35 isoniazid, 36 and troglitazone,37,38 the toxic mechanisms are believed to involve active metabolites, whereas valproate toxicity is associated with disrupted oxidation and mitochondrial function. 34 Cyclosporin A disrupts liver metabolism process, primarily by impairing the vectorial transport of biliary components from blood to bile. 39 In contrast, benzbromarone influences mitochondrial function, ultimately triggering apoptosis and subsequent necrosis. 40 We determined cell viability through ATP qualification, a method unaffected by spheroid morphology and equally reliable in 2D and 3D model. 41 The 3D model accurately detected hepatotoxicity at test concentrations for positive drugs, while showing no significant toxicity for negative controls even at 100-fold the maximum blood concentration. DILI can result from direct cytotoxicity of xenobiotics and their metabolites, 42 triggering oxidative stress in the endoplasmic reticulum and mitochondria. Oxidative stress disrupts cell homeostasis, ultimately leading to cell death via apoptosis or necrosis. 43 Mitochondria function plays an important role in the process, 44 and regulates multiple signaling pathways in maintaining cellular homeostasis. Notably, mitochondrial dysfunction is a sensitive indicator of mitochondrial integrity. 45 In our 3D model, cell apoptosis/necrosis and decreased mitochondrial membrane potential was manifested after treatment, reflecting the strong liver toxicity of benzbromarone in a previous study. 46 Cyclosporine A, 47 benzbromarone, 48 acetaminophen, 49 and trolitazone 50 treatment enhanced oxidative stress, corresponding to the references. However, since cell death is a common endpoint of acute liver failure and general toxicity, 51 the model cannot fully distinguish hepatotoxicity from traditional cytotoxicity.
To supply the cytotoxic and dysfunction of 3D liver model, we adopted liver biomarker AST and ALT, cellular damage biomarker LDH, and liver function biomarker ALB, to trace the ongoing damage and reflect the cell state. AST and ALT responses to liver dysfunction in clinic. 52 LDH, a non-specific marker of cellular damage, rarely selected as liver disease indicator even liver disease/injury results in elevation of LDH. 53 ALB synthesis occurs in the liver hence it’s considered a biomarker of the liver’s synthetic function indicator. 53 Changes in ALB and ATP level reflected the hampered synthetic function and cell viability of all the positive compound, respectively. LDH indicated the toxicity about three of the compounds, while AST and ALT failed to reflect the cytotoxicity. We attributed the discrepancies to the sensitivity difference of the indicators. In Forster’s report, 54 ALB is a highly sensitive toxicity biomarker for acetaminophen in liver-chips when compared to ATP, α-GST, and miR-122, while in Kwon’s study, 55 ALB showed liver dysfunction at lower concentration than that of AST, ALT and LDH. In our study, ATP and ALB was more sensitive to hepatocyte toxicity than AST, ALT and LDH, and the accuracy of ATP and ALB was consistent.
Compared with the 2D model, the 3D model enables longer cultivation and exhibits bile acid secretion function. Based on the model’s feature, we assessed repeated-exposure hepatoxicity and cholestasis. Cyclosporin A, bosentan, troglitazone, and their metabolites inhibit the activity of the efflux transporter, causing bile acid accumulation and hepatocellular injury 12 ; herein, we selected them as test compounds referring to previous report. 12 Probenecid, an MRP2 inhibitor,12,56 was selected as positive control.56,5 We utilized CLF, a bile acid analog affected by the transporters OATP1B3 and MRP2, 57 to trace bile acid secretion 12 and identify drug-induced cholestasis. 58 Reduced CLF signal intensity manifested drug-induced cholestasis in the 3D model, consistent with in vitro models after bile acid transports inhibited.12,13,59,60 Meanwhile, to continuously monitor the ongoing liver injury process, AST, ALT, LDH and ALB was adopted to trace the change of cell viability during the repeated-exposure. Since ATP assay will lead to complete lysis of all cells in the ATP assay, 41 we detected the parameter at the endpoint. The observed decrease in ATP and ALB levels, coupled with elevated AST, ALT, and LDH levels, demonstrated significant hepatotoxicity and liver dysfunction induced by the test compounds. This study demonstrated that the 3D model can be used for DILI testing of repeated administration and the detection of drug-induced cholestasis.
Comparison of hepatotoxic effects in vivo and in vitro.

Despite improved hepatocyte viability and bile acid secretion in 3D culture, the HepG2-derived model maintained cell line-specific constraints. Firstly, basal activities of drug-metabolizing enzyme (particularly CYP enzymes) in HepG2 are significantly lower compared to primary hepatocytes, resulting in potential underestimate of compound cytotoxicity.72,73 Second, the liver is complex multicellular organ, 74 systems incorporating non-parenchymal cells are more capable of replicating the complex cellular composition. Such system includes in vitro co-culture models of hepatocytes and non-parenchymal cells, 5 or pluripotent stem cell-derived system. 75 In our model, while HepG2 effectively simulates liver parenchymal component, the absence of non-parenchymal cells limits its ability to predict their potential contribute to liver toxicity. To address these limitations, construct the model with stem cell induced or primary hepatocyte culture with non-parenchymal ingredients may be more physiologically relevant.
Conclusion
We cultured HepG2 in a Matrigel-formed ECM to form an in vitro matrix to establish a 3D cell culture model for hepatotoxicity analysis. The morphology and function results showed that HepG2 cells in Matrigel can form a stable spherical structure, which owes a strong liver synthesis function. The model expressed PGP, MRP2, BSEP, and the CYP3A4 enzyme and exhibited typical hepatic physiological functions, including the secretion of bile acids and lipid storage and metabolism. The 3D culture model maintained a longer cultivation time in vitro, more cell accommodation, and a stronger fat storage function than the 2D model. In addition, it performed bile acid secretion function, a characteristic not exhibited by the 2D model. Finally, we simulated DILI after single and repeated dosages. After a single treatment, the cell survival rate of drug treatment, mitochondrial membrane potential detection, and apoptotic/necrotic cell staining showed a similar trend to that of previous reports. The cholestasis and liver toxicity caused by positive drugs after repeated treatment indicate that this model can be used for DILI tests using single or repeated exposure.
Footnotes
Ethical statement
Author contributions
Yue Yu: Conceptualization, Methodology, Investigation, Data curation, Formal analysis, Visualization, Writing - original draft; Haodong Zhong: Methodology and investigation; Qianyi Niu: investigation; Manman Zhao: Writing; Bo Li: Conceptualization, Funding acquisition; Xiaobing Zhou: Conceptualization, Funding acquisition, Project administration, Supervision, Writing - review & editing.
Funding
The authors disclosed receipt of the following financial support for the research, authorship, and/or publication of this article: This work was financially supported by the National Key Scientific Instrument and Equipment Development Projects of China during the 14th Five-year Plan Period (Grant No. 2022YFF0711100), State Key Laboratory Project (2023SKLDRS0129) and Beijing Science and Technology Planning Project (Z231100007223001).
Declaration of conflicting interests
The authors declared no potential conflicts of interest with respect to the research, authorship, and/or publication of this article.
Data Availability Statement
The data are available when acquired.
Cell line authentication or contamination checks
The human hepatocellular carcinoma cell line HepG2 was kindly provided by Stem Cell Bank, Chinese Academy of Sciences (Shanghai, China). Cells were obtained from a certified cell bank and used as-is without further authentication or contamination screening.