
Abstract
Objective of the Research
Air pollution is a universal issue and has significant deleterious effects on both human health and also environment. The important indicators of air pollution include ozone (O3), particulate matter (PM), nitrogen dioxide (NO2), and sulfur dioxide (SO2). This research aims to investigate the impacts of ambient air pollution (AAP), SO2, and O3 on oxidative stress parameters, liver tissue histopathology, and expression of some carcinogenesis-related genes in the hepatic tissue of rats.
Materials and Methods
32 Wistar rats were randomly allocated to four groups: the control group, the AAP group, the SO2 group (10 ppm), and the ozone group (0.6 ppm). Over a period of five consecutive weeks, the rats were exposed to the specified pollutants for 3 h daily; liver tissues were harvested and instantly fixed with formalin. Pathological changes were assessed in the tissue samples. Additionally, the RT-qPCR technique was utilized to investigate Expression alterations of BAX, p-53, BCL2, caspase-3, caspase-8 and caspase-9. Furthermore, 30 milligrams of hepatic tissues were extracted to assess the activities of oxidative stress enzymes.
Results
The liver catalase and MDA activity were elevated in the air pollution (p < .05). Also, liver GPx activity in air pollution and ozone groups was significant in comparison to the control group (p < .05). The SO2 group exhibited severe lesions in histopathology examinations.
Conclusions
The findings revealed an alteration in liver histopathology, an induction of oxidative stress, and the expression of some apoptosis-related genes in hepatic tissues after exposure to AAP, SO2, and O3.
Introduction
Air pollution is a universal concern of recent decades that has a remarkable toxicological impact on both human health and the environment. Approximately 4.3 million and 3.7 million people, respectively, expired from household and ambient air pollution (AAP), most of whom are from Asia. The concentration of air pollutants in Iran has elevated since the 1970s with the beginning of industrialization and reached alarmingly hazardous levels in cities such as Tabriz, Tehran, etc. Air pollution is result of different sources, including large quantities of emissions from industrial activities, motor vehicles, automobiles, cigarettes, etc.1–4 In the past decades, Epidemiological investigations have linked exposure to AAP with significant health consequences.5–7
Ambient particulate matter (PM) is a hazardous mix of gaseous components and small-sized particles with different physiochemical properties.5,8,9 The important indicators of air pollution include ozone (O3), PM, nitrogen dioxide (NO2), and sulphur dioxide (SO2). Exposure to air pollutants, including PM, and also SO2, O3, and NO2, is associated with Serious health effects. 10
Evidence of literature indicates that air pollution is associated with non-communicable diseases, initiation of oxidative stress and systemic inflammation and also has detrimental health effects and is a notable concern for the worldwide population.11–13
Primary air pollutants include SO2, particulate matter 2.5 (PM2.5), particulate matter 10 (PM10), NO2, O3, carbon monoxide (CO), and lead. The aerosol PM sizes are recognized based on the aerodynamic diameter and expressed in micrometers and include particulate matter 0.1 (PM 0.1), PM10, and PM2.5. PMs encompass constituents such as elemental or organic carbons, sulphates, metals, nitrates, and various other components. PMs are primarily produced through fuel combustion and the suspension of organic matter and crustal. However, secondary PMs develop due to the photochemical reactions of PMs present in the atmosphere. These reactions occur when pollutant gases like SO2 and ammonium nitrate nucleate.6,10,14–16 O3 is a colourless gas and phytotoxic pollutant. O3 is the chemical formula of O3. Both the ground level and layer of the troposphere encompass O3. This gas has deleterious effects on human health and is a strong oxidant.17–20 O3, at ground level, is mainly produced through photochemical reactions and is a transboundary pollutant. Further increases in O3 concentrations are anticipated in developing regions.10,21,22 SO2 is a kind of Air pollutant characterized by a pungent odour that is primarily generated through the combustion of fossil fuels rich in sulphur content. It is a colourless gas that is extensively generated in various industrial applications.10,23 Inhalation of SO2 can induce oxidative stress, increase inflammatory and coagulation biomarkers, alter heart rate variability, cause immune imbalance and may enhance susceptibility to allergens.24–28 Recent evidence revealed that health effects are associated with notably lower SO2 concentrations than previously thought, and it is believed that reducing SO2 concentrations decreases exposure to co-pollutants, and it remains a significant air pollution issue in many developing countries. At present, limited studies have examined the health impacts of SO2, particularly in areas characterized by elevated SO2 levels.10,29–31
Experimental investigations have revealed that air pollution exerts detrimental effects on cellular and organ systems in both humans and animals, leading to many diseases. These effects encompass oxidative stress, inflammatory responses, and DNA damage.32–34 Emerging evidence suggests that Oxidative stress, in conjunction with inflammation, is a central mechanism of action for the health effects of air pollutants.35,36 PM has the capability to trigger numerous consequences on a cellular level, encompassing inflammation and DNA impairment and also fluctuations in genomic stability. 37
Animal models have been extensively utilized to investigate the connection between exposure to particulate air pollutants in the environment, owing to their availability, cost, and also the ability to study genetically modified strains.
After reviewing on literature, there are limited studies examining impacts of air pollutants on hepatic tissue and given the established connection between exposure to air pollution and an elevated risk of DNA damage and carcinogenesis, this research is designed to examine the impacts of air pollutants on liver tissue histopathology and role of them in altering oxidative stress markers and also expression apoptotic-related gens.
Materials and methods
Animals
The examinations were conducted on adult Wistar male rats (180-220 g) purchased from the Pastor Institute (Karaj, Iran). The rats were maintained in special cages in a room and fed a standard diet. The rats were maintained under normal laboratory conditions (12 h light/dark cycle) and a constant temperature (22 ± 2°C) and humidity (40- 60 %). The animals were provided access to water and food. The study protocol was registered and approved by the Research Ethics Committees of Laboratory Animals – Tabriz University of Medical Sciences (Approval ID: IR.TBZMED.VCR.REC.1399.207).
Procedures
The rat subjects were randomly allocated to four groups (each group consisting of eight rats) as follows: • The control group: rats in this group were placed under filtered air conditions only. The HEPA and activated carbon filters (Panam Azma, Iran) were used for the control groups' air filtration. The pollutants (SO2, O3 and P2.5) levels of the control group were in undetectable levels. • The SO2 group: rats were exposed to 26 mg/m3 SO2 (10 ppm) for 5 weeks (3 h per day). A handmade glass chamber (40 × 50 × 60 cm3) equipped with bottom and top vents was used. Two 50-L SO2 cylinders (120 bar pressure) with a flow rate of 1 L/min were used to provide the exposure chamber’s SO2. The composition of the gases in the chamber was N (79.5%), O2 (20.5%), and SO2 (0.002%). An SO2 detector tube with a measuring range of 2-30 ppm (GASTEC No.5La) was used for the daily detection of the chamber SO2 concentration. The temperature was 22 ± 1°C with normal atmospheric pressure. • The O3 group (oz): in this group, the rats were exposed to O3 (1.18 ± 0.19 mg/m3; 0.6 ± 0.1 ppm) in a chamber described before for 5 weeks (3 h/day). An O3 generator system (Afra Sanat, Iran) produced the O3. The chamber’s O3 concentration was measured by a detector (Eco Sensors, model A-21ZX-USA) every day. • The AAP group: rats were placed in a high-traffic city square of the Tabriz city centre (Abresan square, Tabriz, East Azerbaijan, Iran) close to the air pollution recorder station for 3 h a day for five weeks.13 The air pollution report during the investigation period is shown in Table 1.
38
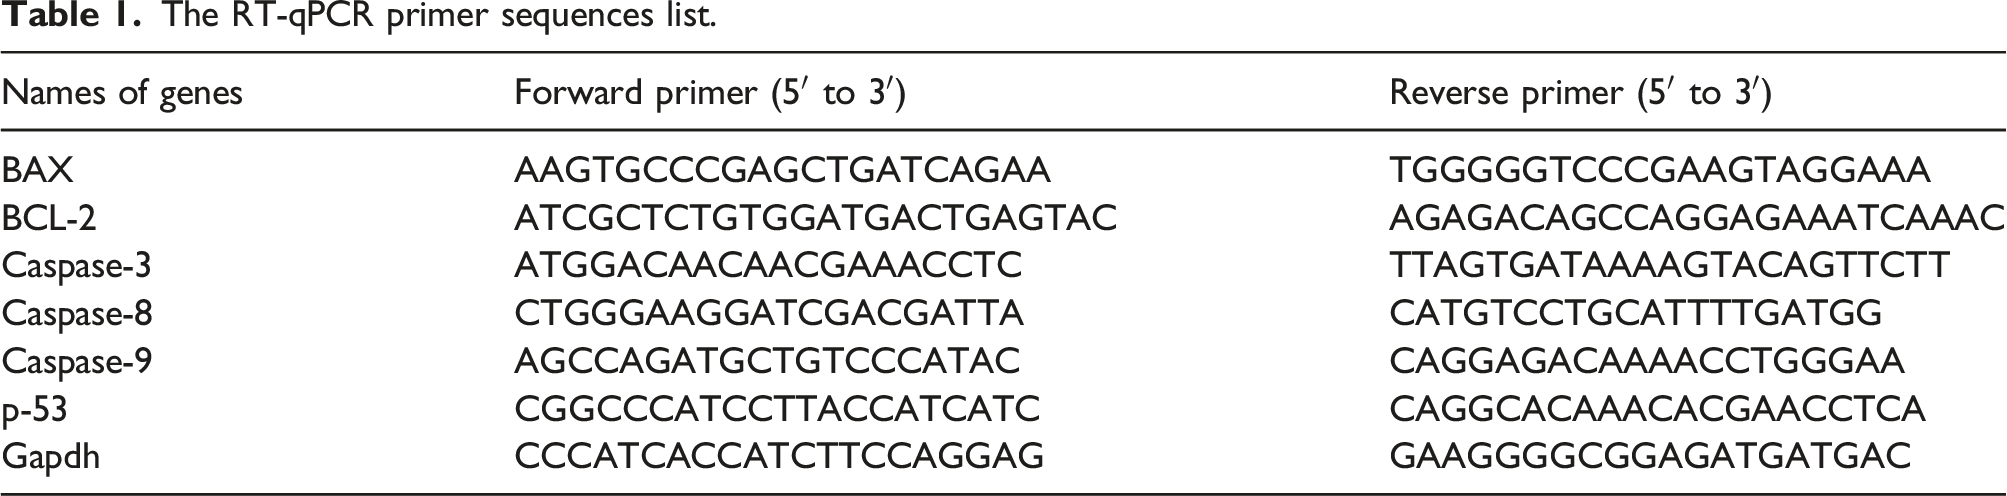
The RT-qPCR primer sequences list.
Twenty hours after the last intervention, the rats were anesthetized by administrating a combination of Ketamine (used dose: 60 mg/kg IP) and Xylazine (used dose: 10 mg/kg IP) and blood samples were then collected and centrifuged at 3000 g for 10 min. In next step, the serum of the samples was separated and stored in a −70°C freezer. Liver samples were taken and placed in formalin fixative solution and −70°C freezer.
Biochemical analysis
After a twenty-hour exposure period, animals were anesthetized, and then blood samples were collected by cardiac puncture under anesthetic using a combination of Ketamine and Xylazine (used dose: 60/10 mg kg-1 IP, respectively) 39 and then transferred into tubes containing ethylene-diamine-tetra acetic acid (EDTA) and clot tubes for hematological and biochemical analyses. The clot tubes were centrifuged (3000 g, 10 min), and the blood serum samples were separated and stored in a deep-freezing unit (−70°C). Commercial biochemical kits (Pars Azmun, Karaj, Iran) with enzymatic methods and an automated biochemistry analyzer (Abbott, Alcyon 300, USA) were utilized for biochemical analysis. Blood samples were ascertained by enzyme-linked immunosorbent assay (ELISA) technique by using rat commercial ELISA kits (Eastbiopharm, Hangzhou, China) and Awareness ELISA plate reader (Statfax 2100, USA).
Histopathological examination
Following routine processing, formalin-fixed tissue samples were sectioned and then subjected to hematoxylin and eosin (H&E) staining. Subsequently, the stained sections were assessed microscopically using a light microscope (Olympus, Japan). The tissue samples were analyzed for the presence of various pathological alterations, 40 including sinusoidal and vascular congestion, hemorrhage, hepatocyte degeneration, necrosis, inflammatory cell infiltration, and fibrosis.
Reverse transcription-quantitative polymerase chain reaction (RT-qPCR)
The RT-qPCR method was utilized to quantify the differential expression of some genes related to apoptosis/survival, including BAX, p-53, BCL-2, and caspases (3, 8, and 9). 30 milligrams of kidney tissue were used for total RNA extraction using a commercially available extraction kit (NucleoSpin, Macherey-Nagel, Ulm, Germany), and cDNA was synthesized using a commercially available kit (REVERTA-L RT kit, InterLabServices, Moscow, Russia). Real-Time PCR System (StepOnePlus™, Applied Biosystems, US) and 2X SYBR Green pre-mix (Amplicon, Brighton, UK) were used for RT-qPCR assay. The primer sequences list of RT-qPCR is shown in the Table 1. The mean expression level of each group was expressed as a decrease or increase relative to the control group. The final result has been presented as an arbitrary unit with a value of 1.
Statistical analyses
Data were analyzed using SPSS (Statistical Package for the Social Science) for Windows, version 19. The data between the groups were compared with a One-way analysis of variance, followed by the Tukey post-hoc test. The overall significance of the study was assessed at p < .05.
Results
AAP pollutants
AAP pollutants concentrations (mean ± SD) during 5 weeks of study (reported for Tabriz Abrasan station by the Iranian AAP monitoring system).

Data are presented as mean ± standard deviation.
Biochemical findings
The mean Albumin and Protein plasma levels of the examined groups are depicted in Figure 1. The difference in Albumin plasma level of the Air Pollution group was statistically significant as compared to the control group (p < .05). The mean Protein plasma level of the Air Pollution group was remarkably higher relative to the control group (p < .05). Effects of SO2 (10 ppm), O3 (0.6 ± 0.1 ppm), and AAP inhalation (for 5 weeks) on Albumin and Protein plasma levels of the rats (n = 8). Data are articulated as mean ± S D. * denotes a statistically significant difference compared to the control group (p < .05).
The mean AST and ALT plasma levels of the experimented groups are presented in Figure 2. The difference in ALT plasma level of the Air Pollution group was statistically remarkable as compared to the control group (p < .05). Mean AST plasma levels of the SO2 group were remarkably higher relative to the control group (p < .05). Effects of SO2 (10 ppm), O3 (0.6 ± 0.1 ppm), and AAP inhalation (for 5 weeks) on AST and ALT plasma levels of examined rats (n = 8). Data are articulated as mean ± S D. * denotes a statistically significant difference compared to the control group (p < .05).
The mean ALP plasma levels of different groups are depicted in Figure 3. The differences in ALP plasma levels of the examined groups were not statistically notable as compared to the control group (p > .05). Impacts of SO2 (10 ppm), O3 (0.6 ± 0.1 ppm), and AAP inhalation (a period of five consecutive weeks) on ALP plasma levels of examined rats (n = 8). Data are articulated as mean ± S D.
The mean GGT plasma levels of different groups are depicted in Figure 4. The differences in GGT plasma levels of the examined groups were not statistically significant as compared to the control group (p > .05). Impacts of SO2 (10 ppm), O3 (0.6 ± 0.1 ppm), and AAP inhalation (for 5 weeks) on Liver GGT plasma levels of examined rats (n = 8). Data are articulated as mean ± S D.
Oxidative stress parameters
The Mean catalase activity in the hepatic samples of different groups is depicted in Figure 5. The liver catalase activity of the Air Pollution group was remarkably higher as compared to the control group (p < .05). Effects of SO2 (10 ppm), O3 (0.6 ± 0.1 ppm), and AAP inhalation (for 5 weeks) on Liver Catalase activity of the rats (n = 8). Data are articulated as mean ± S D. * denotes a statistically significant difference compared to the control group (p < .05).
The mean liver MDA activity of different groups is depicted in Figure 6. The liver MDA activity of the Air Pollution group was remarkably lower as compared to the control group (p < .05). Effects of SO2 (10 ppm), O3 (0.6 ± 0.1 ppm), and AAP inhalation (a period of five consecutive weeks) on Liver MDA activity of examined rats (n = 8). Data are articulated as mean ± S D. * denotes a statistically significant difference compared to the control group (p < .05).
The mean liver SOD and GPx activity of different groups is depicted in Figure 7. The liver GPx activity of the Air pollution group is remarkably higher as compared to the control and O3 groups (p = .008). The liver GPx activity of the O3 group is higher relative to the control group (p < .05). Effects of SO2 (10 ppm), O3 (0.6 ppm), and AAP inhalation (a period of five consecutive weeks) on Liver SOD and Liver GPx activities of examined rats (n = 8). Data are articulated as mean ± S D. * denotes a statistically significant difference compared to the control group (p < .05). ** denotes Statistically significant relative to control and O3 groups (p = .008).
The Mean liver TAC activity in hepatic samples of different groups is depicted in Figure 8. The differences in liver TAC activity of the examined groups were not statistically significant as compared to the control group (p > .05). Effects of SO2 (10 ppm), O3 (0.6 ± 0.1 ppm), and AAP inhalation (a period of five consecutive weeks) on Liver TAC activity of examined rats (n = 8). Data are articulated as mean ± S D.
Histopathological findings
Healthy control rats presented a normal liver with a uniform distribution pattern of polyhedral hepatocytes radiating outwards from the central vein towards the periphery. By contrast, the experimental groups exhibited some pathological lesions with occasional instances of mild, moderate, and severe grades in the O3, air pollution, and SO2 recipient groups, respectively. There were notable disparities among the three experimental groups. The observed lesions included sinusoidal and vascular congestion, hemorrhage, hepatocyte degeneration, and focal necrosis. Mild inflammatory cell infiltration and no fibrosis were observed in all three experimental groups (Figure 9). Liver, rat. (A) Control group: normal liver structure (cv: central vein); (B) O3 group: mild pathological alterations, including vascular congestion (arrows) and focal necrosis (arrow head); (C) Air pollution group: moderate pathological alterations, including vascular congestion (arrows) and focal necrosis (arrow head); (D) SO2 group: severe pathological alterations, including vascular congestion, hemorrhage (arrows), and focal necrosis (arrow head). H&E.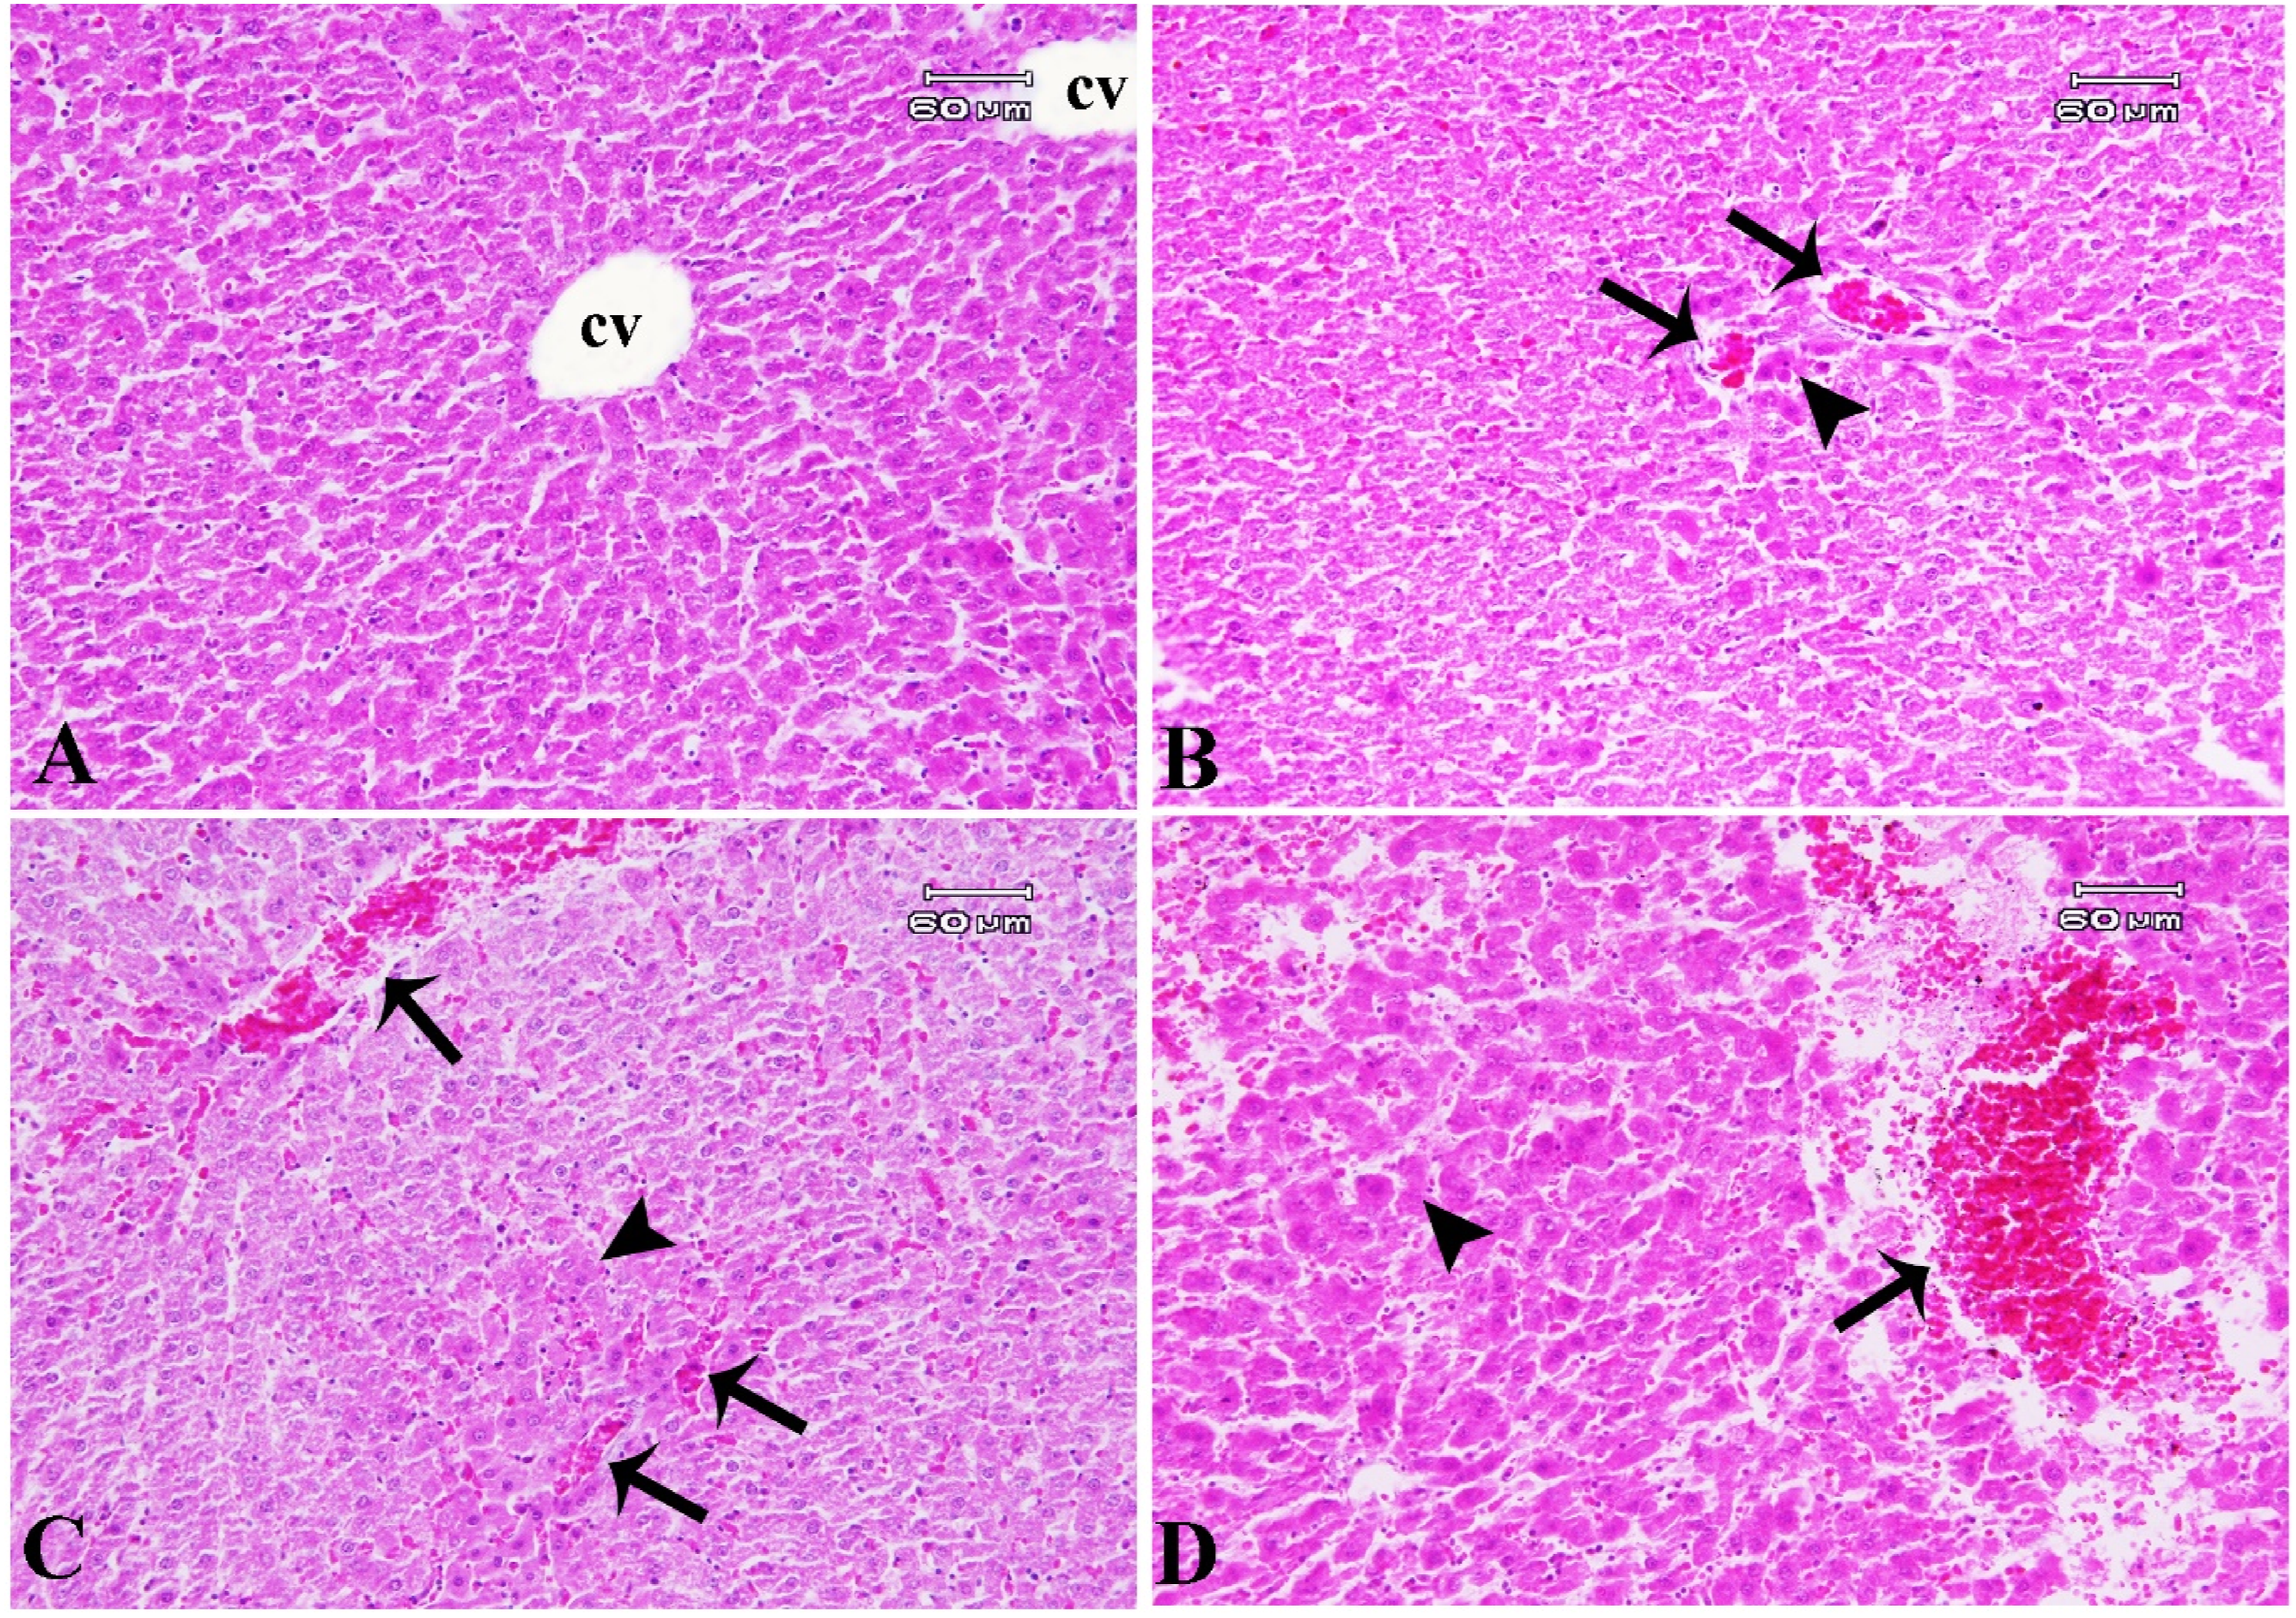
RT-qPCR results
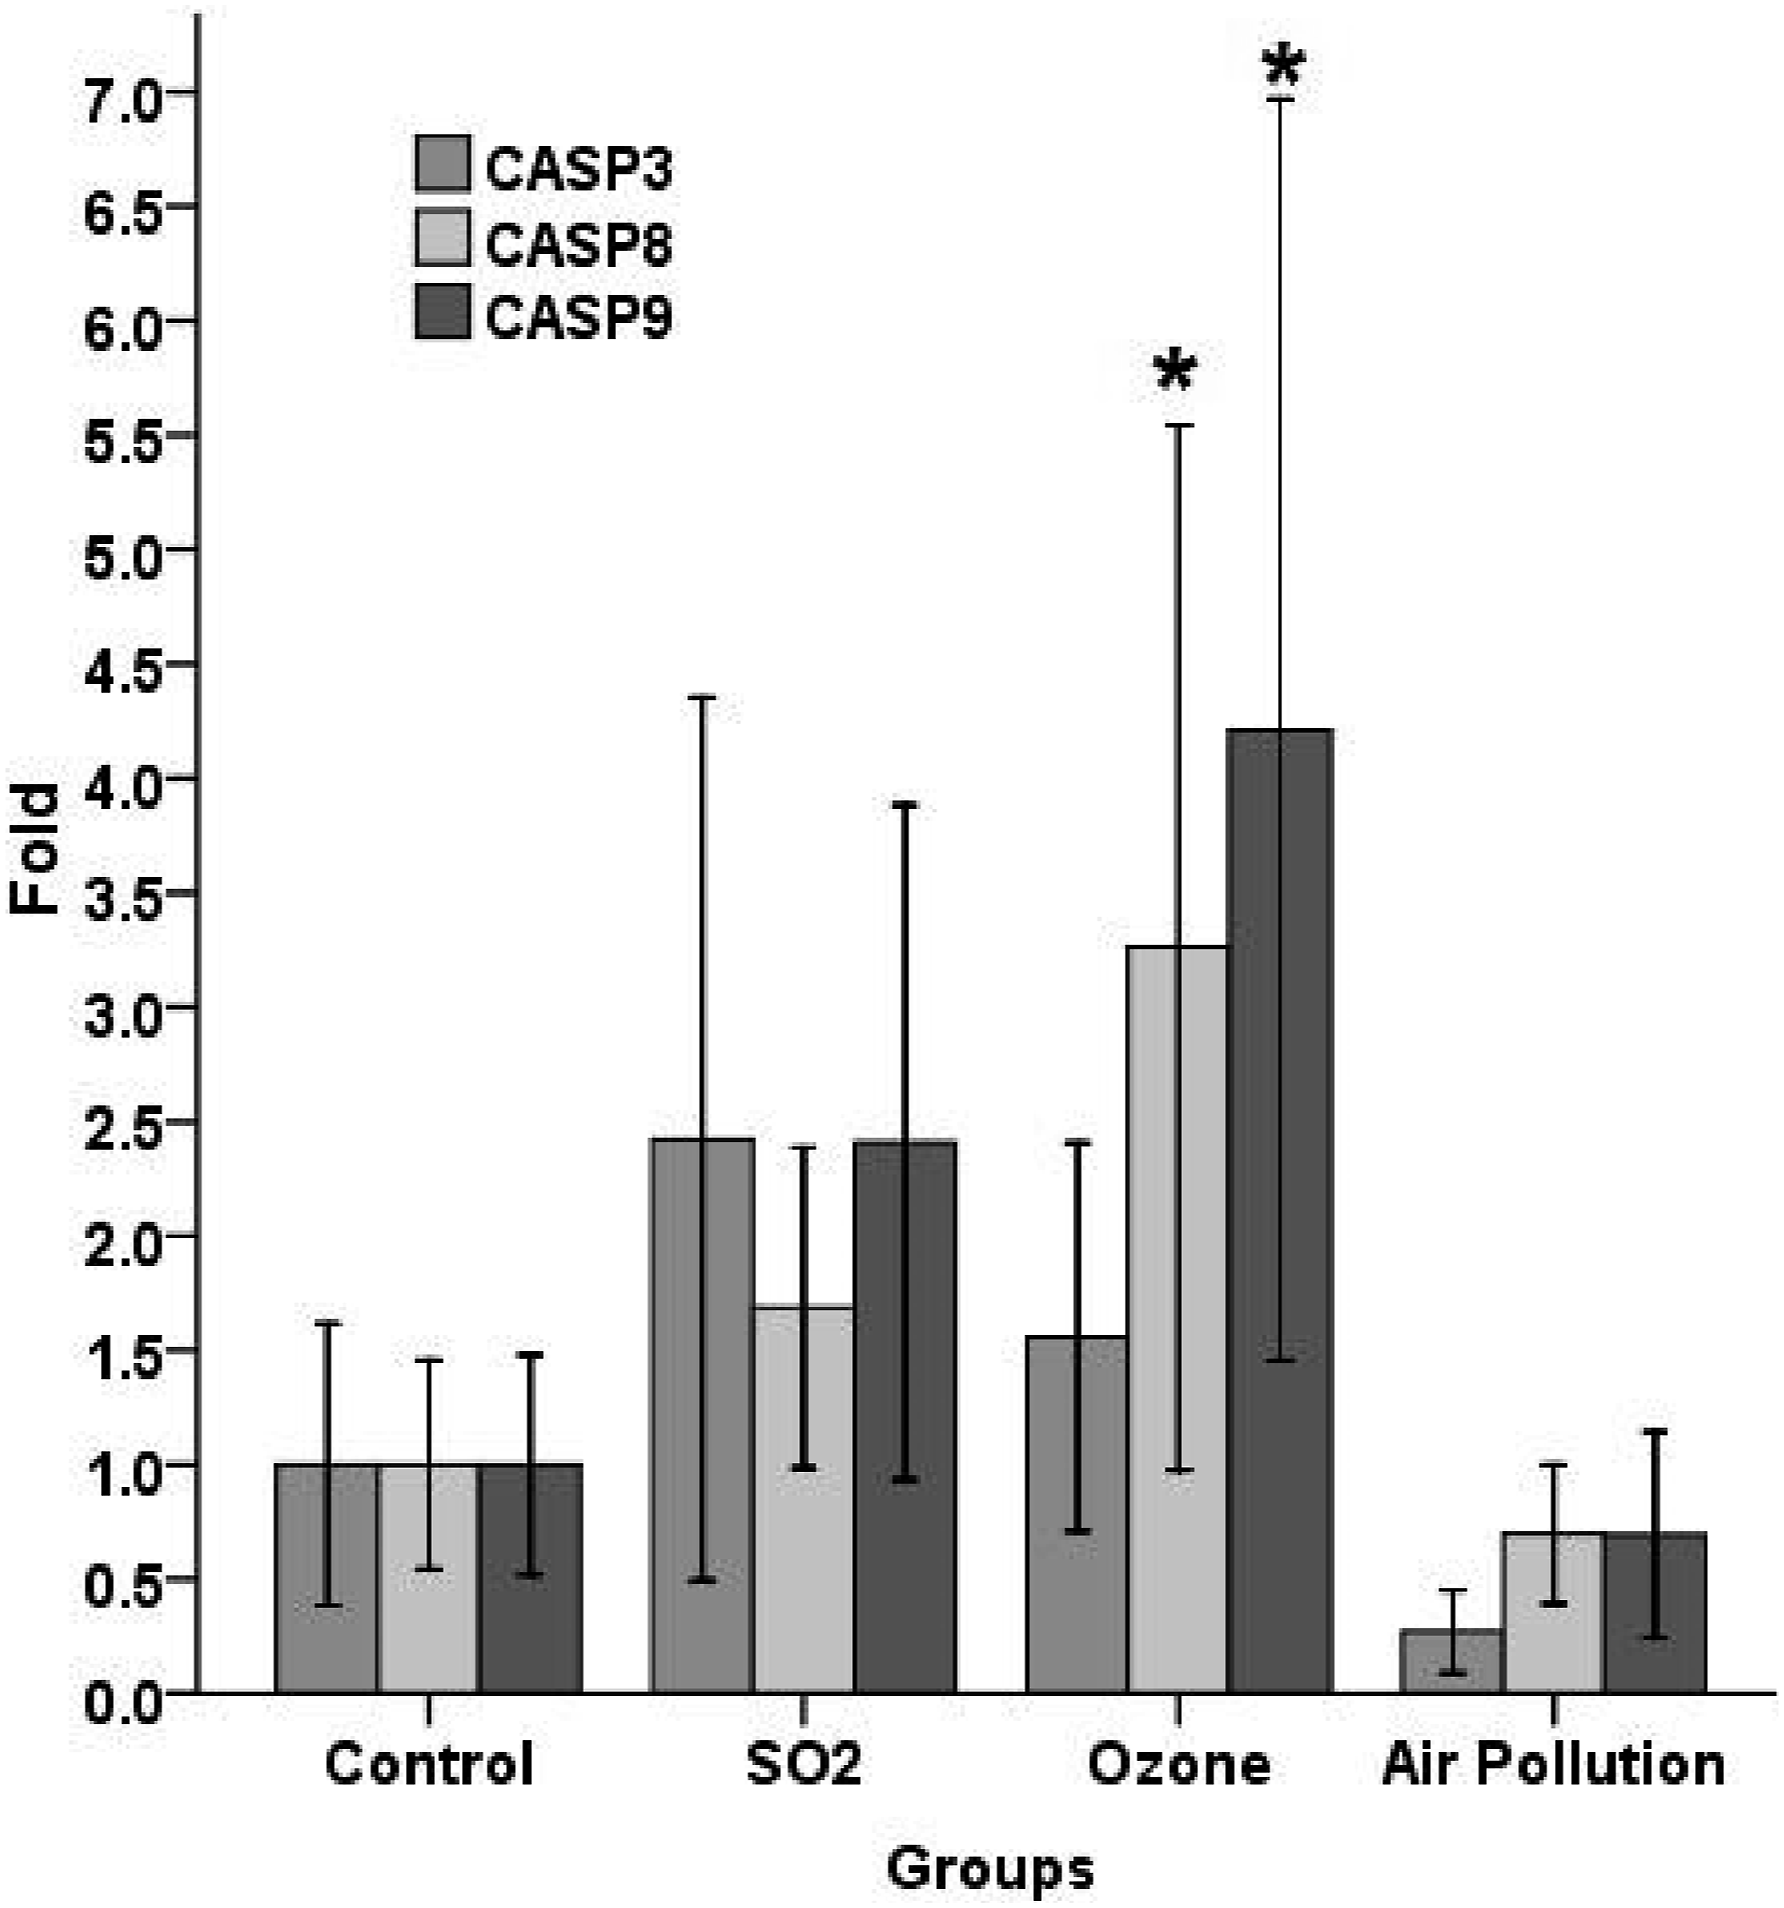
Expression changes of BAX, BCL2, P53, caspase-3, caspase-8, and caspase-9 transcripts in the liver tissue of examined rats are shown in Figures 10 and 11. The obtained Results indicated no significant BAX, BCL2, P53, and CASP3 disparities in experimental groups related to the control group (p > .05) (Figures 10 and 11). As shown in Figure 11, the expression of caspase-8 and caspase-9 proteins of the O3 group were remarkably higher related to the control groups. Expression of mRNA encoding BAX, BCL2 and p-53 proteins in the liver tissue of examined rats. The mean expression for each group is presented as a fold increase/decrease related to the control group, which has been assigned an arbitrary value of 1. Data are articulated as mean ± S D. Expression of mRNA encoding CASP3, CASP8, and CASP9 proteins in the liver tissue of examined rats. The mean expression for each group is articulated as a fold increase/decrease relative to the control group, which has been assigned an arbitrary value of 1. Data are articulated as mean ± S D. * denotes a statistically significant difference compared to the control group (p < .05).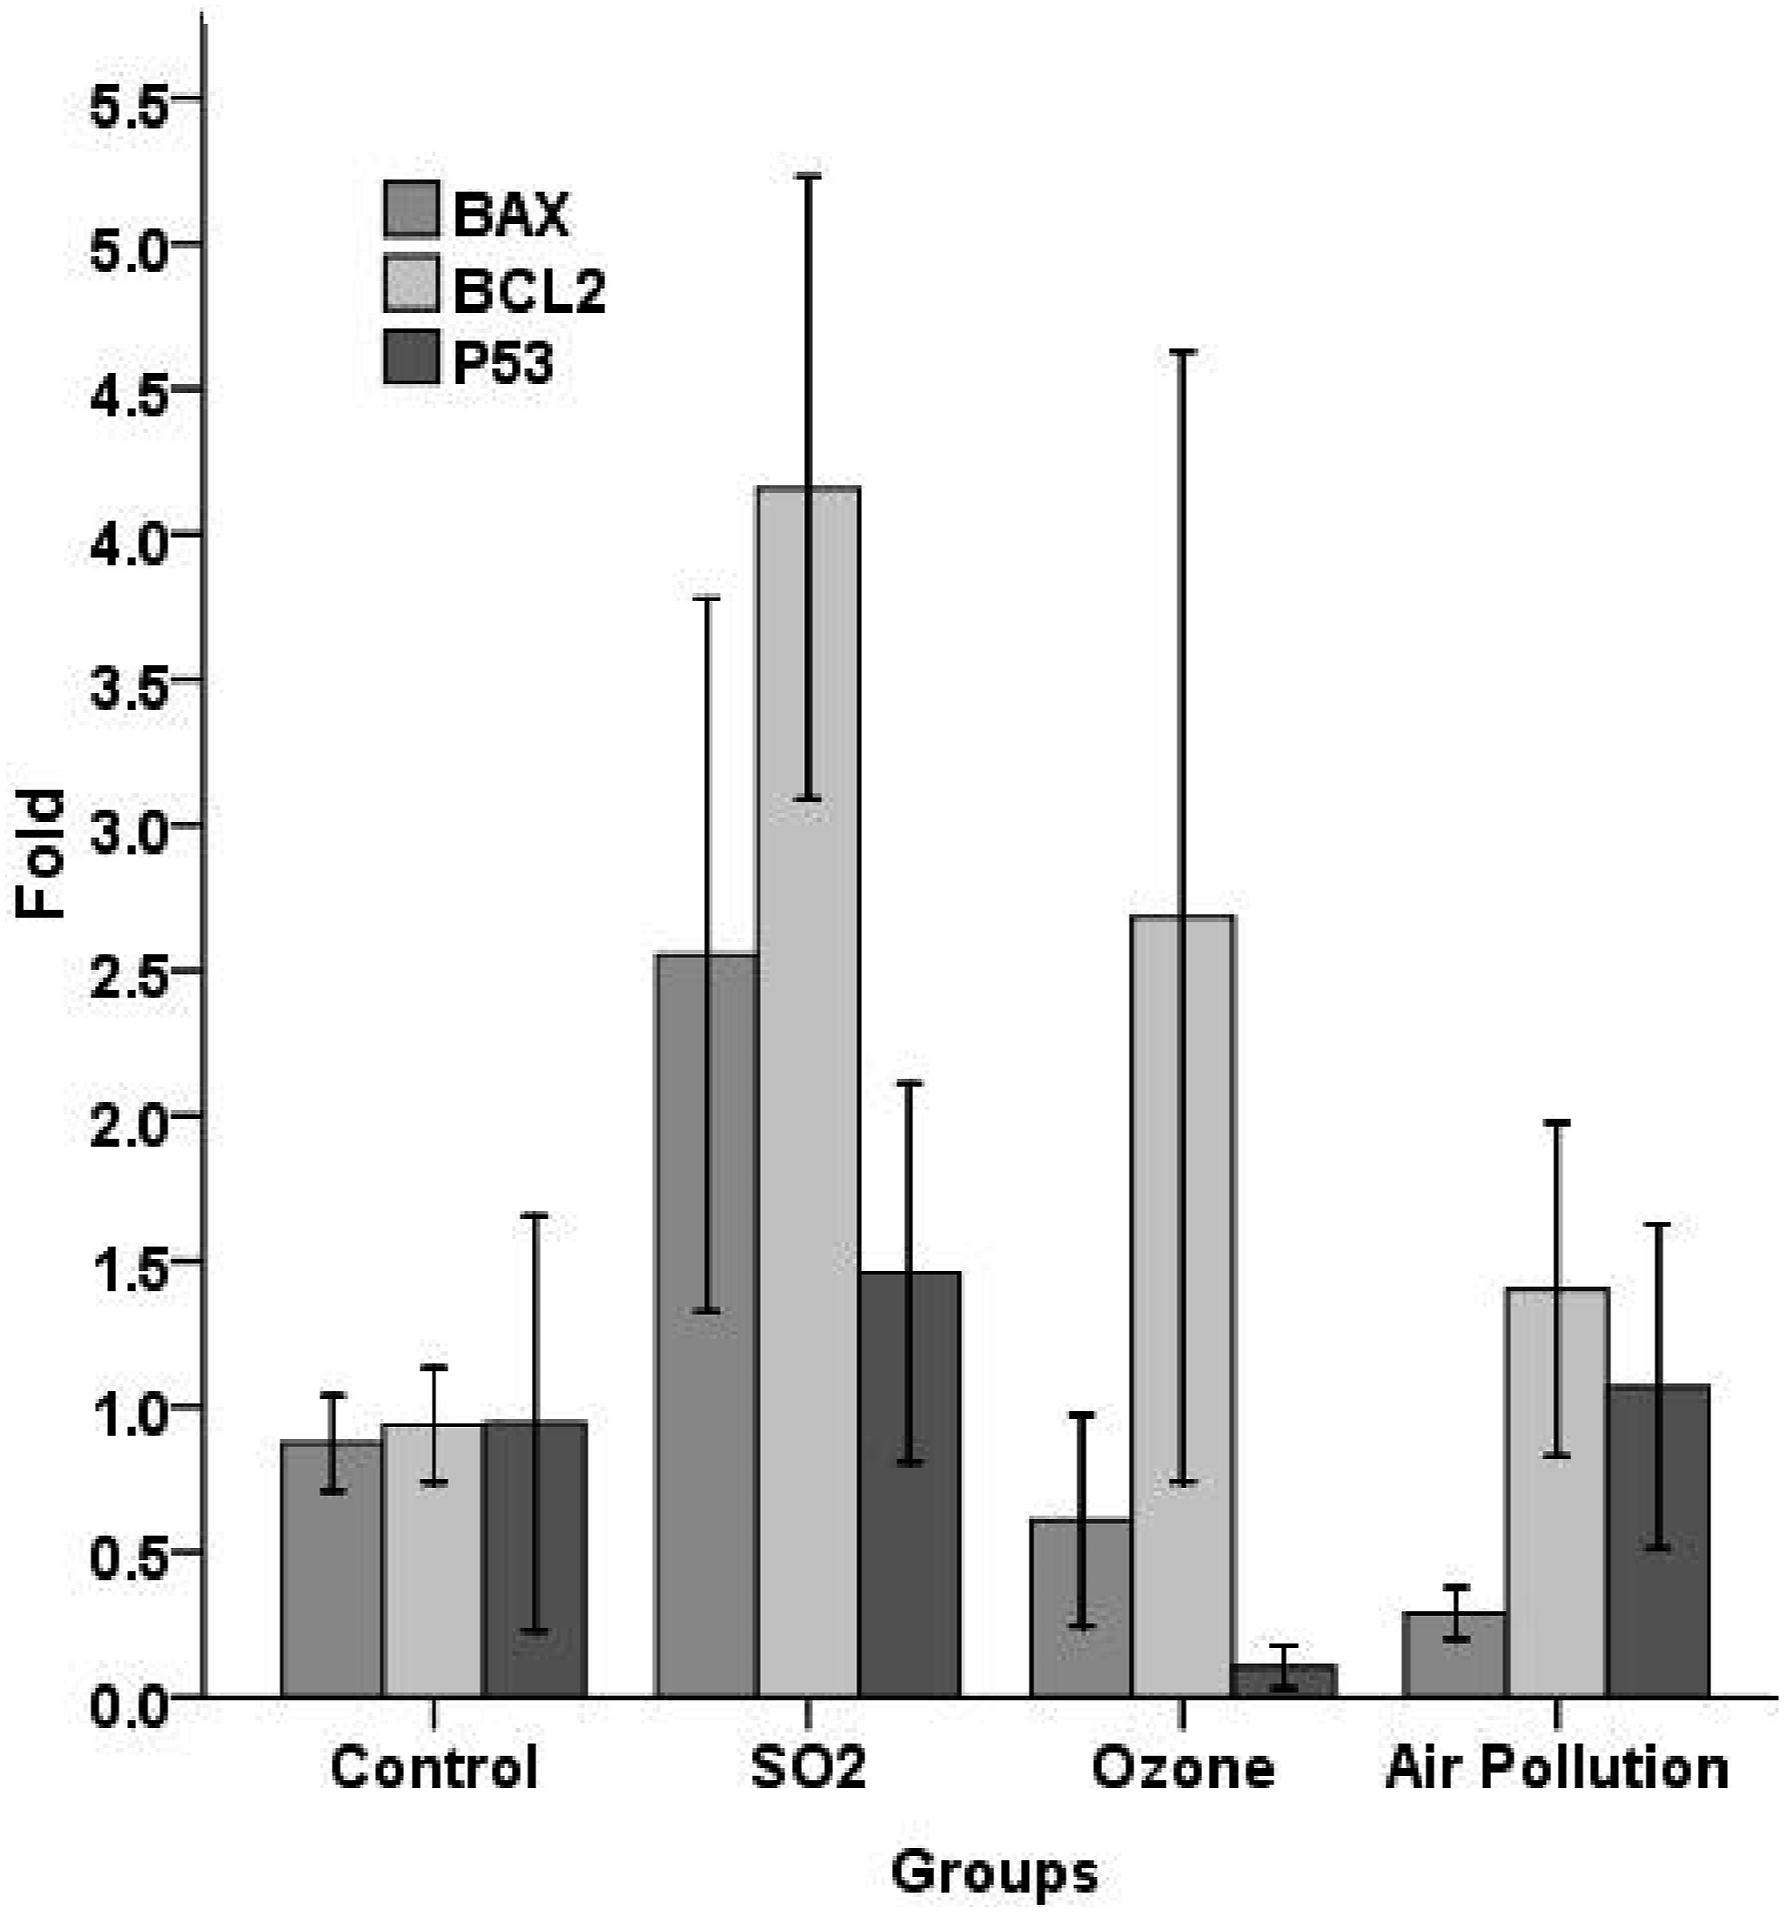
Discussion
Exposure to Air pollutants led to major deleterious health effects on humans and animals. This study was conducted to clarify the effects of air pollutants on liver tissue and also their impact on oxidative parameters and expressing some apoptotic-related genes. The findings of this study showed an increment of protein plasma level in all exposures, with remarkably higher in the air pollution group relative to the control group. Also, the ALT plasma level in the air pollution group was notably higher as compared to the control group. The AST plasma level in the SO2 group was remarkably higher as compared to the control group.
Effects of AAP exposure
This study revealed that ambient air pollutant levels were lower than most polluted cities worldwide. However, it was remarkable (Table 1). The mean concentrations of ambient air SO2, NO2, and O3 in this research were in the range of the WHO air quality guideline values, but PM2.5 and PM10 concentrations were higher than the guideline values (Table 2). Exposure to airborne pm leads to the formation of reactive oxygen species (ROS) and initiates inflammatory responses by inducing oxidative stress and causing deleterious health effects.35,36,41 The liver catalase, MDA, and GPx activity of the AAP group of this study were higher than the control group. Still, liver MDA activity was lower than the control group, and in contrast liver GPx activity was higher than control and O3 groups. Theoretically, some air pollutants are hepatocarcinogen chemicals.42,43 Histopathological findings showed moderate pathological lesions in the Air pollution recipient-group. PM can induce DNA damage, Gene-specific methylation, increasing gene expressions of BAX, P21, BCL-2, TP53, and phospho-P53 and activation of caspase-9, caspase-3, and pathway of apoptosis.37,44–47 The mean gene expression of P53 and BCL2 of the air pollution group in this study was higher than the control group.
Effects of SO2 exposure
SO2 is a colourless, ubiquitous and highly reactive gaseous that is deleterious to human and animal health. It is mainly exuded through the burning of fossil fuels, which contain sulphur.48,49
The findings of this study showed significantly higher AST plasma levels in the SO2 group as compared to the control group. Low SO2 concentrations notably enhanced SOD and GPx activities; conversely, high SO2 concentrations notably decreased activities of these antioxidant enzymes. Histopathological findings showed severe pathological alterations, including congestion, hemorrhage, and hepatocyte degeneration in the SO2 recipient group. Our results showed that SO2, in the concentrations used in this study, elevated CASP3, CASP8, CASP9, BAX, BCL2, and P53 gene expressions in the liver tissue. Our results are consistent with previously reported findings.
Effects of O3 exposure
O3 is a colourless and photochemical air pollutant that is produced from complex reactions in the layer of the troposphere.20,50 The mean GPx activity in hepatic tissue of the O3 group were remarkably higher relative to the control group. Findings of Histo-pathological analysis revealed mild alterations in the O3 (0.6 ppm) group. We should keep in mind that O3 is a potent oxidizing pollutant with various impacts. The findings of conducted studies revealed that the toxic and histo-pathological implications of O3 are relative to the dose and exposure time of O3 and the age of examined subjects and are varied in different animals. In this study, liver GPX activity in the O3 group was statistically notable as compared to the control group. Our results revealed that CASP3, CASP8, CASP9, and BCL2 expressions in the hepatic tissue of the O3 group were higher as compared to the control group (expressions of CASP3, CASP8, CASP9 were remarkably higher relative to the control group.
Conclusion
The findings of this research revealed the induction of oxidative stress and histopathological alterations and expressions of some genes related to apoptosis in the liver tissues of rats after exposure to AAP, SO2, and O3. Notably, the severity of histopathological alterations in the SO2 group was more significant than AAP and O3 groups. The obtained results suggested the apoptosis-triggered effect of O3 through increasing expressions of CASP8, CASP9, CASP 3, and BCL2 genes and also the stimulating effect of SO2 on expression BAX, BCL2, CASP3, CASP8, and CASP9 apoptotic pathway in the liver tissue. In this study, the impact of AAP on stimulating apoptotic pathways was not significant; therefore, more studies with more exposure times were recommended.
Supplemental Material
Supplemental Material - The effects of short-time air pollution, SO2, and ozone on biochemical, histo-pathological, oxidative stress, and carcinogenesis related genes expressions in the liver of the rats
Supplemental Material for The effects of short-time air pollution, SO2, and ozone on biochemical, histo-pathological, oxidative stress, and carcinogenesis related genes expressions in the liver of the rats by Bita Sepehri, Roya Darbani, Mehran Mesgari-Abbasi, Sorayya Kheirouri, Dariush Shanehbandi, Monireh Khordadmehr and Mohammad Alizadeh in Human & Experimental Toxicology
Footnotes
Acknowledgements
The authors acknowledge the Drug Applied Research Center, Tabriz University of Medical Sciences, Tabriz, Iran, for financial support (Grant ID: 64895).
Declaration of conflicting interests
The author(s) declared no potential conflicts of interest with respect to the research, authorship, and/or publication of this article.
Funding
The author(s) disclosed receipt of the following financial support for the research, authorship, and/or publication of this article: This study was funded by the Drug Applied Research Center, Tabriz University of Medical Sciences, Tabriz, Iran (Grant ID: 64895).
Supplemental Material
Supplemental material for this article is available online.
References
Supplementary Material
Please find the following supplemental material available below.
For Open Access articles published under a Creative Commons License, all supplemental material carries the same license as the article it is associated with.
For non-Open Access articles published, all supplemental material carries a non-exclusive license, and permission requests for re-use of supplemental material or any part of supplemental material shall be sent directly to the copyright owner as specified in the copyright notice associated with the article.