
Abstract
Vancomycin (VCM)-induced nephrotoxicity impedes its treatment applications. Thus, it is important to clarify the relevant mechanism. This study investigated phosphoprotein changes attributable to the VCM nephrotoxicity mechanisms. Biochemical, pathological and phosphoproteomic analyses based on C57BL/6 mice were performed to explore the mechanisms.VCM-treated mice showed increased levels of blood urea nitrogen and creatinine, and signs of acute tubular necrotic lesions. Phosphoproteomic profiling identified 3025 differentially phosphorylated phosphopeptides between the model and control group. Gene Ontology enrichment analysis demonstrated that Molecular Function “oxidoreductase activity” and Cellular Component “peroxisome” were markedly enriched. KEGG pathway analysis identified an enrichment in peroxisome pathway and PPAR (peroxisome proliferator-activated receptor) signaling pathways. Parallel reaction monitoring analysis revealed a significant downregulation of CAT, SOD-1, AGPS, DHRS4, and EHHADH at phosphorylation level by VCM. Notably, the phosphorylation of ACO, AMACR, and SCPX was downregulated by VCM, which are the fatty acid β-oxidation-related proteins involved in PPAR signaling pathways. The phosphorylated PEX5 involved in peroxisome biogenesis was upregulated by VCM. Collectively, these findings indicated that VCM-induced nephrotoxicity is closely associated with peroxisome pathway and PPAR signaling pathways. The current study provides important insight into the mechanisms of VCM nephrotoxicity and will aid in the development of preventive and therapeutic strategies against this nephropathy.
Introduction
Vancomycin (VCM) is a widely employed glycopeptide antibiotic for severe gram-positive bacterial infections, especially methicillin-resistant staphylococcus aureus. 1 However, the fact that VCM therapy is often associated with nephrotoxicity further limits its clinical application. 2 It is reported that VCM therapy-induced nephrotoxicity has been observed in almost 10% of patients and has become one of the most common clinical causes of increased hospitalization length, as well as 30-days hospital readmission rates and all-cause 30-days mortality. 3 The pathological characteristics of VCM nephrotoxicity include proximal tubule necrosis, vacuolization, tubular dilatation, and atrophy. Besides, the obstructive casts due to the coprecipitation of VCM and uromodulin are distinctive pathological changes that differentiate VCM from other nephrotoxins.4,5 Both in vivo and in vitro studies have reported that oxidative stress and apoptotic cell death are involved in VCM-induced nephrotoxicity.6,7 However, the underlying mechanisms of these processes are still unclear. Therefore, it is necessary to perform further research on the underlying mechanics of VCM-induced nephrotoxicity to identify key targets for its prevention and therapy.
In recent decades, the omics technologies, especially proteomics have proven useful for the discovery of the novel therapeutic targets of drug-induced nephrotoxicity. In addition, proteomic analysis could offer valuable information for understanding the mechanism of drug-induced nephrotoxicity. In prior studies, our group performed proteomic analysis using a stable isotope labelling by amino acids in cell culture (SILAC) approach to explore the mechanism of VCM-induced nephrotoxicity. This work revealed 492 significant proteins regulated by VCM in human proximal tubule epithelial cells (HK-2).
8
However, the general molecular mechanism changes of the mouse model kidney proteomes in response to VCM-induced nephrotoxicity are largely unknown. Protein phosphorylation is a key post-translational modification in many cellular events, which possesses modulatory effects on a range of essential biological processes, such as homeostasis, secretion, metabolism, transcriptional and translational regulation, and cellular signaling.
9
Phosphoproteomic analyses could shed light on the more common post-translational modifications and phosphorylations.
10
Lots of studies have demonstrated that phosphoproteomic analysis can contribute towards deeper understandings of the intracellular signaling events. It also facilitates investigations of various renal pathophysiological processes, including renal fibrosis, hypertensive kidney, and drug-induced nephrotoxicity.11,12,13 In recent years, the mass spectrometry-based quantitative proteomics approach has offered a unique means for elucidating cellular signaling pathways and has been extensively used to characterize the phosphoproteome.14,15 We adopted the phosphoproteome as a tool by which to quantify and identify mouse model phosphoprotein responses to VCM nephrotoxicity. Here, we clarified the molecular mechanisms underlying the development of VCM-induced nephrotoxicity (Figure 1). Workflow of the phosphoproteomic analysis of VCM-induced nephrotoxicity in mice.
Materials and methods
Drugs and reagents
VCM was purchased from VIANEX S.A. (VIANEX S.A., Greece). Ultrapure water was obtained via the Milli-Q system (Millipore, USA).
Ethical statement
Animal studies were performed in accordance with ethical guidelines for the care and use of laboratory animals outlined by the National Institutes of Health. All protocols of the animal experiments in this study received approval from the Animal Ethics Committee of the Shanghai Children’s Hospital (Shanghai, China, Permit number: 2015003).
Animal model and drug administration
7-weeks-old, C57BL/6 male mice (22 ± 2 g) were purchased from the Shanghai Model Organisms Center, Inc (Shanghai, China). All animals were housed in a 12-h dark/light environment at 21–23°C with a relative humidity of 55–65%. After a week-long pre-acclimatization, mice were divided into two groups; control group (n = 10), and model group (n = 10). Mice in control group were intraperitoneally administrated 10 mL/kg/day normal saline. Mice in model group were intraperitoneally administrated VCM (600 mg/kg/day) saline solution for 7 days. Food and water were freely accessible throughout the experiment period. At the end of the experiment period, mice were fasted for 16 h. All animals were anesthetized with 2–3% isoflurane (applied via inhalation) and blood and kidneys were collected for further study. 16 The collected kidney was stored −80°C for further biochemical, histological, and protein phosphorylation analysis. While the animals were under anesthesia, they were euthanized by CO2.
Serum and kidney tissue biochemical analysis
Blood samples were kept undisturbed at room temperature for 2 h and centrifuged at 4°C 3500 rpm for 15 min. After that, the supernatant serum samples were obtained and the automatic biochemical analyzer (HITACHI 7080, Japan) was applied for the determination of serum levels of blood urea nitrogen (BUN) and creatinine (Crea). The total superoxide dismutase (SOD) assay kit with WST-8 (Beyotime Biotechnology, S0101 M, China), GSH kit (Nanjing Jiancheng, A006-2-1, China) and MDA kit (Nanjing Jiancheng, A003-1, China) were used to assess the renal oxidative stress parameters of per gram protein in mice kidney. Briefly, the mixture of 100 μL PBS solution and 10 mg kidney tissue were automatically grinded (OMNI, USA), and the homogenate was centrifuged at 4°C 2500 rpm for 10 min. The supernatant protein samples were collected and quantified by BCA kit (Bio-Rad, 5000001, USA). All following procedures of SOD, GSH, and MDA determination were conducted in accordance with the manufacturer’s instructions.
Histological analysis
Kidney samples were fixed in 4% paraformaldehyde, dehydrated, embedded in paraffin, and cut into 5 µm sections. 17 Renal histological changes were assessed using hematoxylin-eosin staining, which enabled analysis of renal pathology according to standard protocols. Shanghai Showbio Biotech Inc. performed the histological assessments. Images were taken using the Olympus BX61VS microscope (Olympus Corporation, Japan).
Sample preparation
SDT buffer (4% SDS, 100 mM Tris-HCl, 1 mM DTT, pH 7.6) was added to the fresh frozen sample. The mixture was homogenized by the MP homogenizer (24 × 2, 6.0 M/S, 60 s, twice). The homogenates were sonicated and then boiled for 15 min. After centrifugation at room temperature 14,000 × g for 10 min, the supernatant was filtered through 0.22-µm filters and the filtrate (the protein section) was quantified with a BCA Protein Assay Kit (Bio-Rad, 5000001, USA) and then stored at −80°C. 18
Proteolysis
The extracted proteins was digested for 20h at 37°Cusing Tryspin at a protein/enzyme ration of 50:1 and then processed to a peptide mixture according to the filter-aided sample preparation (FASP) protocol. 19 Then, 100 μg of each peptide mixture sampled was labeled, using tandem mass tag (TMT)-6plex reagent (Thermo Fisher Scientific, 90,064CH, USA), according to the manufacturer’s instructions. 20 In brief, 200 μg of digested proteins were mixed with 30 μL standard buffer (4% SDS, 100 mM DTT, 150 mM Tris-HCI, pH 8.0). The detergent, DTT and other low molecular weight components were then removed by repeated ultrafiltration (MicroCon units, 10 kDa) in uric acid buffer (8 M urea, 150 mM Tris-HCl pH 8.0). Then, 100 μL of 0.1 M iodoacetamide was added into the uric acid buffer and incubated in the dark for 30 min to block cysteine residue reduction. Next, the filter was rinsed three times with 100 μL of uric acid buffer and twice with 100 μL of 25 mM NH4HCO3 buffer. Finally, 4 μg trypsin (Promega, USA) was added to 40 μL of 25 mM NH4HCO3 buffer. The protein suspensions were then digested overnight at 37°C. The resulting peptides were collected as a filtrate. Each sample’s peptides were desalted on C18 Cartridges (Empore™ SPE Cartridges C18, standard density, bed I.D. 7 mm, volume 3 mL) (Sigma, Germany). The peptide content was estimated by UV light spectral density at 280 nm using an extinctions coefficient of 1.1 of 0.1% (g/L) solution, calculated based on the frequency of vertebrate protein tryptophan and tyrosine.
Tandem mass tag labeling and high performance liquid chromatography separation fractionation
A Pierce high pH reversed-phase peptide fractionation kit (Thermo Fisher Scientific, 84,868, USA) fractionated TMT-labeled digest samples into six fractions. It was performed in an increasing acetonitrile step-gradient elution according to the manufacturer’s instructions. The dried peptide mixture was reconstituted and acidified with 0.1% trifluoroacetic acid solution, and loaded to the equilibrated, high-pH, reversed-phase fractionation spin column. Peptides were bound to the hydrophobic resin under aqueous conditions. They were then desalted by washing the column with water via low-speed centrifugation. A step gradient of increasing acetonitrile concentrations in a volatile high-pH elution solution was then applied to the columns to elute the bound peptides into six different fractions collected by centrifugation. The collected fractions were desalted on C18 Cartridges (Empore™ SPE Cartridges C18, standard density, bed I.D. 7 mm, volume 3 mL) (Sigma, Germany) and concentrated by vacuum centrifugation.
Phosphopeptide Enrichment
Briefly, the lyophilized peptides of FASP-digested proteins were resuspended in wash buffer and determined by UV light spectral density at 280 nm. Then, 500 fmol each phosphorylated internal standard (HNYYTSISK, QVVDSAYEVIK, GILAADESTGSIAK, ADEPSSEESDLEIDK) was added to the equalized peptides drawn from each sample. Subsequently, phosphopeptide enrichment was carried out a High-SelectTM Fe-NTA Phosphopeptide Enrichment Kit according to the manufacturer’s instructions (Thermo Fisher Scientific, A32992, USA). After being lyophilized, the phosphopeptides were resuspended in 20 µL loading buffer (0.1% formic acid).
Liquid chromatography-tandem mass spectrometry (LC-MS) analysis
An LC-MS analysis was performed for 60 min on a Q Exactive HF mass spectrometer (Thermo Fisher Scientific, USA) coupled to Easy nLC (Thermo Fisher Scientific, USA). The peptides were loaded onto a reverse phase trap column (Acclaim PepMap100, 100 μm*2 cm, nanoViper C18) (Thermo Fisher Scientific, USA) connected to the C18-reversed phase analytical column (Easy Column, 10 cm long, 75 μm inner diameter, 3 μm resin) (Thermo Fisher Scientific, USA) in buffer A (0.1% formic acid). They were separated with a linear gradient of buffer B (84% acetonitrile and 0.1% formic acid) at a flow rate of 300 nL/min controlled by IntelliFlow technology. The mass spectrometer was positive ion mode. MS data were acquired by a data-dependent top 10 method, which entailed dynamically choosing the most abundant precursor ions from the survey scan (300–1800 m/z) for higher-energy collisional dissociation (HCD) fragmentation. Automatic gain control (AGC) target and a maximum injection time were set to 1 × 10⁶, and 50 ms respectively. Dynamic exclusion duration was 60.0 s. Survey scans were acquired at a resolution of 70,000 at m/z 200 and the resolution for HCD spectra was set to 17,500 at m/z 200. Additionally, an isolation window was set at 2 m/z. Normalized collision energy was 30 eV. The underfill ratio, specifying the minimum percentage of the target value likely to be reached at maximum fill time, was defined as 0.1%. The instrument was run in enabled peptide recognition mode.
MS/MS data analysis
The parameters for protein identification were set as follows: database: Swissprot_mouse_17,020_20190415.fasta; enzyme: trypsin; missed cleavages: 2; fixed modifications: carbamidomethyl (C), TMT6plex (N-term); variable modifications: oxidation (M) and phospho (S/T/Y); peptide mass tolerance: ±20 ppm; MS/MS tolerance: 0.1 Da; peptide false discovery rate 0.01. The phosphorylated peptides were identified by the MaxQuant software version 1.5.5.1 (Max Planck Institute of Biochemistry in Martinstried, Germany). A phosphorylation RS score >50 indicates a good peptide spectrum match, and a PRS probability >75% indicates that the phosphorylation site has high phosphorylation reliability.
LC-PRM/MS
quantification analysis. Parallel reaction monitoring (PRM) was performed using Q Exactive HF (Thermo Fisher Scientific, USA). Briefly, phosphopeptide samples were first dissolved in 20 µL of 0.1% formic acid. Then, 3 µL was injected into an Easy nLC 1200 system (Thermo Fisher Scientific, USA). The eluent was introduced into the mass spectrometer using a trap column (home-made column, 100 μm*50 mm, 3 μm-C18) and an analytical column (home-made tip-column, 75 μm*200 mm, 5 μm-C18). The mobile phase buffer consisted of 0.1% formic acid in water, with a 0.1% formic acid eluting buffer (buffer A) in 84% CH3CN (buffer B). The LC flow rate was 300 nL/min. The gradient was set as 5–10% buffer B for 2 min, 10–30% buffer B for 43 min, 30–1000% buffer B for 10 min, and 100% buffer B for 5 min. The sample was acquired on a Q-Exactive HF (Thermo Fisher Scientific, USA). The mass spectrometer, set in positive ion mode, was then applied for 60 min. Each sample was analyzed under PRM with an isolation width of ±0.8 Th. For all experiments, a full mass spectrum at a resolution of 60,000 relative to m/z 200 (AGC target 3 × 10⁶, 200 ms maximum injection time, 300–1800 m/z) was followed by up to 20 PRM scans at a resolution of 30,000 (AGC target 1 × 10⁶, 120 ms maximum injection time). HCD was used with 27 eV normalized collision energy. PRM data were manually curated within Skyline (version 3.5.0.9319).
Bioinformatic analyses
Bioinformatic analysis was performed to explore the biological functions of the differentially expressed proteins. All differentially expressed kidney proteins were retrieved from the SwissProt database (Release 2019_04_15 in FASTA format). They were then subjected to Gene Ontology (GO) and Kyoto Encyclopedia of Genes and Genomes (KEGG) pathways analyses based on Fisher’s exact test. The GO annotation results were plotted using R scripts. The maps of KEGG pathways were retrieved from the online KEGG database (http://geneontology.org/). Significance was set at pathway with p-values under a threshold of 0.05. Protein–protein interaction (PPI) networks were then constructed using the STRING database (http://www.string-db.org) of known and predicted protein interactions; including direct (physical) and indirect (functional) associations.
Immunofluorescence analysis
Kidney tissues were dissected and fixed in 4% paraformaldehyde, dehydrated as well as embedded in paraffin, and cut into 5 µm slides as reported research. 21 Then, the slides were incubated overnight at 4°C with 1:800 dilution of primary antibody against peroxisomal membrane protein 70(PMP70) (Abcam, ab85550, UK). Subsequently, the slides were washed with PBS and incubated with 1:300 dilution of Cy3-conjugated anti-rabbit antibody (Servicebio, GB21303, China) for 50 min at room temperature. Nuclei were stained with DAPI (Servicebio, G1012, China) for 10 min 22 Fluorescence images for peroxisome abundance were obtained using immunofluorescence imaging system (Nikon Eclipse c1, Nikon DS-U3, Japan). The panoramic slice scanner CellQuant and PatternQuant (3DHISTECH, version 2.4.0) were used to the quantitative change of peroxisome abundance. 23
RNA extraction and real-time PCR
Total RNA of kidney was extracted using TRIzol (Thermo Fisher Scientific, 15596026CN, USA) according to the standard protocol, 24 and the synthesis of cDNA was prepared using the RNA reverse transcription premix (Accurate Biology, AG11706, China). The design and synthesis of primers were conducted by Sangon Biotech, and the nucleotide sequence of primers was presented in Supplementary Table 3. The SYBR Green master mix (Yeasen Biotechnology, 11201ES08, China) was employed to perform the qRT-PCR, the reactions were carried out with the following conditions: 30 s at 95°C for Initial denaturation, then 40 cycles of 10 s at 95°C for denaturation, 30 s at 60°C for annealing, and 30 s at 72°C for melting. Relative quantification with Gapdh was calculated using the 2-ΔΔCT method.
Statistical analyses
All data are expressed as mean ± SD. Statistically significant differences between the means of two groups were assessed using the Student’s t test (two-tailed). All analyses were carried out using the SPSS 24 software program. Statistical significance was set at p < 0.05.
Results
Nephrotoxicity of VCM in mouse kidney
Dose-response experiment was conducted in our preliminary study. Mice were intraperitoneally injected with VCM at the dosage of 400 mg/kg, 600 mg/kg, and 800 mg/kg per BW at 24-h intervals for consecutive 7d. Our results showed that the exposure of VCM (400 mg/kg) caused a slight nephrotoxicity in mice, while exposure of VCM (600 mg/kg, 800 mg/kg) resulted in the severe nephrotoxicity in mice as evidenced by biochemical parameters (Supplementary Figure 1). According to the conversion of animal equivalent dose (AED) for the existing or clinically available drug can be estimated based on normalization of dose-to-body surface area, AED (mg/kg) = Human dose (mg/kg) * Km ratio (mouse Km = 12.3), 369–738 mg/kg per day is a dosage for mouse that is equivalent to human dose in medical treatment. Therefore, 600 mg/kg administration were selected to conduct the mechanism study. As shown in Figure 2(a), marked changes in BW are observed in VCM(600 m/kg per BW) -treated mice. In addition, renal hypertrophy was evident in VCM-treated mice, reflected by significant increases in kidney weight/body weight ratio and size compared with the model group (Figure 2(b) and (c)). As compared to the control group, serum levels of BUN and Crea increased in the model group (Figure 2(d) and Figure 2(e)). Moreover, histological examination demonstrated characteristic VCM-associated tubular casts in VCM-treated mice. VCM leads to inflammatory infiltration and swelling of interstitial edema. Sloughing of tubular epithelial cells and markedly dilated renal tubles were also observed in VCM-treated mice. The glomeruli showed slight non-specific injury with mild cellular edema than control group (Figure 2(f) and (g)). Collectively, these findings demonstrated that 600 mg/kg of VCM successfully induced nephrotoxicity in the mice model, which occurred predominantly in the renal tubules. To further investigate the pathological mechanism of VCM-induced nephrotoxicity, phosphoproteomic analysis of kidney tissue was performed. VCM induced physiological, biochemical, and histological changes in mice (control group (n = 10), and model group (n = 10)). (a) Body weight curve over time. (b) The ratio of kidney weight/body weight. (c) The image of kidney size. (d) Plasma BUN level and (e) Creatinine level. (f) Histological examinations of the kidneys in control group, the arrows point to normal renal tubule. (g) Model group, the arrows point to dilated renal tubule, distinctive VCM-associated tubular casts, inflammatory infiltration, sloughing of tubular epithelial cells (from left to right). Data are presented as Mean ± SD. n = 10, *p < 0.05, **p < 0.01, ***p < 0.001 versus control group, respectively.
Phosphoproteomic analysis of mouse kidneys by LC-MS/MS
A TMT-labeled quantitative phosphoproteomic technology was applied in this study. This served to provide a fuller picture of protein phosphorylation profiles. It also aided investigations into alterations in protein phosphorylation levels caused by the VCM administration. As shown in Figure 3(a), a total of 15,980 phosphosites were detected, of which 11,898 could be quantitatively analyzed. Among them, phosphorylated serine constituted a dominating portion (nearly 80%). Meanwhile, phosphorylated threonine and tyrosine phosphosites only accounted for 17.33% and 2.69%, respectively (Figure 3(b)). The quantified sites, corresponding to 9099 phosphopeptides within 3898 proteins, were further subjected to statistical and bioinformatic analyses. Next, the differential phosphopeptides were subjected to bioinformatic analysis to reveal protein level changes caused by VCM administration. The phosphorylated peptides with ratio >1.5 and p < 0.05 were considered to have been significantly upregulated. Meanwhile, those with ratio <0.67 and p < 0.05 were considered to have been significantly downregulated. Finally, a total of 1463 significantly upregulated phosphopeptides and 1562 significantly downregulated phosphopeptides were detected in comparison with the control group (Figure 3(c) and (d)). The details of significantly phosphopeptides in Figure 3(d) are added as supplemental information (Supplementary Table 1). Phosphoproteomic profiles of differently expressed proteins between model group (n = 3) and control group (n = 3). (a) Statistical histogram of protein identification and quantification results by TMT. A total of 10,397 phosphorylated peptides belonging to 4225 phosphorylated proteins were detected. These phosphorylated peptides included 15,980 phosphorylation sites, of which 11,898 could be quantitatively analysed. (b) Serine, threonine, and tyrosine phosphorylation accounted for 79.97%, 17.33%, and 2.69% of the phosphorylation sites, respectively. (c) The upregulated (red) or downregulated (blue) proteins were displayed in different groups. a total of 1463 significantly upregulated phosphopeptides and 1562 significantly downregulated phosphopeptides were detected when compared with the control group. (d) Volcano plot showing the upregulated (red) or downregulated (purple) proteins between the model group and control group.
GO and KEGG pathways enrichment analyses of the differentially expressed proteins
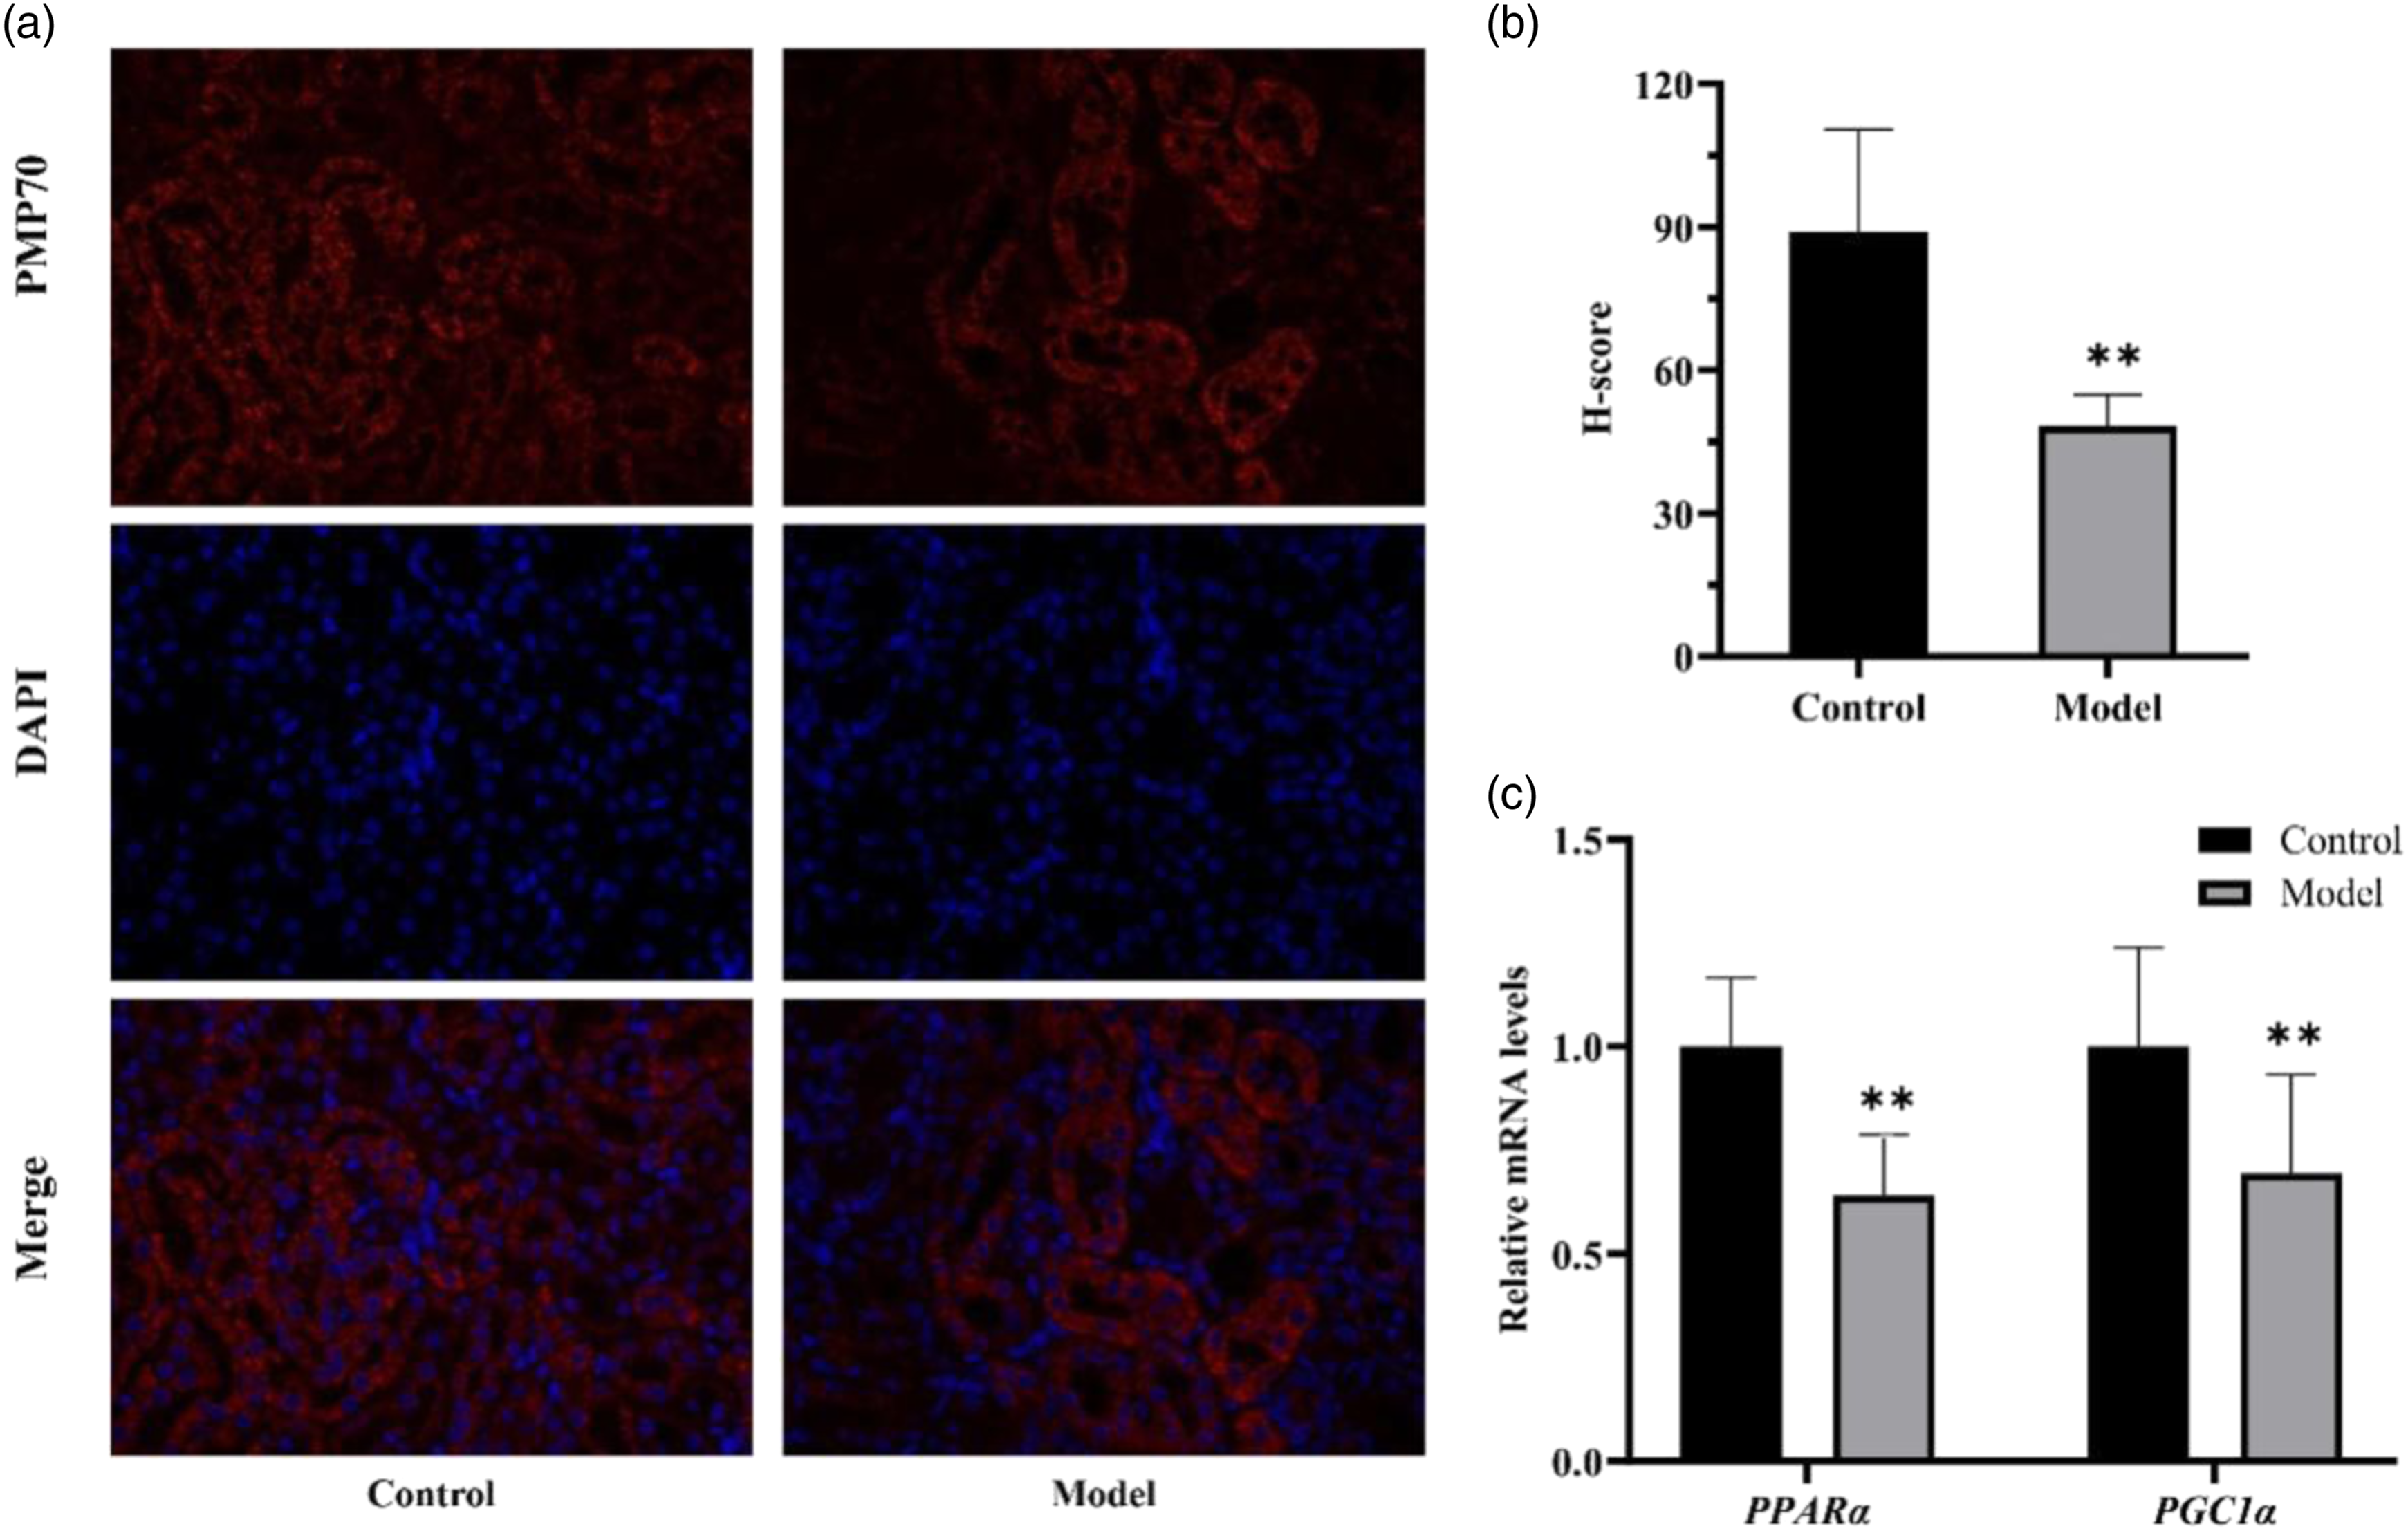
GO analysis, which includes Biological Process (BP), Molecular Function (MF) and Cellular Component (CC) terms, was performed on differentially expressed proteins to characterize their function. The significant enriched items are shown in Figure 4(a). Specifically, significant enrichment item was observed in MF “oxidoreductase activity”. Interestingly, CC “peroxisome” and “mitochondrion” were also enriched. As we know, peroxisomes are versatile organelles with a large number of biological tasks, including fatty acid β-oxidation (FAO) as well as the decomposition of reactive oxygen species (ROS). In this study, we observed that the abundance of peroxisomes (Figure 5(a) and (b)) and the relative mRNA levels of Peroxisome related-genes including PPARα and PGC1α (Figure 5(c)) was decreased in mice with VCM treatment. These above findings suggested that peroxisomal dysfunction were the essential biological events in the progress of VCM-induced nephrotoxicity. GO and KEGG pathways analysis of differentially expressed proteins (n = 3). (a) The significant enrichment of MF and CC in the GO annotation analysis. (b) Peroxisome pathway and PPAR signaling pathways is the significantly enriched pathways. (c) KEGG maps of peroxisome pathway, (d) KEGG maps of PPAR signaling pathways, red represents upregulated proteins and green represents downregulated proteins. The effect of VCM on peroxisomal abundance in kidney tissue (n = 6). (a) Immunofluorescence of kidney tissue obtained from C57BL/6J male mice in control group and model group using antibodies against PMP70 (Abcam ab85550) and cy3 conjugated anti-rabbit antibody (Servicebio; GB21303) (red). The samples were counterstained with the nuclear dye DAPI (Servicebio; G1012) (blue) (magnification 100×). (b) Quantification of peroxisomal abundance in kidney tissue. H‐score = ∑(pi × i) = (percentage of weak intensity area × 1) + (percentage of moderate intensity area × 2) + (percentage of strong intensity area × 3). (c) The relative mRNA expression of PGC1α and PPARα in mice determined by RT-PCR.The data are expressed as mean ± SD, *p < 0.05, **p < 0.01, ***p < 0.001 versus control group, respectively.
Next, KEGG pathways enrichment analysis was performed to identify important pathways related to the VCM nephrotoxicity (Figure 4(b)). The red in Figure 4(b). represents increased phosphorylation; whereas green represents decreased phosphorylation. According to the results, lipid metabolism-related pathways including peroxisome pathway (mmu04146, Figure 4(c)) and peroxisome proliferator-activated receptor (PPAR) signaling pathways (mmu03320, Figure 4(d)) were significantly enriched. Notably, the phosphorylation of the peroxin 5 (PEX5) protein, which facilitates peroxisome biogenesis, was up-regulated. In addition, FAO-related proteins involved in PPAR signaling pathways were down-regulated, including acyl-CoA oxidase (ACO), α-methyl acyl-CoA racemase (AMACR); and sterol carrier protein-x (SCPX). The sum of results demonstrated that VCM nephrotoxicity might affect lipid metabolism via the peroxisome pathway and PPAR signaling pathways in mice. To further confirm this hypothesis, the peptides of the main targeted proteins involved in FAO and antioxidant activity were confirmed by PRM analysis.
Peptides of the targeted proteins were verified by PRM-targeted quantitative proteomics and RT-PCR
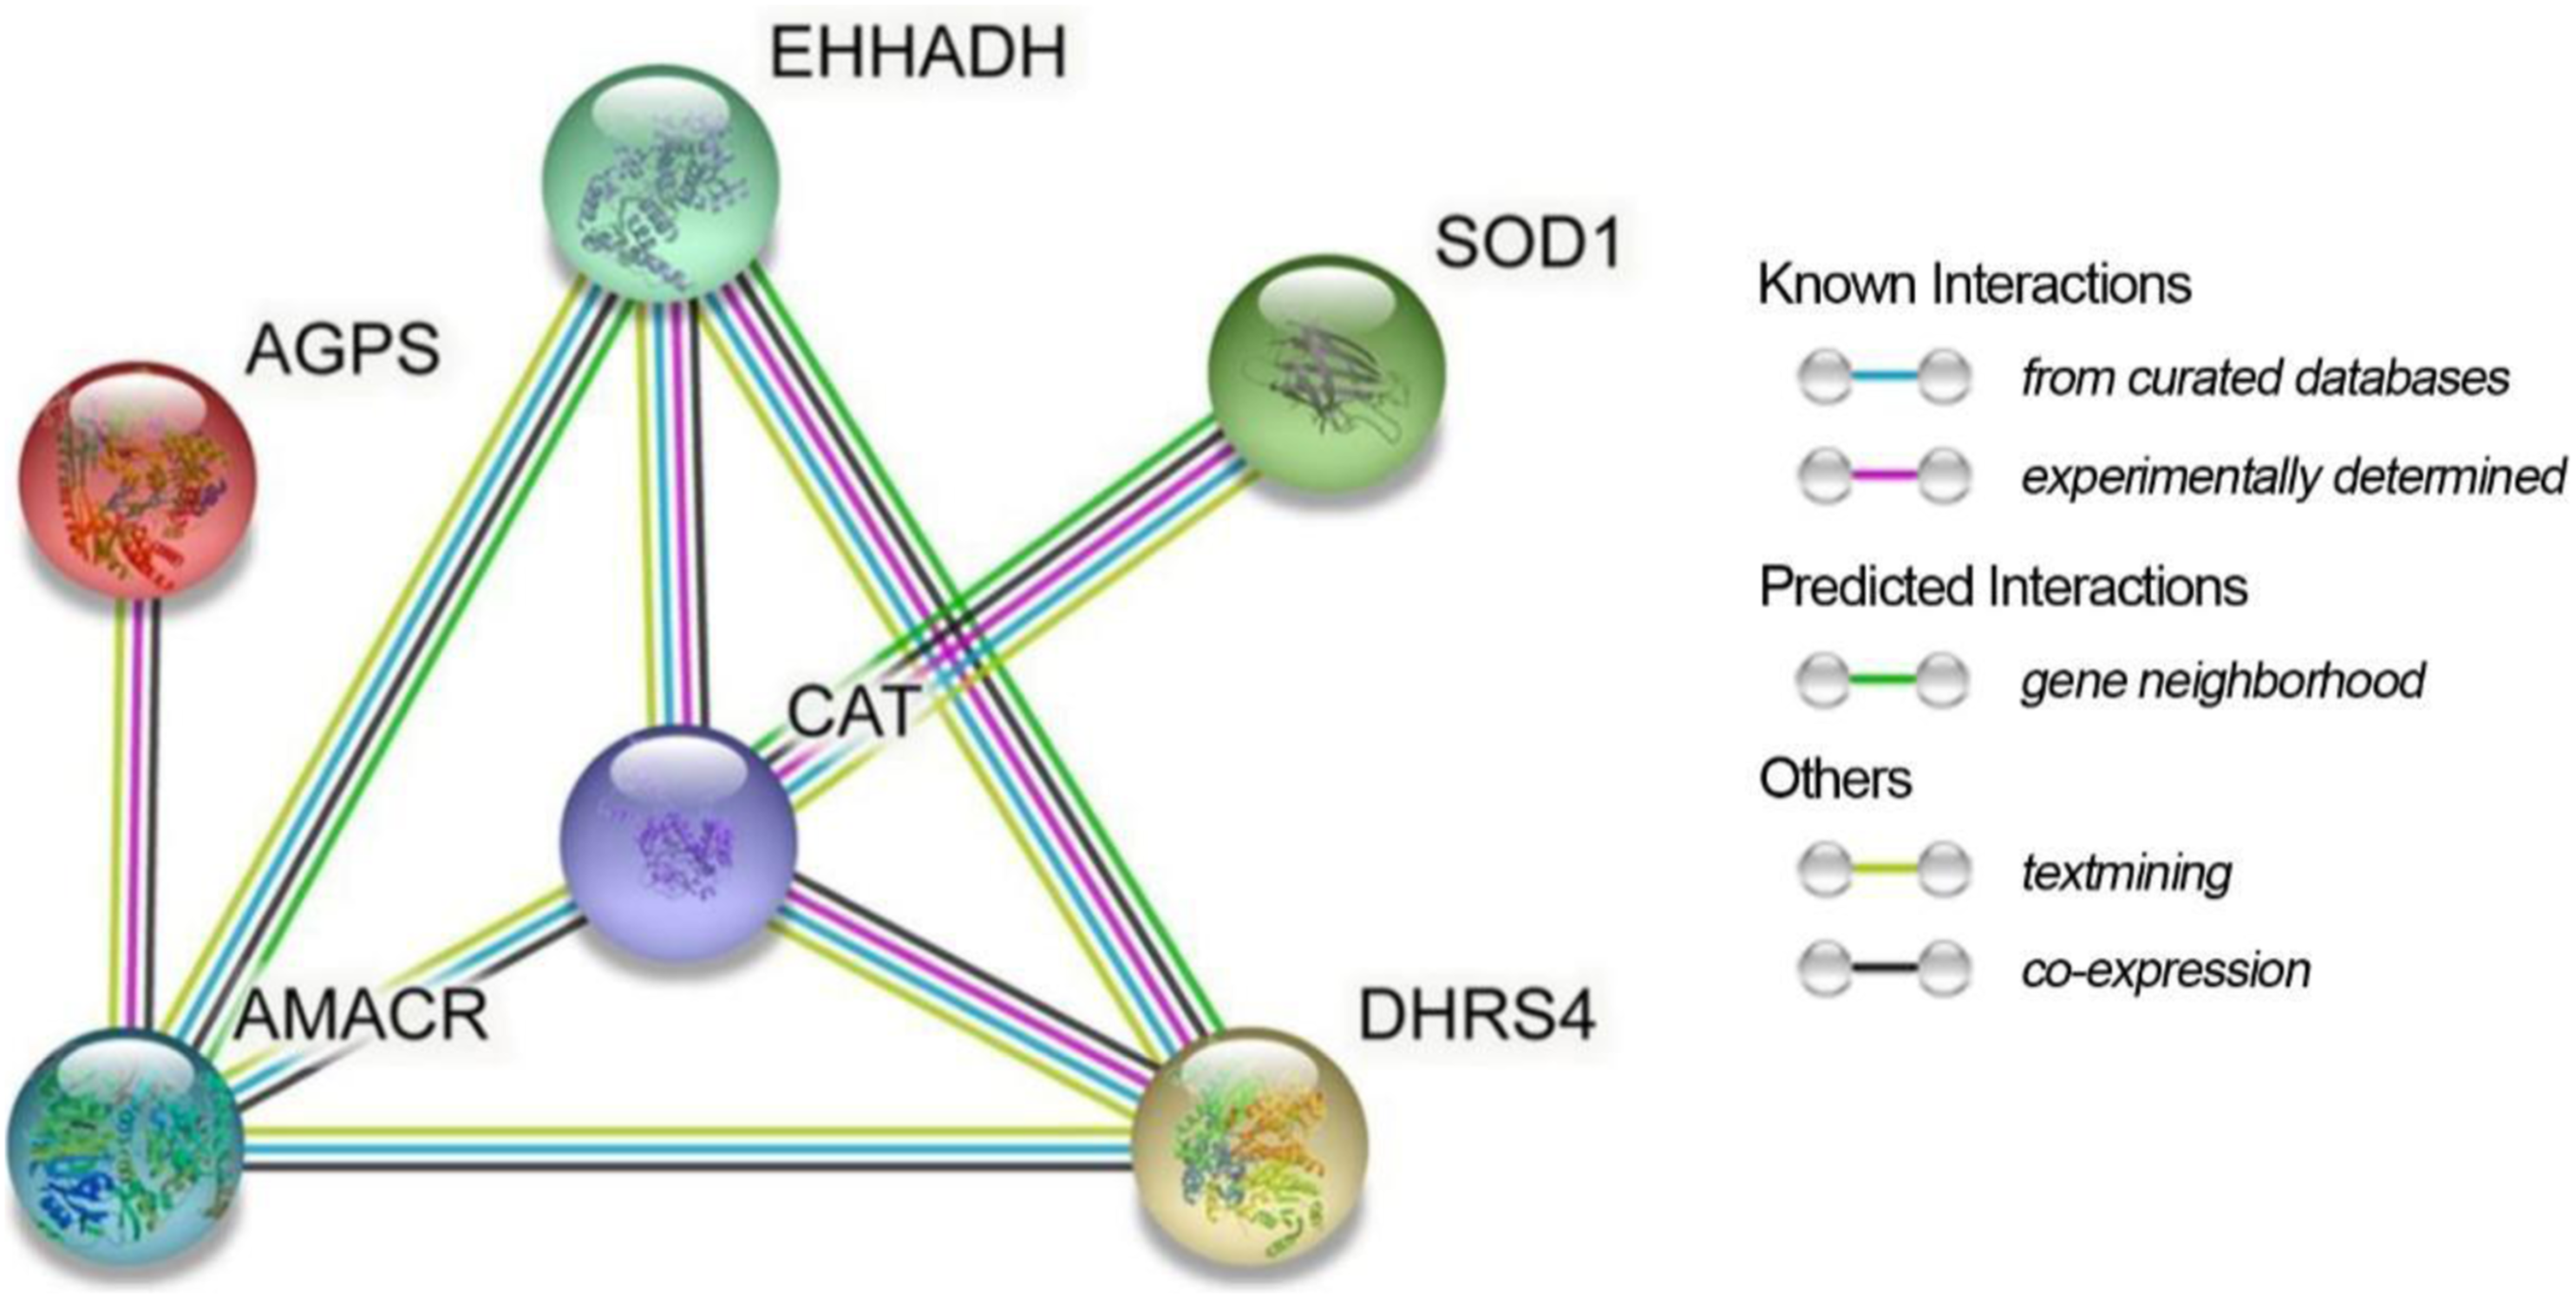
The peptides of the main targeted proteins involved in FAO and antioxidant activity were verified using the PRM validation method, and the detailed data were presented in Supplementary Table 2. Consistent with the non-targeted phosphoproteomicdata, phosphorylation levels of AMACR, superoxide dismutase-1 (SOD-1), Catalase (CAT), alkylglyceronephosphate synthase (AGPS), dehydrogenase/reductase SDR family member 4 (DHRS4) and enoyl-CoA, hydratase/3-hydroxyacyl CoA dehydrogenase (EHHADH) were significantly down-regulated in model group (Figure 6(a)). Among them, CAT, SOD, DHRS4, AGPS perform a physiological role in the decomposition of ROS.The relative mRNA expression of Amacr, Agps, and Dhrs4 in mice determined by qRT-PCR and the levels of oxidative stress related-indicators in mice, including SOD, MDA, GSH, (Figure 6(c)) were carried out to validate proteomic data, and the results of which showed consistent trends. To better understand the pathogenic mechanisms in VCM-induced nephrotoxicity, a PPI network for these targeted proteins was constructed using STRING database. As Figure 7 shown, these proteins have more interactions among themselves. It is noteworthy that CAT was found in the core regions, which suggests that CAT may play an important role in the development of VCM-induced nephrotoxicity. Altered expression of proteins involved in FAO and antioxidant activity. (a) Six target phosphorylated peptides of target proteins identified by PRM, the relative expression of AMACR, SOD1, CAT, AGPS, DHRS4, and EHHADH were downregulated in the model group (n = 3). (b) The relative mRNA expression of Amacr, Agps, and Dhrs4 in mice determined by RT-PCR (n = 6). (c) The relative SOD, GSH, MDA levels in mice determined by commercially available kits (n = 6). Data are presented as Mean ± SD. n = 3, * p < 0.05, **p < 0.01, ***p < 0.001 versus control group, respectively. PPI network of these proteins.
Discussion
In the current study, a TMT-labeled quantitative phosphoproteomics technology was applied towards systematic analyses of the molecular mechanism of VCM-induced nephrotoxicity in the mouse model. Just what we know, this is the first study to characterize the phosphorylation event caused by VCM-induced nephrotoxicity in mice. Finally, we found that the disorder signaling involved in peroxisome pathway and PPAR signaling pathway were significant factors associated with VCM-induced nephrotoxicity. VCM resulted in the abnormalities of peroxisomal morphology and function via regulating peroxisome biogenesis-related gene, peroxisomal FAO-related gene, and peroxisomal antioxidant enzyme. The effects of VCM on FAO are closely linked to the PPARα transcriptional activity. The above results provide stronger signaling evidence to clarify the molecular mechanism of VCM-induced nephrotoxicity.
Multiple lines of evidences advocated that peroxisomal dysfunction was involved in the molecular pathogenesis of kidney injury.25–27 In our results, we observed that the abundance of peroxisomes after VCM treatment was decreased, which is similar to the previous study regarding to cisplatin nephrotoxicity.28,29 Consistently, significant down-regulation of peroxisomal genes involved in peroxisomal biogenesis-related gene PGC1α and PPARα was observed in mice with VCM treatment in our study. Interestingly, the result from immunofluorescence analysis demonstrated that the peroxisomes abundance is markedly decreased. These above findings strongly suggested a link between the peroxisomes abundance and peroxisomal gene transcription. In addition, we observed that the phosphorylated level of PEX5 was changed by VCM in mice, which is consistent with the previous study. 30 The up-regulated phosphorylated level of PEX5 may be negative feedback for the decrease of peroxisomes abundances after VCM treatment. Notably, peroxisomes are versatile organelles with a large number of biological tasks, including FAO as well as the decomposition of ROS.31–33 One study demonstrated that the peroxisomal initial and rate-limiting ACO could contributes to the loss of FAO capacity in cisplatin-induced nephrotoxicity. 34 Another study has proved that EHHADH knockout mice are more susceptible to kidney injury, 35 which catalyzes the second and third step of peroxisomal FAO. Consistent with the previous study,34,35 our results showed that the phosphorylated levels of ACO and EHHADH were significantly down-regulated in mice with VCM-induced nephrotoxicity. Moreover, it found the phosphorylation of peroxisomal AMACR was decreased, which plays an essential role in regulating β-oxidation of branched chain fatty acids. 36 These changes were paralleled in kidney MDA involved in lipid peroxidation (Figure 6(c)). Substantial study demonstrated that peroxisomal antioxidant enzymes exerts an important role in oxidative stress, such as CAT, SOD, AGPS.39,40 CAT located in the membrane of peroxisomes can reduce cytotoxic oxygen radicals by catalyzing the conversion of H2O2 to molecular oxygen and water for further protecting cells from oxidative stress. 41 SOD, which has been found in peroxisomes, performs a physiological role in ROS scavenging. 42 AGPS plays an important role in the synthesis of plasmalogen, which protects membrane lipids against oxidation. 43 In the current study, we observed that the phosphorylation of CAT, SOD, and AGPS was significantly down-regulated by VCM. Obviously, the enriched molecular function “oxidoreductase activity” observed in this study was correlated with a reduction in antioxidant activities (SOD, CAT, and AGPS). Our result is consistent with the our previous study and other’s study concerning that oxidative stress is involved in the pathogenesis of VCM nephrotoxicity.37,38 Collectively, the above findings demonstrated that VCM may result in the abnormalities of peroxisomal morphology and function.
PPARs, the members of the nuclear hormone receptor superfamily, were increasingly recognized as contributing factors in kidney injury. 44 Among the members of this superfamily, PPARα is highly expressed in proximal tubular cells and lower expressed in glomerular cells such as mesangial cells and podocytes.44,45 Previous studies reported that PPARα is a key transcriptional regulator responsible for the activity of enzymes involved in FAO, especially ACO.45,46 Moreover, the FAO capacity is reduced in PPARα null mice. 47 Excessive fatty acid loading in kidney tissues can result in the toxicity of proximal tubular epithelial cells. This subsequently leads to the development of kidney disease.48,49 A recent study demonstrated that defective FAO due to zoledronate treatment was an important factor contributing to its nephrotoxicity via downregulating PPARα and its targeted gene ACO. Complementarily, PPARα agonist Fenofibrate partially mitigates zoledronate-induced nephrotoxicity. As expected, the downregulation of PPARα was observed in the kidneys of VCM-treated mice in our study. Along with the downregulation of PPARα, we observed the downregulation of the phosphorylation of FAO-related proteins in the kidneys of VCM-treated mice, such as ACO, EHHADH, AGPS, and SCPX, which are consistent with previous study. 50 Altogether, the above evidence obtained in this study indicated that the effects of VCM on FAO are closely linked to PPARα transcriptional activity. However, whether the changes of ACO, SCPX, AGPS, and EHHADH expression induced by VCM depend on PPARα is still to be discovered. It will be of particular interest to determine whether VCM could decrease renal ACO, SCPX, AGPS, and EHHADH expression in PPARα deficient mice. In addition, another limitation of this study is that changes in lipid metabolite levels were not detected during the process of VCM-induced nephrotoxicity. Indeed, it will be exploreded in the further study, and we plan to investigate the effects of VCM on lipid metabolite levels via lipidomic analysis.
Overall, our results indicated that VCM results in the abnormalities of peroxisomal morphology and function via regulating peroxisome biogenesis-related protein, peroxisomal FAO-related protein, and peroxisomal antioxidant enzyme. In addition, we found that PPAR signaling pathways are the key point of VCM-induced nephrotoxicity. Admittedly, confirmatory experiments are required to verify the presence of cellular responses due to PPARα activity. Some substantial changes caused by VCM play an important role in VCM-induced nephrotoxicity process, such as the phosphorylation regulation of uptake transporters. It warrants consideration in the future study. Nonetheless, this study offers novel potential insight into the mechanism of VCM-induced nephrotoxicity. It can assist in the identification of new targets for the development of new therapeutic approaches on VCM-induced nephrotoxicity.
Conclusions
In summary, this study showed that VCM-induced nephrotoxicity is closely associated with the abnormal signaling involved in the peroxisome pathway and PPAR signaling pathways. Restoring the disorder signaling involved in peroxisome and PPAR signaling pathways by pharmacological or genetic means could mitigate the progression of nephrotoxicity. This study provided an important mechanistic insight into VCM-induced nephrotoxicity that can help establish a protection mechanism for the clinical application of VCM by modulating peroxisome pathway and PPAR signaling pathways.
Supplemental Material
Supplemental Material - Analysis of kidney proteomes to identify biological pathways associated with vancomycin-induced nephrotoxicity in mice by tandem mass tag-labeled quantitative and parallel reaction monitoring phosphoproteomics
Supplemental Material for Analysis of kidney proteomes to identify biological pathways associated with vancomycin-induced nephrotoxicity in mice by tandem mass tag-labeled quantitative and parallel reaction monitoring phosphoproteomics by Qiaoling Yang, Xuedong Yin, Hongjing Li, Lili Ding, Huajun Sun, Li Yang and Zhiling Li in Human & Experimental Toxicology
Footnotes
Acknowledgements
We would like to acknowledge the members of Shanghai Applied Protein Technology Co. Ltd. (Shanghai, China) for their kind help in a tandem mass tag (TMT)-labeled quantitative and parallel reaction monitoring phosphoproteomic analysis. We also appreciate Xunjiang Wang’s help in drawing picture and Yuanye Qiu’s help in editing the manuscript.
Author contributions
Zhiling Li, Li Yang, and Qiaoling Yang conceived and designed the research. Qiaoling Yang, Xuedong Yin, and Hongjing Li conducted the experiments and analysis. Qiaoling Yang, Hongjing Li, and Xuedong Yin analyzed data. Qiaoling Yang and Xuedong Yin drafted the manuscript. Qiaoling Yang, Xuedong Yin, Yuanye Qiu, Zhiling Li, and Li Yang revised the manuscript. Lili Ding, and Huajun Sun contributed to discussion of the work. All authors reviewed and approved the manuscript.
Declaration of conflicting interests
The author(s) declared no potential conflicts of interest with respect to the research, authorship, and/or publication of this article.
Funding
The author(s) disclosed receipt of the following financial support for the research, authorship, and/or publication of this article: This work was supported by Shanghai Sailing program (Grant No. 21YF1437900), Interdisciplinary Program of Shanghai Jiao Tong University (Grant No.YG2019QNA03), Special cultivation project of National Natural Science Foundation of Shanghai Children’s Hospital (Grant No. 2020YGZQ08) to Qiaoling Yang, and Science and Technology Commission of Shanghai Municipality (No. 21DZ2300700), Shanghai “Rising Stars of Medical Talent” Youth Development Program “Outstanding Youth Medical Talent” (Grant No. SHWSRS (2021) 099), Shanghai Talent Development Funding (Grant No. 2020110) to Zhiling Li.
Data availability statement
The datasets used or analysed during the current study are available from the corresponding author on reasonable request.
Supplemental Material
Supplemental material for this article is available online.
Appendix
References
Supplementary Material
Please find the following supplemental material available below.
For Open Access articles published under a Creative Commons License, all supplemental material carries the same license as the article it is associated with.
For non-Open Access articles published, all supplemental material carries a non-exclusive license, and permission requests for re-use of supplemental material or any part of supplemental material shall be sent directly to the copyright owner as specified in the copyright notice associated with the article.