
Abstract
The present study aimed to clarify the expressions and roles of clock genes involved in drug metabolism in patients taking benzodiazepines (BZDs), as well as the drug metabolism regulators controlled by clock genes for each BZD type. The relationships between the expressions of the clock genes BMAL1, PER2, and DBP and the drug-metabolizing enzymes CYP3A4 and CYP2C19 were investigated using livers from BZD-detected autopsy cases. In addition, the effect of BZD exposure on various genes was examined in HepG2 human hepatocellular carcinoma cells. The expressions of DBP, CYP3A4, and CYP2C19 in the liver were lower in the diazepam-detected group than in the non-detected group. Furthermore, BMAL1 expression correlated with CYP2C19 expression. Cell culture experiments showed that the expressions of DBP and CYP3A4 decreased, whereas those of BMAL1 and CYP2C19 increased after diazepam and midazolam exposure. The results of the analyses of autopsy samples and cultured cells suggested that DBP regulates CYP3A4 when exposed to BZD. Understanding the relationship between these clock genes and CYPs may help achieve individualized drug therapy.
Introduction
Clock genes form a negative feedback loop in the transcription/translation mechanism, generating a circadian rhythm of approximately 24 h in physiological mechanisms such as blood pressure, body temperature, and hormone secretion. 1 Based on the circadian clock, a molecular mechanism centering on the E-box sequence is important for the development of the circadian rhythm. BMAL1 has a transcriptional activation effect, and PER2 has a transcriptional repressive effect on the E-box sequence, which induces circadian oscillations. 2 Furthermore, DBP is a clock gene that is regulated by E-box and forms circadian rhythms. DBP promotes D-box sequences and belongs to the PAR-bZip transcription factor family. 3 However, clock genes are also involved in the expression of cytochrome P450 (CYP), which is involved in drug metabolism, causing time-dependent changes in drug metabolism. 4 Furthermore, the expression of the human CYP3A4 gene exhibits circadian rhythms through the PAR-bZip transcription factor. 5
In drug intoxication-related deaths, fatal side effects may occur even in the therapeutic range, which makes it difficult to diagnose the cause of death and understand its pathophysiology. Conversely, in the fields of clinical medicine and pharmacology, pharmacokinetics and drug efficacy in the body differ greatly depending on the time of administration. 6 Therefore, there is a period during which fatal side effects due to drug ingestion are likely to occur, even in cases of death from drug poisoning. One study reported that clock gene expression is affected by the concentration of methamphetamine and the elapsed time after administration. 7 Moreover, benzodiazepines (BZDs), which have anxiolytic and hypnotic effects, also act on the body clock. 8 CYP3A4 and CYP2C19 are mainly involved in the metabolism of BZDs.9,10 However, many points about the relationships between clock genes and CYP3A4 and CYP2C19 after taking BZDs are still unclear.
Thus, the present study aimed to clarify the expressions and roles of clock genes involved in drug metabolism in patients taking BZDs and drug metabolism regulators controlled by clock genes for each BZD type. The results of the analyses of autopsy samples suggest that DBP in the human liver regulates CYP3A4 under BZD exposure. In a culture experiment using HepG2 cells, the same expression pattern as in the human liver was observed following BZD exposure. However, the possibility that the autopsy cases were affected by multiple drugs in addition to BZD and the time after drug intake could not be excluded. Thus, the results demonstrate the relationship between clock genes and CYPs under BZD exposure and provide useful information for achieving individualized drug therapy.
Methods
Ethics statement
The protocol of the present study was evaluated and approved by the Independent Ethics Committee of the Osaka Metropolitan University Graduate School of Medicine. An opt-out form of informed consent was approved for the use of autopsy data for analysis (Authorization no. 4404).
Human samples
Case profiles.

Detected drugs and concentrations of benzodiazepines (BZDs).

Measurement of BZDs
Benzodiazepines were extracted using a Gilson ASPEC XL-274 automated SPE solid/liquid-phase extraction instrument (Middleton, WI, USA). As an internal standard, a 50-µL solution containing d5-diazepam at a concentration of 10 µg/mL was added to 0.5 mL of each sample. The pH of the samples was adjusted to approximately 7.0 by adding 6 mL of 0.1-M potassium phosphate buffer (pH of 6.0). Then, 0.5 mL of the sample mixed with the internal standard was centrifuged at 2500×g for 5 min and aspirated using an HF-Bond Elut Certify Column (Agilent Technologies, Santa Clara, CA, USA). The column was preconditioned with 2 mL of methanol and 0.1-M potassium phosphate buffer (pH 6.0). After the sample preparation, the column was successively washed with 1 mL of 0.1-M potassium phosphate buffer (pH 6.0), 1 mL of 1-M acetic acid, and 1 mL of methanol. Finally, the analytes were eluted using 3 mL of freshly prepared dichloromethane/isopropanol (78:20) in ammonium hydroxide. The eluate was collected and evaporated to dryness in a nitrogen atmosphere at room temperature. The residue was reconstituted using 100 μL of ethyl acetate, and 1 μL of the extracted sample was injected into a gas chromatography/mass spectrometry (GC/MS) system. Standard recovery rates ranged from 65.8% to 88.6% (mean, 79.8%). After SPE solid/liquid-phase extraction, automated GC/MS was performed using an Agilent Technologies GC/MS system (model 5975c MSD; column, DB-5MS, 30 m × 0.25 mm i.d., film 0.25 μm; column temperature, 100–325°C; injector temperature, 280°C; turbocharged carrier gas, He at a flow rate of 48 cm/s; interface temperature, 300°C). 12
Total RNA extraction and qRT-PCR analysis
Total RNA was isolated using an Isogen kit (Nippon Gene, Toyama, Japan) following the manufacturer’s instructions. Then, cDNA was synthesized from total RNA using a High-Capacity RNA-to-cDNA Kit (Applied Biosystems, Foster City, CA, USA). The quantitative reverse transcription (qRT)-polymerase chain reaction (PCR) was performed by adding 20.0 μL of the reaction mixture, consisting of 10.0 μL of TaqMan gene expression master mix (2×), 1.0 μL of TaqMan gene expression assay (20×), 4 μL of cDNA, and 5 μL of H2O, to each well of a 96-well reaction plate (0.1 mL/well). Primers (sequences not disclosed by the manufacturer) for the transcripts encoding aryl hydrocarbon receptor nuclear translocator-like protein (ARNTL/BMAL1) (TaqMan assay ID: Hs00154147_m1), period circadian clock protein 2 (PER2) (TaqMan assay ID: Hs00256143_m1), D-box binding PAR-bZip transcription factor (DBP) (TaqMan assay ID: Hs00609747_m1), cytochrome P450 family three subfamily A member 4 (CYP3A4) (TaqMan assay ID: Hs00604506_m1), and cytochrome P450 family two subfamily C member 19 (CYP2C19) (TaqMan assay ID: Hs00426380_m1) were used with a StepOnePlus real-time PCR system (Applied Biosystems). A threshold of 0.2 was used, and the software automatically calculated the threshold cycle (Ct) value. 13 As a preliminary step, the stability of several endogenous reference genes (Actinβ, β2M, GAPDH, HMBS, HPRT1, PPIA, and TBP) in the liver was tested. Consequently, HMBS (TaqMan assay ID: Hs00609297_m1) was selected as the most stable endogenous reference gene. 14
Effect of BZDs on HepG2 cells
The effects of BZD exposure were evaluated using HepG2 cells (Cellular Engineering Technologies, Coralville, IA, USA). Cells were cultured in HepG2 hepatocellular carcinoma expansion medium (Cellular Engineering Technologies) supplemented with 10% fetal bovine serum (Product No. 04–121-1A, Biological Industries Ltd., Kibbutz Beit-Haemek, Israel) and adjusted to 1.5 × 10⁵ cells/well in 24-well plates. Benzodiazepine-treated experiments were performed the next day. Cells were cultured in an incubator with 4.7% CO2 at 37°C. Cells were counted using a Cell Counter model R1 (Olympus Optical Co., Ltd., Tokyo, Japan). Benzodiazepines were added to the cell cultures at final concentrations of 20 µg/mL for diazepam, 2 µg/mL for midazolam, 0.6 µg/mL for alprazolam, 1.25 µg/mL for estazolam, and 0.04 µg/mL for triazolam per well (n = 4 for each). These BZDs were dissolved in dimethyl sulfoxide (DMSO). As a negative control, DMSO was added to cell cultures (n = 4). At 1, 3, and 6 h after BZD exposure, cells were collected, and gene expression was analyzed by RT-PCR.
Statistical analysis
Spearman correlation coefficients were used to compare between-group differences. The nonparametric Mann-Whitney U test was used to compare two groups, and the Kruskal-Wallis test was used for multiple comparisons. Graphs of test results for the autopsy samples are shown as box and whisker plots, with the horizontal line in each box indicating the median. Box whiskers indicate 90% confidence intervals. Circles and asterisks indicate outliers and unexplained outliers, respectively. Maximum gene expression values were log-transformed for graphical presentation. The results of cell culture experiments are presented as bar graphs, in which the bar and whiskers indicate the mean and standard deviation, respectively. All analyses were performed using SPSS statistics for Windows version 9.0 (SPSS, Inc., Chicago, IL, USA). Values of p < 0.05 were considered to indicate statistical significance. 15
Results
Relationships between clock gene expressions and time of death
No significant difference was found between the time of death and BMAL1 expression in the BZD-detected group. PER2 expression in the BZD-detected group was higher in individuals who died at 16–20 o’clock than in those who died at 0–4 o’clock (Figure 1(a) and (b)). DBP expression in the BZD-detected group was higher in individuals who died at 8–12 o’clock than in those who died at 0–4 and 12–16 o’clock (Figure 1(c)). CYP3A4 and CYP2C19 expressions in the BZD-detected group tended to be higher in individuals who died at 8–12 o’clock, similar to DBP expression (Figure 2). However, in the non-detected group, the BMAL1 expression of individuals who died at 20–24 o’clock was higher than of those who died at 8–12 o’clock. However, no significant differences were noted in the time of death by PER2, DBP, CYP3A4, and CYP2C19 expressions. Gene expressions in liver tissue of autopsy cases, categorized by time of death. Expressions of BMAL1 (a), PER2 (b), and DBP (c) in liver samples recovered at autopsy. Data are presented as box and whisker plots, in which the central horizontal line in each box represents the median. The boxes span the interquartile range, and the whiskers represent the 90% confidence interval. Circles represent outliers, and asterisks represent abnormal values. Gene expressions in liver tissue of autopsy cases categorized by time of death. Expressions of CYP3A4 (a) and CYP2C19 (b) in liver samples recovered at autopsy. Data are presented as box and whisker plots, in which the central horizontal line in each box represents the median, the boxes span the interquartile range, and the whiskers represent the 90% confidence interval. Circles represent outliers, and asterisks represent abnormal values.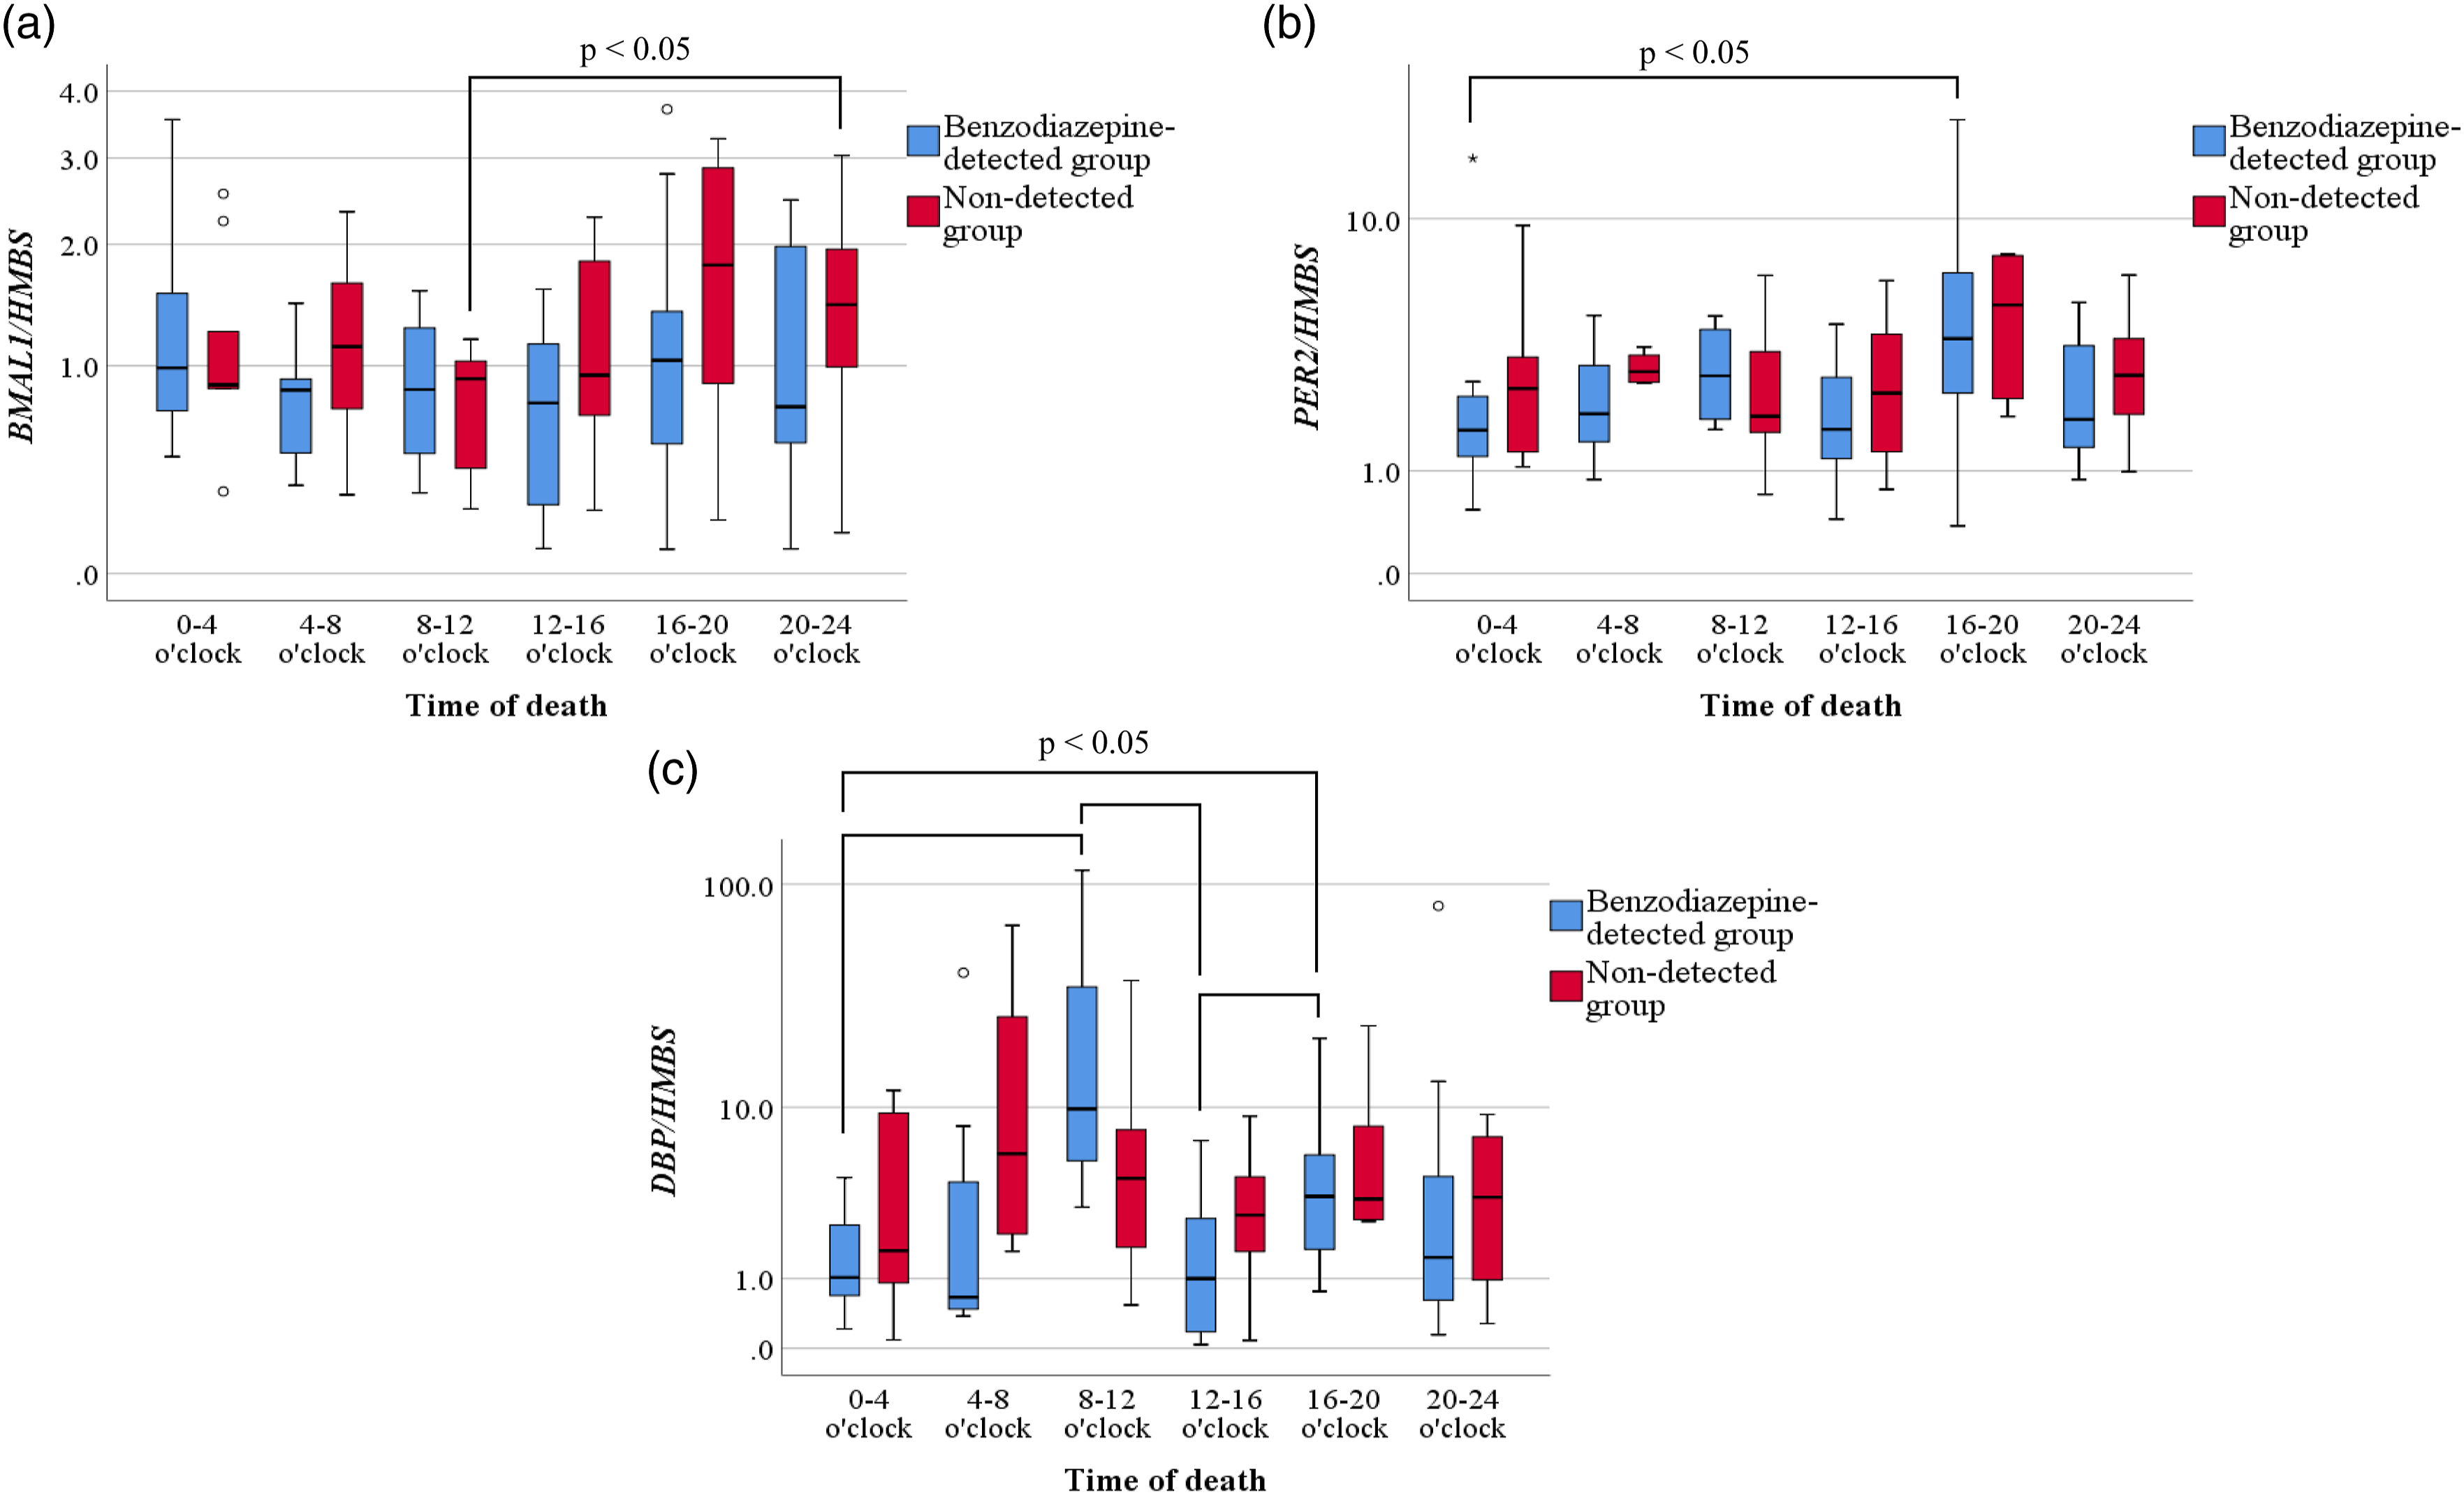

Effects of BZDs on liver tissue
The expressions of BMAL1 and PER2 did not show significant differences among the BZD-detected subgroups (Figure 3(a) and (b)). The expression of DBP was lower in the diazepam-detected group than in the non-detected group (Figure 3(c)). Furthermore, the expression of CYP3A4 was lower in the diazepam-detected group than in the midazolam-detected group, other single BZD-detected groups, and the non-detected group (Figure 4(a)). The expression of CYP2C19 was lower in the diazepam-detected group than in the midazolam-detected group, estazolam-detected group, other single BZD-detected groups, and the non-detected group (Figure 4(b)). Gene expressions in liver tissues of autopsy cases, categorized by the kind of benzodiazepines detected. Expressions of BMAL1 (a), PER2 (b) and, DBP (c) in liver samples collected at autopsy. Data are presented as box and whisker plots, in which the central horizontal line in each box represents the median, the boxes span the interquartile range, and the whiskers represent the 90% confidence interval. Circles represent outliers, and asterisks represent abnormal values. Gene expressions in liver tissues of autopsy cases, categorized by the kind of benzodiazepines detected. Expressions of CYP3A4 (a) and CYP2C19 (b) in liver samples collected at autopsy. Data are presented as box and whisker plots, in which the central horizontal line in each box represents the median, the boxes span the interquartile range, and the whiskers represent the 90% confidence interval. Circles represent outliers, and asterisks represent abnormal values.

Correlations between clock genes and CYP expressions in liver tissue
In the diazepam-detected group, a positive correlation was found between the expression of BMAL1 and CYP2C19 (r = 0.629, p < 0.05). No correlations were found between clock genes and CYP3A4 and CYP2C19 expressions in the midazolam-detected, estazolam-detected, and non-detected groups.
Effects of BZDs on clock gene expressions in HepG2 cells
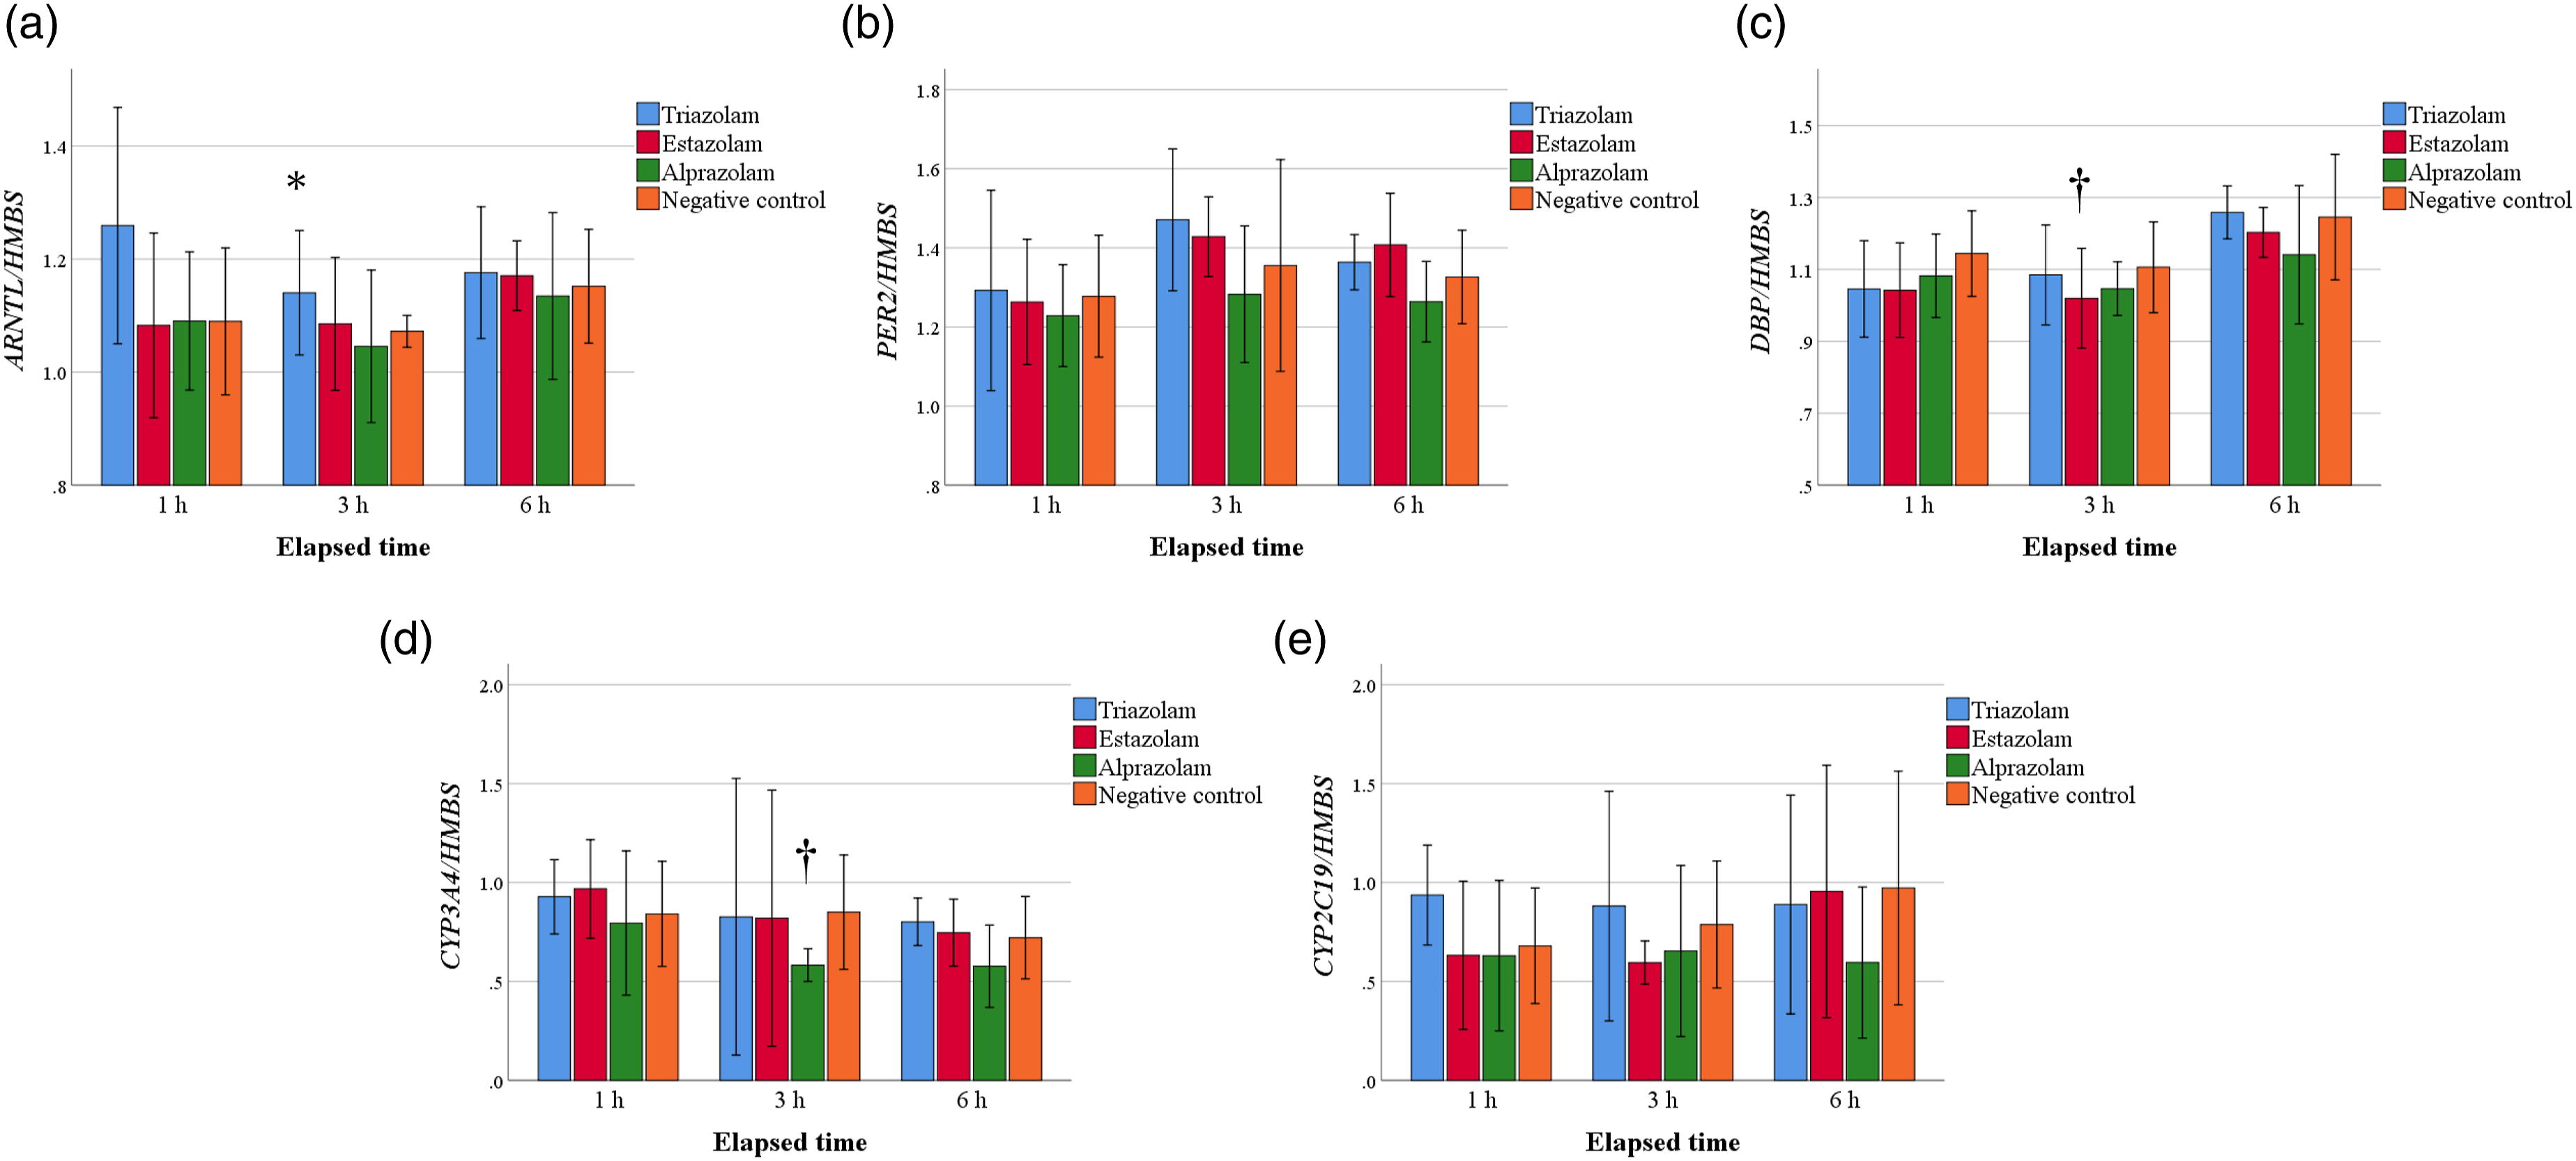
The expression of BMAL1 was higher 6 h after diazepam or midazolam exposure than in the negative control (p < 0.05) (Figure 5(a)). Moreover, the expression of PER2 was lower 1 h after diazepam exposure and 6 h after diazepam exposure than in the negative control (p < 0.05) (Figure 5(b)). The expression of DBP was lower 1 h after diazepam or midazolam exposure than of three of the negative controls (p < 0.05) (Figure 5(c)). However, clock gene expressions did not show slight changes after exposure to other BZDs (Figure 6(a) to (c)). Expressions of BMAL1 (a), PER2 (b), DBP (c), CYP3A4 (d), and CYP2C19 (e) in HepG2 cells after diazepam or midazolam exposure. Data are presented as bar charts, in which the bars show the means, and the whiskers show the standard deviations. *Significantly higher than negative control. †Significantly lower than negative control. Expressions of BMAL1 (a), PER2 (b), DBP (c), CYP3A4 (d), and CYP2C19 (e) in HepG2 cells after exposure to other benzodiazepines. Data are presented as bar charts, in which the bars show the means, and the whiskers show the standard deviations. *Significantly higher than negative control. †Significantly lower than negative control.
Effects of BZDs on CYP expressions in HepG2 cells
The expressions of CYP3A4 were lower 3 and 6 h after midazolam exposure than in the negative control (p < 0.05). The expressions of CYP3A4 were lower 3 and 6 h after diazepam exposure than in the negative control group (p < 0.05) (Figure 5(d)). The expression of CYP2C19 was higher 3 h after diazepam or midazolam exposure than in the negative control group (p < 0.05). Moreover, the expression of CYP2C19 was higher 6 h after diazepam exposure than in the negative control group (p < 0.05) (Figure 5(e)). However, expressions of CYPs did not show slight changes after exposure to other BZDs (Figure 6(d) and (e)).
Discussion
Benzodiazepines are among the most commonly prescribed drugs worldwide and are used to treat a variety of psychiatric, sleep, and anxiety disorders.16,17 Benzodiazepine abuse and dependence are also global problems and are responsible for the majority of fatal overdose cases.18,19 On the other hand, drug-metabolizing enzymes such as CYP3A4 and CYP2C19, are mainly involved in BZD metabolism.9,10 Since clock genes are involved in CYP regulation, it is expected that the extent of side effects will differ according to the time of drug intake. 4 Additionally, elucidation of the pathophysiology of the fatal side effects of BZD is useful for diagnosing intoxication. However, the relationship between clock genes and drug-metabolizing enzymes in human liver tissue remains unclear. The present study was conducted to clarify the expressions and roles of clock genes involved in drug metabolism in cases taking BZD using human autopsy samples.
In the present study, no clear circadian rhythm was observed, except for some time periods. However, in the BZD-detected group, CYP3A4 and CYP2C19 expressions tended to be higher at 8–12 o’clock than in other time periods, similar to DBP expression. Takiguchi et al. reported that the rhythmic expression of CYP3A4 was almost the same as of PER2 and DBP. 5 However, the expression patterns of CYP3A4 and DBP in the present study differed from that of PER2. It was also reported that CYP2C19 is not rhythmically expressed, 20 but CYP2C19 showed the same expression pattern as DBP. Therefore, the expressions of DBP, CYP3A4, and CYP2C19 in the human liver may not be caused by circadian rhythms.
It has been reported that different types of BZDs have different potencies and toxicities.21,22 On classifying each detected BZD and comparing gene expressions, no differences in gene expression were observed for BMAL1 and PER2. The expressions of DBP, CYP3A4, and CYP2C19 in the diazepam-detected group were lower than those of the BZD-detected and non-detected groups. Therefore, DBP expression was suspected to be related to CYP3A4 and CYP2C19 expressions, especially among BZDs, which were suspected to be susceptible to diazepam.
Cell culture experiments showed that DBP expression decreased after exposure to diazepam or midazolam, and CYP3A4 showed comparable results. Furthermore, this result was consistent with DBP and CYP3A4 gene expressions in liver tissue. A previous study using mouse models reported that Bmal1 indirectly regulates Cyp3a11 (CYP3A4 in humans) by activating Dbp. 4 In the present study, DBP and CYP3A4 expressions in human liver and HepG2 cells showed comparable expression patterns, suggesting that DBP directly affected CYP3A4 expression under BZD exposure. Since BMAL1 is indirectly involved, no similarity in the expression pattern with CYP3A4 was presumed. In contrast, BMAL1 expression increased 6 h after exposure to diazepam or midazolam, and CYP2C19 expression increased from 3 h. Since BMAL1 showed delayed gene expression, whether BMAL1 was directly involved was unclear. However, BMAL1 and CYP2C19 expressions in the liver tissue of the diazepam-detected group showed a correlation, suggesting comparable expression patterns with drug exposure. Although CYP2C19 expression after diazepam exposure differed between human liver tissue and cultured cells, diazepam metabolites and other co-detected drugs may have an effect on human liver tissue. 23 PER2 expression was partially associated with BZD, but was not associated with any drug-metabolizing enzymes.
The findings of this study must be considered in light of some limitations. Among the autopsy cases included in the study, there were cases in which multiple drugs were taken in addition to BZDs, and the time of drug intake was unclear. However, assessing their effects was difficult, so the possibility that they were affected by these other drugs and time after drug intake could not be excluded. CYP3A4 and CYP2C19 are involved in the metabolism of a wide range of drug substances.24–26 Generally, interactions between BZD and other drugs and nutrients affect the expression (induction or inhibition) of drug-metabolizing enzymes,27–29 and it is thought that clock gene expression is similarly affected. In addition, the difference observed between human liver tissue and cultured cells in the present study may be due to drug interactions. It is also possible that the time elapsed after drug intake also affected the expression of each gene. 7 Taking these factors into consideration, by understanding the effects of drugs on clock genes and mechanisms by which clock genes regulate drug-metabolizing enzymes, determining the risk of fatal side effects caused by drugs at different times of ingestion may be possible. Understanding the relationship between these clock genes and CYPs may be useful to achieve individualized drug therapy. Moreover, elucidation of the relationship between not only drug-metabolizing enzymes but also drug transporters responsible for the permeation of drugs through biological membranes and clock genes,30,31 it may provide insight into the construction of drug delivery systems and the optimization of drug treatments. 32
In conclusion, the results of the analyses of autopsy samples suggest that DBP in the human liver regulates CYP3A4 under BZD (diazepam) exposure. In a culture experiment using HepG2 cells, the same expression pattern as in the human liver was observed after BZD exposure. Understanding the relationships between these clock genes and CYPs may help achieve individualized drug therapy.
Footnotes
Declaration of conflicting interests
The author(s) declared no potential conflicts of interest with respect to the research, authorship, and/or publication of this article.
Funding
The author(s) received no financial support for the research, authorship, and/or publication of this article.
Data availability
All data generated or analyzed during this study are included in this published article and its supplementary information files.