
Abstract
The widespread use of acetaminophen (APAP) in children as an over-the-counter treatment can cause acute liver failure through accidental overdose or ingestion. Therefore, the current research sought to investigate the function of hemin in mitigating the acute hepatotoxic effect of APAP in rat offspring. Thirty-two rats were assigned into four groups: control, hemin, APAP, and hemin/APAP groups. Liver enzymes were measured in serum along with oxidative stress indicators, tumor necrosis factor-α (TNF-α), interleukin-1beta (IL-1β), total nitrites (NOx), and caspase 3 in liver. Immunoblotting of heme oxygenase-1 (HO-1), interleukin-6 (IL-6), Janus kinase 2 (Jak2), and signal transducer and activator of transcription 3 (STAT3) was carried out. The Bax/Bcl2 mRNA expression ratio was determined. A histological study and an immunohistochemical study of phosphorylated STAT3 were also done. Hemin reduced liver enzymes, MDA, TNF-α, NOx, caspase 3, IL-1β, p-STAT3 expression, p-Jak2 expression, IL-6 expression, and Bax/Bcl2 mRNA expression ratio. In contrast, hemin increased GSH, TAC, and the expression of HO-1, improving the histopathological picture of liver tissue. Thus, hemin could ameliorate APAP-induced hepatic toxicity in rat offspring through anti-oxidant, anti-apoptotic, and anti-inflammatory actions with a possible role for the IL-6/HO-1/Jak2/STAT3 pathway.

Introduction
One of the most commonly used antipyretics is paracetamol, which is also known as acetaminophen (N-acetyl-p-aminophenol; APAP). APAP was first known in 1955 when it was first introduced on the market by McNeil Laboratories as a prescribed analgesic and antipyretic drug for children. The fact that APAP has been listed at all the three levels of pain treatment intensity on the WHO analgesic ladder, which exactly outlines the guidelines for the application of analgesic medications, is impressive. 1
When given at the appropriate time and dose, paracetamol is a safe drug for preschool children suffering from symptoms of cough, cold, earache, and fever. Its advantages as an analgesic and an antipyretic, as well as its short-term safety profile, are well-known by both parents and physicians. APAP is widely used as an over-the-counter treatment for fever, pain, and inflammation at conventional therapeutic doses. However, overdoses have been shown to cause liver failure. Overuse by worried parents attempting to lower fevers has generated safety concerns, as have reports of acute hepatotoxicity caused by accidental overdose or ingestion.2,3 In children younger than 6 years of age, toxicity appears to occur following the application of more than 75 mg/kg body weight per day. 4
During metabolism, liver enzymes (Cyp-P450) convert APAP to N-acetyl para-benzoquinone imine (NAPQI), an active metabolite that binds to cellular proteins and causes harm to the liver tissues. The reactive metabolite (NAPQI) is partially removed via the production of glutathione conjugates (GSH). Glutathione-NAPQI is a non-toxic glutathione that is easily eliminated from the body. However, overdosing on acetaminophen depletes GSH, resulting in hepatocellular injury. As a result, glutathione and other enzymatic antioxidants have a pivotal role against acetaminophen-induced hepatotoxicity.5,6
Grievously, with the rising usage of paracetamol in products such as over-the-counter cold medicines or prescribed pain killers, poisoning from paracetamol has recently become more difficult to detect quickly. 7
The main function of heme oxygenase-1 (HO-1) is to control heme metabolism. It is also critical for tissue adaptive inhibition of oxidative injury and inflammation.8,9 In numerous rat models, hemin, the HO-1 enhancer, has been shown to protect against oxidative and inflammatory tissue damage. 10 However, to our knowledge, the effect of hemin on paracetamol-induced liver toxicity has not been evaluated till now.
Therefore, the current experiment was performed to investigate the ameliorative function of hemin on hepatic toxicity induced by acute paracetamol exposure in rat offspring. Diverse biochemical, histological, and immunohistochemical methods were investigated in attempt to identify any probable underlying mechanisms of action. For this aim, different biochemical, histological, and immunohistochemical approaches were investigated to identify the potential underlying mechanistic features.
Materials and methods
Ethics
The study was conducted in accordance with the Basic & Clinical Pharmacology & Toxicology policy for experimental and clinical studies. 11 The approval of the Institutional Ethical Committee’s (Faculty of Medicine, Minia University, Egypt) for the care of experimental animals was obtained (Approval number 8092021).
Animals and experimental design
Mating procedure
Eight adult male Sprague Dawley rats (12–14 weeks old, 200–250 g) and sixteen adult female Sprague Dawley rats (12–15 weeks old, 200–250 g) were supplied by the National Research Center in Giza, Egypt. The study was done at the animal house of the department of Pharmacology, Faculty of Medicine, Minia University, Egypt. The rats were housed under controlled temperatures (22 ± 2°C) and humidity (50 ± 10%), with a 12/12 h light/dark cycle and ad libitum access to a regular pellet diet and tap water. Accommodation was allowed for a week before starting the experiment.
Overnight, male rats mated with the female rats. Day 0 of pregnancy was determined to be the day the spermatozoa were detected in the vaginal smear. Up until a duplicate number of groups was attained, the mating procedure took place over the course of 15 days. During this period, unmated female rats were considered infertile and were not included in the study. 12 There were fourteen pregnant female rats in all, with an 88% success rate for mating. Individually housed pregnant rats were kept in the aforementioned typical lab settings. 13
Animals and experimental design
One week after delivery, pups were randomized to 4 groups (8 rats per each), and maternal rats were rotated daily between cages for feeding and to eliminate maternal effects among groups. The duration of the study was 14 days.14,15 The control group received 0.5 mL/day of the vehicle (i.p.) for 14 days and 1 mL of carboxymethylcellulose (CMC) orally on the 13th day; the hemin group received hemin (50 mg/kg, i.p)16,17 for 14 days; the APAP group received APAP (2 g/kg, p.o.) suspended in CMC on the 13th day 18 ; and the hemin/APAP group received both hemin and APAP as previous.
The paracetamol was obtained from GlaxoSmithKline Co., UK. Hemin (Sigma, St. Louis, MO, United States; 51280) was prepared by mixing it with 0.1 mol/L NaOH, diluting it with saline to 8 mL, and adding 0.1 mol/L HCl to set the pH to 7.4 (vehicle). It was dissolved and kept in the dark. 19 The dosage of hemin was chosen based on prior research.16,17
Sampling
Initial and final body weights were measured. Each animal was administered an i.p. injection of urethane hydrochloride (125 mg/kg). Blood was drawn from the abdominal aorta and centrifuged for 15 min at 4000 r/min (JanetzkiT30 centrifuge, Germany). Then sera were stored at −80°C for biochemical evaluation. Through an abdominal incision, the liver was removed and cleansed. The liver samples were kept at −80°C until they were needed, while the rest of the tissues were embedded in paraffin for histological analysis.
Measurements
Measurement of liver enzymes
Using commercial kits acquired from Spectrum Diagnostic, Egypt, alanine transaminase (ALT) and aspartate transaminase (AST) levels were measured. By observing the concentration of pyruvate hydrazone produced by 2,4-dinitrophenylhydrazine, ALT activity was determined. When an amino group is transferred from aspartate to α-ketoglutarate in AST kits, glutamate is created, which leads to the creation of a colorimetric product proportionate to the amount of AST enzymatic activity present.
Measurement of oxidative stress parameters (MDA, TAC, NOx, GSH)
To identify hepatic oxidative stress markers, lipid peroxidation was measured as a thiobarbituric acid-reacting substance and displayed as equivalents of malondialdehyde (MDA) using 1,1,3,3-tetra methoxy propane as a standard. 20 After copperized cadmium reduced nitrate to nitrite, total nitrite (NOx) was calculated. The Griess reaction, which involves nitrite reacting with a combination of naphthyl ethylenediamine and sulfanilamide, was used to determine the concentration of nitric dioxide (NO2). 21 Total antioxidant capacity (TAC) and reduced glutathione (GSH) were determined using commercial kits (Biodiagnostic, Egypt) as directed by the manufacturer. The response of antioxidants in the sample with a predetermined amount of exogenously supplied hydrogen peroxide was used to determine TAC (H2O2). A portion of the supplied H2O2 was removed by the antioxidants in the sample. Through an enzymatic reaction including the creation of a colorful product from 3,5 dichloro-2-hydroxy benzenesulfonate, the remaining H2O2 was measured colorimetrically. The 5,5′-dithiobis (2-nitrobenzoic acid) reduction process used in the GSH assay method results in a yellow chemical that is directly proportional to GSH content.
Evaluation of hepatic TNF-α and caspase-3
Using ELISA kits purchased from Elabscience Biotechnology Inc., Houston, Texas, USA, tumor necrosis factor-alpha (TNF-α), interleukin-1beta (IL-1β), and caspase-3 were measured. The evaluation was carried out in accordance with the manufacturer’s recommendations. These kits applied the Sandwich-CLIA method. This kit’s micro CLIA plate was pre-coated with a rat TNF- or caspase-3-specific antibody. The micro CLIA plate wells were filled with standards or samples and then the particular antibody was added. Then each microplate well received consecutive additions of an Avidin-Horseradish Peroxidase (HRP) combination and a biotinylated detection antibody specific for rat TNF-α or caspase-3, followed by incubation. To each well, the substrate solution was applied. The avidin-HRP conjugate and the biotinylated detection antibody only fluoresced in the wells containing rat TNF-α or caspase-3. The chemiluminescence immunoassay analyzer measured the relative light unit (RLU) value. Rat TNF-α, IL-1β, and caspase-3 levels all had a positive correlation with the RLU value.
Immunoblotting of HO-1 and IL-6
After boiling liver homogenates (50 g of total proteins) for five minutes in a loading buffer containing 2-mercaptoethanol, the samples were run on a 12% sodium dodecyl sulfate-polyacrylamide gel electrophoresis (SDS-PAGE) for 2 h at 100 V. Proteins were then added to polyvinylidene fluoride (PVDF) membranes following electrophoresis. A Tris-buffered saline (TBS-T) solution containing 5% (w/v) non-fat milk and 0.05% Tween-20 was used for blocking for an hour. Incubation with primary antibodies (1:1000) for rabbit anti-HO-1(Abcam, UK), anti-IL-6 (Abcam, UK), rabbit anti anus kinase 2 (Jak2) (# 3230S, Cell Signaling Technology, Danvers, MA, USA), rabbit anti-pY1007/1008 Jak2 (# 3776S, Cell Signaling Technology, Danvers, MA, USA), rabbit anti- signal transducer and activator of transcription 3 (STAT3) (# 12640, Cell Signaling Technology, Danvers, MA, USA), rabbit anti-pY705 STAT3 (# 9145S, Cell Signaling Technology, Danvers, MA, USA) and β-actin overnight at 4°C was done. In the blocking solution, secondary antibodies of goat anti-rabbit polyclonal immunoglobulin coupled with horseradish peroxidase were added at a dilution of 1:5000. Using chemiluminescence kits and a luminescent image analyzer (LAS-4100, Fujifilm Co., Japan), bands were visualized. After being normalized to β-actin, protein bands from various groups were assessed as fold changes in comparison to the control group using Image J software.
Real-time reverse-transcription polymerase chain reaction of bax and Bcl2 gene expression
In liver tissue, the apoptotic Bax and anti-apoptotic Bcl2 genes were relatively quantified using the RT-PCR method. Following the manufacturer’s recommendations, total RNA was isolated from the homogenized hepatic samples using the Ribozol RNA extraction reagent (Amresco, Solon, USA). Using a RevertAidTM First Strand cDNA Synthesis kit, cDNAs were created (Fermentas, Life Sciences). 2 μg of total RNA was reverse transcribed into cDNA using M-MuLV reverse transcriptase and an RNase inhibitor. In the Real-Time PCR Detection System, RT-PCR was carried out with 5 ng of cDNA per reaction using 25 μL of SYBR Green QPCR Mix (Solis BioDyne) containing 20 μM of specific primers. The SYBR green results were evaluated using GAPDH (glyceraldehyde-3-phosphate dehydrogenase) as a reference gene for relative quantification. The primer sets that were utilized were:
Bax forward, 5′-GGAGACACCTGAGCTGACCT-3′, and reverse, 5′-CTCAGCCCATCTTCTTCCAG-3. 22
Bcl2 forward, 5′-TATATGGCCCCAGC ATGCGA-3′, and reverse, 5′-GGGCAGGTTTGTCG ACCTCA-3. 23
GAPDH forward primers are as follows: 5′ GTCGGTGTGAACGGATTTG3′ and reverse 5′ CTTGCCGTGGGTAGAGTCAT3′. 24
The formula 2 (−ΔΔCt) was used to determine the relative expression level of each gene. 25 They were scaled in relation to the control samples, which had a value of 1. The outcomes of each experimental sample were thus represented graphically as relative expressions in comparison to the control.
Histological examination
The scoring system of histological parameters.

Immunohistochemical examination
Immunohistochemical study of phosphorylated STAT3 (pS 727)
The standard approach for immunostaining was used (avidin-biotin-peroxidase). For immunostaining with polyclonal rabbit (p-STAT3) antibody, paraffin blocks were sliced into 4 μm thick slices and placed on positively charged glass slides. Deparaffinized liver tissue sections were slowly rehydrated before adding 3% H2O2 for 30 min to suppress endogenous peroxidase activity. The slides were boiled in a 10 mL citrate buffer solution (pH 6.0) for 10–20 min before chilling at room temperature for 20 min for antigen retrieval. The slices were treated in a humified chamber overnight at 4°C with the primary antibody rabbit polyclonal (Thermo fisher cat no. 44–384G) diluted at 1:20. The biotinylated secondary antibody was added for 10 min after being washed with phosphate buffer solution (PBS). The slides were first incubated with streptavidin peroxidase complex for 5 min before being incubated with 3,3-diaminobenzidine tetrahydrochloride (DAB) for 3 min. All of these reagents are part of the Horseradish Peroxidase Labeled Streptavidin-Biotin 2 System, which is a universal labeled streptavidin-biotin 2 system (code no. K0673, DakoCytomation, Glostrup, Denmark).
Mayer’s hematoxylin was used to counterstain all of the slides for 1 min before washing them with water. Then, dehydration was performed with increasing concentrations of ethyl alcohol, followed by clearing, mounting, and lastly applying coverslips. Negative controls were carried out by staining the sections in the same way but they were treated with PBS after each run instead of the primary antibody. A brown nuclear response was seen in p-STAT3 immunopositive cells.
Measuring area fraction of p-STAT3 immune-positivity
The area fraction of p-STAT3 immune positivity was measured using Image J software (an open-source Java image processing application). The area fraction was calculated in a standard measurement frame per 5 random fields in each group using a light microscope with a magnification of ×400. Examination was done on regions containing positive immunostained tissues. 27
Measuring of the mean number of p-STAT3 immunopositive cells
Measuring the mean number of p-STAT3 immunopositive cells was calculated in a standard measurement frame per 5 random fields in each group using a light microscope with a magnification of ×400. 28 The percentage of the p-STAT3 positive cells represented the estimated fraction of the nuclear positive cells for the total liver cells and was scored as (Score 0, no positive cells; Score 1, positive cells ≤25%; Score 2, positive cells 26–50%; Score 3, positive cells 51–75%; and Score 4, positive cells ≥76%). 29
Statistical analysis
The current experiment’s data are expressed as means ± S.E.M. p < .05 was used to determine whether differences were significant. GraphPad Prism (GraphPad Software, San Diego, Calif., USA) was used to analyze the data, which included a one-way ANOVA test and Tukey’s test. The normal distribution of sample data was confirmed by the Kolmogorov-Smirnov normality test.
Results
Effect of hemin on body weight in APAP-induced hepatotoxicity
Effect of hemin on body weight in APAP-induced hepatotoxicity in rat offspring.

Data were displayed as the mean ± S.E.M (n = 8 rats). p < .05 was set for significance. asignificant difference compared to the control, bsignificant difference compared to the hemin group, csignificant difference compared to the APAP group.
Effect of hemin on the liver enzymes in APAP-induced hepatotoxicity
Effect of hemin on liver enzymes in APAP-induced hepatotoxicity in rat offspring.
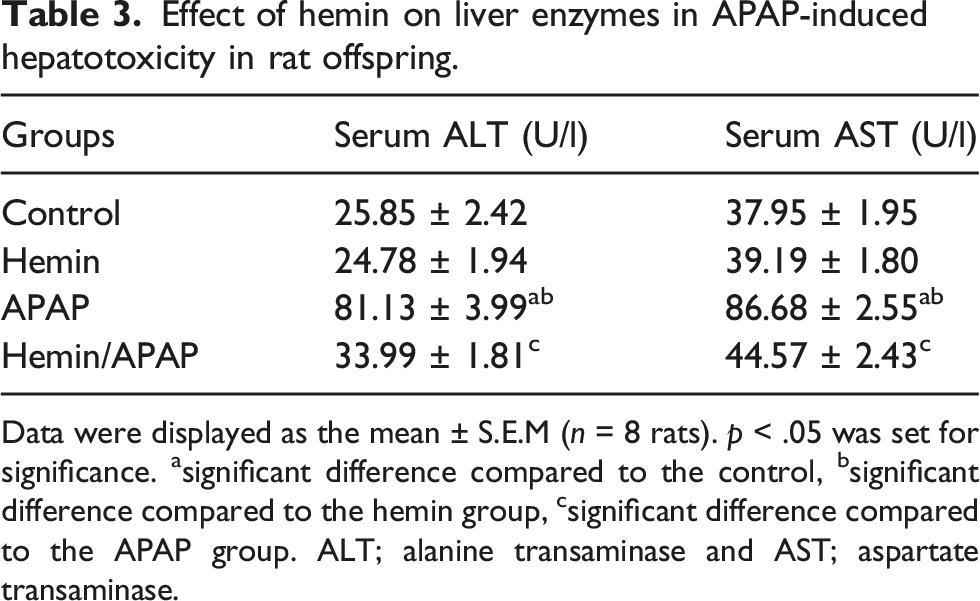
Data were displayed as the mean ± S.E.M (n = 8 rats). p < .05 was set for significance. asignificant difference compared to the control, bsignificant difference compared to the hemin group, csignificant difference compared to the APAP group. ALT; alanine transaminase and AST; aspartate transaminase.
Effect of hemin on the oxidative stress indicators in APAP-related hepatotoxicity
Effect of hemin on oxidative stress parameters in APAP-induced hepatotoxicity in rat offspring.

Data were displayed as the mean ± S.E.M (n = 8 rats). p < .05 was set for significance. asignificant difference compared to the control, bsignificant difference compared to the hemin group, csignificant difference compared to the APAP group. GSH; reduced glutathione, MDA; malondialdehyde, TAC; total antioxidant capacity and NOx; total nitrites.
Effect of hemin on HO-1, inflammatory, and apoptotic parameters
TNF-α, caspase-3, IL-1β, IL-6, p-Jak and p-STAT3 levels were significantly higher in the APAP group than in the control group. On the other hand, a significant decrease in HO-1 level occurred in the APAP group when compared to the control. Furthermore, when compared to the APAP group, the Hemin/APAP group showed a significant decrease in NF-α, caspase-3, IL-1β, IL-6, p-Jak, p-STAT3, and IL-6 levels with a significant increase in HO-1 levels (Figures 1–3). Effect of hemin on hepatic TNF-α (a), caspase-3 (b), and IL-1β (c) in APAP-induced hepatotoxicity in rat offspring. Data were displayed as the mean ± S.E.M (n = 8 rats). p < .05 was set for significance. asignificant difference compared to the control, bsignificant difference compared to the hemin group, csignificant difference compared to the APAP group. TNF-α; Tumor necrosis factor-α.; IL-1β: interleukin-1β. Effect of hemin on hepatic expression of HO-1 and IL-6 in APAP-induced hepatotoxicity in rat offspring. Data were displayed as the mean ± S.E.M (n = 8 rats). p < .05 was set for significance. asignificant difference compared to the control, bsignificant difference compared to the hemin group, csignificant difference compared to the APAP group. HO-1; Hemeoxygenase, IL-6; Interleukin 6. Effect of hemin on hepatic expression of p-Jak2 (a) and p-STAT3 (b) in APAP-induced hepatotoxicity in rat offspring. Data were displayed as the mean ± S.E.M (n = 8 rats). p < .05 was set for significance. asignificant difference compared to the control, bsignificant difference compared to the hemin group, csignificant difference compared to the APAP group. Jak2: Janus kinase 2; STAT3: signal transducer and activator of transcription 3.


Bax/Bcl2 mRNA expression ratio in liver tissue
Figure 4 showed a significant increase in the Bax/Bcl2 ratio of the APAP group relative to the control and hemin groups. However, the ratio was significantly suppressed in the hemin/APAP group relative to the APAP group. Effect of hemin on mRNA expression of Bax (a), Bcl2 (b) and Bax/Bcl2 ratio (c) in APAP-induced hepatotoxicity in rat offspring. Data were displayed as the mean ± S.E.M (n = 8 rats). p < .05 was set for significance. asignificant difference compared to the control, bsignificant difference compared to the hemin group, csignificant difference compared to the APAP group.
Histological results
Figure 5 showed cross-sections of H&E stained liver tissue from the APAP group, which demonstrated indications of liver toxicity in the form of lobular architecture disruption, inflammatory cell infiltration around the central vein, vascular congestion, and dilatation. Hepatocytes that had degenerated had vacuolated cytoplasm and shrunken, strongly pigmented nuclei. Between degraded hepatocytes, there was an apparent infiltration of inflammatory cells. In comparison to the APAP group, rat offspring of hemin/APAP showed marked regression in the previously reported histological findings. Effect of hemin on the histopathological picture of the liver in APAP-induced hepatotoxicity in rat offspring. Representative photomicrographs of neonatal rat liver tissue showing: (a, b) The control and hemin groups with normal histological architecture, plates of polygonal hepatocytes, and an acidophilic granular cytoplasm and rounded vesicular nuclei (arrows). The hepatocytes were radiating from the central veins (CV) and separated by blood sinusoids (S) lined by endothelium with flat nuclei and von Kupffer cells inside (thick arrow). Notice the binucleated hepatocytes (circle). (c) The APAP group with the loss of histological architecture of liver tissue and degenerated hepatocytes (vacuolated cytoplasm and small eccentric deeply stained nuclei (arrows)). Notice the interstitial inflammatory cell infiltrations (stars), congested central veins (CV), and blood sinusoids (s). (d) The hemin/APAP group with restored histological architecture of the hepatic tissue and mild dilatation of the central veins and blood sinusoids (s). Most hepatocytes were presented with an apparent normal appearance (arrows), but a few cells show vacuolated cytoplasm (circles). Notice the mild inflammatory cell infiltrations (red arrows). (H&E ×400). Data were displayed as the mean ± S.E.M (n = 8 rats). p < 0.05 was set for significance. asignificant difference compared to the control, bsignificant difference compared to the hemin group, csignificant difference compared to the APAP group.
Immunohistochemical staining of P-STAT 3 antibodies in liver tissue
Figure 6 showed p-STAT3 immunostaining cross-sections of the liver tissue. The mean area fraction of the p-STAT3 antibody of the APAP group showed a significant increase relative to the control, hemin, and hemin/APAP groups. The mean area fraction of the p-STAT3 antibody of the hemin/APAP group showed a significant decrease relative to the APAP group. In comparison to the APAP group, rat offspring of the hemin/APAP displayed a significant decrease in the STAT3 scoring. Effect of hemin on the immunoexpression of hepatic p-STAT in APAP-induced hepatotoxicity in rat offspring. Photomicrographs of the neonatal rat liver tissue showing: (a and b) The control and hemin groups with negative nuclear p-STAT3 immune-reactivity of the hepatocytes (black arrows). (c) The APAP group with positive nuclear reaction (black arrows) of most of hepatocytes. (d) The hemin/APAP group with negative nuclear reaction (black arrows) of numerous hepatocytes. Notice the positive nuclear expression (red arrow) of a few hepatocytes (p-STAT 3 antibody ×400). Data were displayed as the mean ± S.E.M (n = 8 rats). p < .05 was set for significance. asignificant difference compared to the control, bsignificant difference compared to the hemin group, csignificant difference compared to the APAP group.
Discussion
In humans, an overdose of APAP is known to produce serious hepatotoxicity and possibly liver failure. APAP produces centrilobular hepatic damage, which leads to abrupt liver dysfunction, despite its safety at therapeutic levels. The primary participant in APAP-induced acute toxicity is NAPQI, a reactive toxic metabolite of APAP generated by cytochrome P-450. It was reported that GSH detoxifies NAPQI by conjugating it; however, when NAPQI generation exceeds the capacity of GSH detoxification, an induction of cellular lipoprotein oxidation occurs. This is an autocatalytic response that occurs as a result of cell death. NO is a key mediator of APAP-induced hepatotoxicity, which is characterized by the presence of nitrated tyrosine residues in necrotic cells. Nitrotyrosination is also mediated by the production of peroxynitrite from the fast interaction of superoxide anion and NO.30,31
GSH, which is reduced in APAP-caused hepatotoxicity, is required for peroxynitrite detoxification. This results in an exacerbation of peroxynitrite’s harmful effect. Furthermore, APAP-induced oxidative stress increases inflammation and apoptosis, aggravating the existing liver damage. After hepatic cell injury, cytoplasmic liver enzymes such as AST and ALT are released into the bloodstream.32,33
The hazardous dose of APAP caused severe liver damage 24 h following dosing, as seen by significantly raised levels of hepato-specific blood markers, AST and ALT, in keeping with prior research. In APAP hepatotoxicity, lipid peroxidation induced by reactive oxygen species overproduction 34 was demonstrated by an increase in hepatic MDA, a decrease in GSH, as well as an increase in nitric oxide levels. In the same sense, APAP promoted inflammation and apoptosis in the current study, as demonstrated by the increases in IL-1β, TNF-α, caspase-3, and Bax/Bcl2. The histological results of diffuse liver damage revealed that APAP caused hepatotoxicity.
Hemin is well-known as an HO-1 activator. Under a variety of acute and chronic inflammatory situations, HO-1, the rate-limiting enzyme in heme catabolism, exerts significant anti-inflammatory and cytoprotective effects.35,36 Pretreatment with hemin reduced ROS level and hence oxidative injury, inflammation, and apoptosis in the current study, as evidenced by reduced levels of MDA, NOx, TNF-α, and caspase-3, as well as increased levels of GSH and TAC. The anti-oxidant, anti-inflammatory, and anti-apoptotic roles of hemin were reported in previous studies.37–39 Notably, there was a marked improvement in the liver dysfunction as reflected in the reduction of the markers of liver injury, ALT and AST.
One of the major players in liver damage is IL-6, a 184-amino-acid four-helical cytokine synthesized by fibroblasts, monocytes, macrophages, T cells, and endothelial cells. It is induced under circumstances such as oxidative stress, increased TNF-α, and IL-1β levels. Upon the attachment of IL-6 to its receptor on the target cells, it activates the tyrosine kinase Jak pathway, which phosphorylates a key tyrosine residue (Tyr705) that in turn activates a number of intracellular signaling pathways, including STAT3.40,41
One of the key nodes in the course of drug-induced hepatotoxicity and liver disease is inflammation. In the case of APAP, its metabolite promotes inflammatory cell infiltration and the release of proinflammatory cytokines that cause a detrimental effect on the liver. Running in the same stream, ROS and cell debris are important triggers of inflammatory mediators that participate in drug-induced hepatotoxicity. 42
It has now been established that some IL-6 effects are reliant on HO-1 activity as HO-1 has a central mechanistic action in the regulation of the complex antioxidant system and is a key node in multiple signaling pathways, including IL-6/Jak/STAT3. 43 Furthermore, the up-regulation of HO-1 decreases IL-6 secretion and vice versa. 44 In the current study, the HO-1/IL-6/Jak/STAT3 axis was suggested to have a critical action in the protective effect of hemin, as hemin-induced HO-1 negatively affected the IL-6 secretion that subsequently inhibited the Jak/STAT3 pathway. The inhibition of Jak/STAT3 signaling resulted in the amelioration of oxidative stress, inflammation, and apoptosis, accounting for tissue damage.
The current suggestion is supported by previous researchers who have found that the stimulation of IL-6 expression leads to an increase in STAT3, which is essential in the liver injury induced by APAP. Also, the generated inflammatory response plays a key role in APAP-induced hepatotoxicity and the related apoptosis.45–47 Induced expression of STAT3 target gene Socs3 in T cells has been shown to worsen the APAP-induced hepatotoxicity, which is in the same line as the current proposal.48,49 APAP elevated the expressions of IL-6 and STAT3 in the present research, but these increases were mitigated in the Hemin/APAP group. Also, in the HO-1-deficient animals, IL-6 was elevated in the injured critical organs such as the heart and lungs, and this was accompanied by the elevation of its downstream signaling product, pSTAT3, causing inflammation, oxidative stress, and apoptosis. This supports the idea that IL-6/Jak/pSTAT3 overexpression is linked to organ dysfunction.50,51
Conclusion
Hemin could be considered as a hepatoprotective against APAP-caused acute liver toxicity in rat offspring. The hepatoprotective effect might be partly mediated through the HO-1/IL-6/Jak/STAT3 axis, which creates anti-oxidant, anti-inflammatory, and anti-apoptotic actions.
Footnotes
Author contributions
RR, WA, and NW conceptualization performed the experiments, wrote and revised the manuscript. MB conducted experiments. AA performed and wrote histopathological and immunohistochemical examination. MF performed and wrote Western blot measurements. MA edited and revised the manuscript. All the authors read, revised and approved the manuscript.
Declaration of conflicting interests
The author(s) declared no potential conflicts of interest with respect to the research, authorship, and/or publication of this article.
Funding
The author(s) received no financial support for the research, authorship, and/or publication of this article.