
Abstract
Objective
For more than 150 years, dental amalgam fillings (50% metallic mercury (Hg0) by weight) have been used in American dentistry. The US Food and Drug Administration (FDA) acknowledged that amalgams release Hg vapor that may be harmful to certain patients. This study examined the impact of Hg vapor exposure from amalgams in American adults.
Methods
Amalgam-Hg vapor exposure among 158,274,824 weighted-adult Americans was examined in the 2015–2018 National Health and Nutrition Examination Survey (NHANES). Beta (β)-coefficients were calculated for the correlation between the number of amalgam surfaces and daily micrograms (μg) of urinary Hg and daily μg of Hg vapor exposure from amalgams per kilogram (Kg) bodyweight.
Results
About 91 million (57.8%) adults had ≥1 amalgam surface and about 67 million (42.2%) had no amalgams. A β-coefficient = 0.041 significantly correlated the number of amalgam surfaces to daily amounts of urinary Hg. Differences were observed for gender and racial groups. Daily Hg vapor doses from amalgams were in excess of the most restrictive California’s Environmental Protection Agency (EPA) safety limit for about 86 million (54.3%) adults and in excess of the least restrictive US EPA safety limit among about 16 million (10.4%) adults. The mean allowable number of amalgam surfaces ranged from 1.28 for adult females under the California’s EPA safety limit to 16.23 for adult males under the US EPA safety limit.
Conclusion
Given that American adults are receiving significant, ongoing exposure to Hg vapor from amalgams, careful evaluation of the need to reduce use of amalgams should be considered.
Introduction
A filling is a type of restorative dental procedure to fix a tooth damaged by decay. A filling may cover one or more than one surface of the tooth (each tooth has up to five surfaces). American dentists have utilized dental amalgam fillings for over 150 years, but their use has been marred by ongoing controversy. 1 Amalgams are composed of a mixture of metals. They contain about 50% metallic mercury (Hg0) by weight. Other metals such as silver, tin, copper, indium, palladium, and zinc are present at lower concentrations. 2
The US Food and Drug Administration (FDA) recently acknowledged several important facts regarding amalgams: (1) they release Hg in the form of Hg vapor; (2) they release amounts of Hg vapor dependent on the number of existing fillings; and (3) they release Hg vapors that may be harmful to certain patients. 3
As a result of the US FDA’s current statements on amalgams, it is now an important aspect of public health policy to determine the impact of Hg vapor exposure from amalgams on American adults. Previous studies revealed that urinary Hg concentrations are an effective means to examine exposure to Hg vapor from amalgams. 4 These studies revealed that urinary Hg concentrations were consistently, significantly higher among persons with amalgams as compared to those persons without amalgams. It was shown that increasing numbers of amalgams significantly correlated with increasing urinary Hg concentrations. 4 Finally, toxicological calculations to quantify a person’s total daily Hg vapor exposure from amalgams using urinary Hg concentrations and the number of amalgam surfaces were presented. 4
The purpose of the present study was to utilize the aforementioned techniques to analyze newly available data from the National Health and Nutrition Examination Survey (NHANES). The aims of the present study were to assess the impact of amalgams among American adults as follows: (1) quantify daily Hg vapor exposure; (2) determine how demographic covariates such as gender, age, race, country of birth, and socioeconomic status impact Hg vapor exposure; (3) determine how many adults are receiving daily Hg vapor doses in excess of various governmental safety limits; (4) determine how demographic covariates such as gender, age, race, country of birth, and socioeconomic status impact the number of adults receiving Hg vapor doses in excess of various governmental Hg vapor safety limits; and (5) determine the mean number of amalgam surfaces permissible for the average adult to stay within the various governmental Hg vapor safety limits.
Materials and methods
The Statistical Analysis System (SAS) system for Windows, Version 9.4 (Cary, NC, USA) was used to examine NHANES data. This study integrated the 2015–2016 and 2017-2018 NHANES data from demographic survey questions, oral health examinations, clinical measurements, and lab test results. The 2015-2016 NHANES data collection methods were approved by the National Center for Health Statistics (NCHS) Research Ethics Review Board (ERB) (Protocol#2011-17). The 2017-2018 NHANES data collection methods were approved by the NCHS ERB (Protocol#2011-17 and Protocol#2018-01). Each study subject provided informed consent to participate in the NHANES program. The health information collected in the NHANES program is kept in strictest confidence, and is only used for stated purposes.
5
Figure 1 presents a schematic flowchart of the data examined in the present study. A flowchart of the persons examined in the national health and nutrition examination survey.
Study participants
An overall adult population of 158,274,824 weighted-persons from 21 to 66 years-old with non-missing values for specific demographic survey questions, oral health examinations, urinary Hg amounts, measured bodyweight, and measured urine flow rates were examined. The number of weighted-persons was derived by applying the full sample 2-year mobile examination weight variable (WTMEC2YR) to each person examined in this study. The WTMEC2YR variable was created by the NHANES program. The WTMEC2YR is a measure of the number of persons in the general population that a sampled individual represents and is needed to obtain unbiased estimates of population parameters when sample participants are chosen with unequal probabilities. Since, the NHANES data examined were collected from two separate samples (2015–2016 and 2017–2018), the WTMEC2YR value for each person was divided by 2, to provide an accurate overall weighted-person value for each person examined in this study. The demographic variables for the population were identified from the NHANES demographic dataset. The variables examined were as follows: gender (male or female), age in years at examination, race (non-Hispanic White, non-Hispanic Black, non-Hispanic Asian, Hispanic, or other – including multi-racial), country of birth, and socioeconomic status (poverty income ratio (PIR) – a ratio of family income to poverty threshold). The PIR variable was created by the NHANES program.
Amalgam surfaces
The amalgam surface exposure variable was determined by examining the NHANES oral health – dentition dataset. For each person, an oral health examination was conducted by dental examiners, who were dentists licensed in at least one US state. A health technician assisted in entering all examiner observations directly into a computerized data collection system. All oral health assessments took place in a designated room at the mobile examination center (MEC) that included a portable dental chair, light, and compressed air.
For all survey participants one year-old and older, the oral health examination began with a tooth count assessment. Next, their teeth were assessed for coronal caries, including untreated dental decay, and teeth treated or extracted due to caries. The 2015–2016 and 2017–2018 coronal caries assessment was similar to the NHANES protocols used in 1999–2004 and 2011–2014, with the following exception: filled surfaces were assessed by restoration type (amalgam or other). The total number of dental amalgam filling surfaces or other dental filling surfaces was computed for each person examined in this study.
Daily Hg vapor exposure from amalgams
Urinary Hg measurements were made directly on random spot urine specimens using mass spectrometry after a simple dilution sample preparation step. Liquid samples were introduced into the mass spectrometer through the inductively coupled plasma (ICP) ionization source, reduced to small droplets in argon aerosol via a nebulized, and then the droplets were entered into the ICP. The ions first passed through a focusing region, followed by the dynamic reaction cell (DRC), the quadrupole mass filter, and finally were selectively counted in a rapid sequence at the detector, allowing individual isotopes of Hg to be determined. Urinary Hg amounts were determined as micrograms (μg) of Hg/liter (L) of urine. The detection limit was constant for Hg in the dataset and the derived lower limit of detection for urinary Hg amounts was 0.13 μg of Hg/L. There were no changes to the lab method, lab equipment, or lab site for urinary Hg measurements during 2015–2018 NHANES data collection.
Since, urine analyte concentrations from random urines can vary depending on level of hydration, urine flow rates were evaluated for each person examined. The urine flow rate was determined as the number of milliliters (mL) of urine produced per minute (min) of time. There were no changes to urine flow rate measurements during 2015–2018 NHANES data collection. The urine flow rate for each person was then multiplied by 60 (to convert min to hours) then by 24 (to convert hours to 1 day) and finally by 0.001 (to convert mL to L), to yield the total number of L of urine per 24 h (or per day).
The total daily urinary flow rate for each person (L of urine per day) was then multiplied by their urinary μg of Hg/L to determine daily urinary μg of Hg. Once determined, the data were analyzed for all persons and stratified by race and gender status to calculate beta (β)-coefficients between the number of amalgam surfaces and urinary μg of Hg per day using survey regression modeling in SAS. The greater the β-coefficient, the greater the contribution of amalgam surfaces to amounts of urinary Hg, whereas the lower the β-coefficient, the less the contribution of amalgam surfaces to amounts of urinary Hg.
In order to estimate the daily total μg of Hg vapor per kilogram (Kg) each person was exposed to from their amalgam surfaces the β-coefficients derived above were first applied to each person (regardless of gender or race), and then, second considering their gender and race. The appropriate β-coefficient for each person was multiplied by their total number of amalgam surfaces. The result for each person was their total urinary μg of Hg from their amalgam surfaces. Since, this value is a reflection of urinary Hg only, it is necessary to determine the urinary fraction of the total Hg vapor dose received from amalgam surfaces. Urinary Hg excretion from amalgams ranges from 0.10 for one amalgam surface to 0.40 for 128 amalgam surfaces and can be calculated for an individual using the following equation: 0.1 + [(number of amalgam surfaces – 1) × 0.00236]. 6 This equation was applied to each person examined in this study utilizing their number of amalgam surfaces, so as to determine their proportion of urine total Hg excretion from amalgam surfaces. The inverse of the proportion of total urinary Hg excretion from amalgam surfaces was multiplied by the calculated urinary μg of Hg from amalgam surfaces. This final value was divided by each person’s weight in Kg to determine the μg of Hg vapor exposure from amalgam surfaces/Kg bodyweight/day. It should be noted that those with no amalgams would have 0 μg of Hg vapor exposure from their amalgam surfaces/Kg bodyweight/day.
Daily Hg vapor exposure from amalgams versus Hg vapor safety limits
Governmental health agencies and researchers have established daily Hg vapor exposure safety limits. The various Hg vapor safety limits are as follows: the US Environmental Protection Agency (EPA) at 0.048 μg of Hg/Kg bodyweight/day, the US Agency for Toxic Substances and Disease Registry (ATSDR) at 0.032 μg of Hg/Kg bodyweight/day, Health Canada at 0.011 μg of Hg/Kg bodyweight/day, Richardson et al. 4 at 0.010 μg of Hg/Kg bodyweight/day, and California’s Environmental Protection Agency (EPA) at 0.005 μg of Hg/Kg bodyweight/day. 4 Each person’s exposure to μg of Hg from amalgam surfaces/Kg bodyweight/day was divided by each Hg vapor safety limit (expressed as μg of Hg/Kg bodyweight/day). Those persons with computed values >1 were in excess of the safety limit, whereas all others were not. Survey logistic regression was employed to determine, which, if any of the demographic variables examined in this study were associated with an individual’s risk of being in excess of the various safety limits.
Further analyses, were undertaken to determine the mean number of amalgam surfaces allowable for males and females under the daily Hg vapor exposure safety limits. For each person with one or amalgam surfaces, their gender and race appropriate β-coefficient between the number of amalgam surfaces and the μg of Hg per day for each person in their urine was divided by 0.15 (this value is the estimated percentage of the total daily Hg dose present in a 24 h urine sample). The resultant value was divided by each person’s bodyweight in Kg. These individual values were analyzed separately among males and females to determine their respective gender specific mean μg of Hg from amalgam surfaces/Kg bodyweight/day. Each Hg vapor safety limit was divided by gender specific mean μg of Hg from dental amalgam filling surfaces/Kg bodyweight/day to determine the mean number of amalgam surfaces that would not exceed the Hg vapor safety limits.
Statistical analyses
In all statistical analyses, the statistical package in SAS was utilized, and a two-sided p-value < 0.05 was considered statistically significant. The number of persons examined in this study was sufficient to allow for adequate statistical power for the analyses undertaken. The null hypothesis was that there would be no correlation between amounts of urinary Hg and amalgam surfaces.
In the statistical models constructed, the categorical variables of gender, race, and country of birth were converted to continuous variables as follows: gender (male = 1, female = 2), race (Hispanic = 1, non-Hispanic white = 2, black = 3, Asian = 4, and other – including multi- racial = 5), and country of birth (born in the 50 United States or Washington, District of Columbia = 1 and others = 2). The variables of total amalgam surfaces, age in years, and socioeconomic status were examined as continuous variables. In addition, when using survey statistical modeling in SAS to analyze the NHANES data, variables for stratum (NHANES variable: sdmvstra), cluster (NHANES variable: sdmvpsu), and weight (NHANES variable: WTMEC2YR/2) were employed.
Results
Demographic characteristics of the adults examined in the national health and nutrition examination survey.

PIR = poverty income ratio, std = standard deviation of the mean.
A summary of the correlation between daily urinary mercury amounts (μg of mercury/day) and the number of amalgam surfaces.

β-coefficients (μg of mercury/amalgam surface/day), standardized estimates, and p-values were determined from survey regression modeling.
A summary of the correlation between daily urinary mercury amounts (μg of mercury/day) and the number of amalgam surfaces.

β-coefficients (μg of mercury/amalgam surface/day), standardized estimates, and p-values were determined from survey regression modeling.

Kg = kilogram, μg = microgram.
aThe total mercury dose each person received from amalgam surfaces was determined by multiplying the gender and race appropriate β-coefficient (as determined in Table 3) by the number of amalgam surfaces. Then, the resulting value was multiplied by the inverse of the portion of mercury excretion via urine based upon the number of amalgam surfaces (ranging from 0.10 for 1 amalgam surface to 0.40 for 128 amalgam surfaces). The computed value was then divided by the person’s weight in Kg. The resulting value was each person’s exposure to μg of mercury from amalgam surfaces/Kg bodyweight/day.
bThe value for each person’s exposure to μg of mercury from amalgam surfaces/Kg bodyweight/day was divided by each mercury vapor safety limit (expressed as μg of mercury/Kg bodyweight/day). Those persons with computed values >1 were in excess of the safety limit, whereas all others were not.

Kg = kilogram, μg = microgram.
aThe total mercury dose each person received from amalgams was determined by multiplying the gender and race appropriate β-coefficient (as determined in Table 3) by the number of amalgam surfaces. Then, the resulting value was multiplied by the inverse of the portion of mercury excretion via urine based upon the number of amalgam surfaces (ranging from 0.10 for 1 amalgam surface to 0.40 for 128 amalgam surfaces). The computed value was then divided by the person’s weight in Kg. The resulting value was each person’s exposure to μg of mercury from amalgams/Kg bodyweight/day.
bThe value for each person’s exposure to μg of mercury from amalgams/Kg bodyweight/day was divided by each mercury vapor safety limit (expressed as μg of mercury/Kg bodyweight/day). Those persons with computed values >1 were in excess of the safety limit, whereas all others were not.

Kg = kilogram, μg = microgram.
aThe total mercury dose each person received from amalgam surfaces was determined by multiplying the gender and race appropriate β-coefficient (as determined in Table 3) by the number of amalgam surfaces. Then, the resulting value was multiplied by the inverse of the portion of mercury excretion via urine based upon the number of amalgam surfaces (ranging from 0.10 for 1 amalgam surface to 0.40 for 128 amalgam surfaces). The computed value was then divided by the person’s weight in Kg. The resulting value was each person’s exposure to µg of mercury from amalgam surfaces / Kg bodyweight / day.
bThe value for each person’s exposure to μg of mercury from amalgams/Kg bodyweight/day was divided by each mercury vapor safety limit (expressed as μg of mercury/Kg bodyweight/day). Those persons with computed values >1 were in excess of the safety limit, whereas all others were not.

Kg = kilogram, μg = microgram.
aThe total mercury dose each person received from amalgams was determined by multiplying the gender and race appropriate β-coefficient (as determined in Table 3) by the number of amalgam surfaces. Then, the resulting value was multiplied by the inverse of the portion of mercury excretion via urine based upon the number of amalgam surfaces (ranging from 0.10 for 1 amalgam surface to 0.40 for 128 amalgam surfaces). The computed value was then divided by the person’s weight in Kg. The resulting value was each person’s exposure to μg mercury from amalgams/Kg bodyweight/day.
bThe value for each person’s exposure to μg of mercury from amalgams/Kg bodyweight/day was divided by each mercury vapor safety limit (expressed as μg of mercury/Kg bodyweight/day). Those persons with computed values >1 were in excess of the safety limit, whereas all others were not.
cp < 0.01.
dp < 0.05.
A summary of the mean number amalgam surfaces among adult males allowable under the various mercury vapor safety limits. a
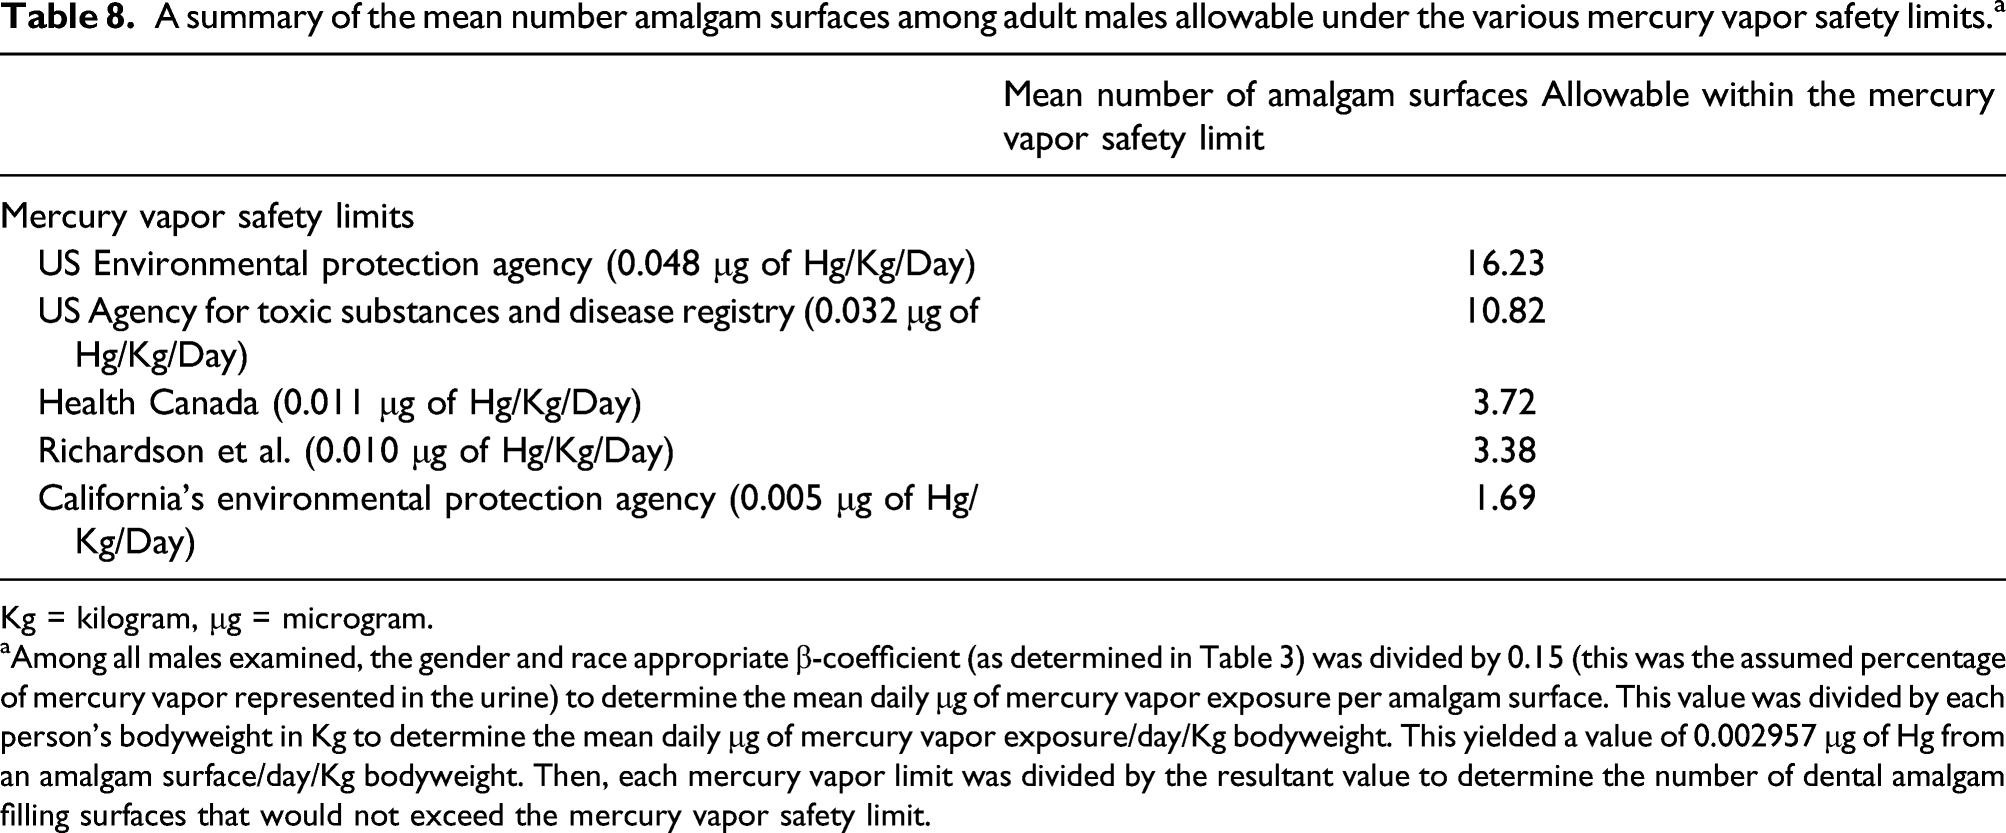
Kg = kilogram, μg = microgram.
aAmong all males examined, the gender and race appropriate β-coefficient (as determined in Table 3) was divided by 0.15 (this was the assumed percentage of mercury vapor represented in the urine) to determine the mean daily μg of mercury vapor exposure per amalgam surface. This value was divided by each person’s bodyweight in Kg to determine the mean daily μg of mercury vapor exposure/day/Kg bodyweight. This yielded a value of 0.002957 μg of Hg from an amalgam surface/day/Kg bodyweight. Then, each mercury vapor limit was divided by the resultant value to determine the number of dental amalgam filling surfaces that would not exceed the mercury vapor safety limit.
A summary of the mean number amalgam surfaces that will result in mercury vapor exposures within the various mercury vapor safety limits among adult females. a

Kg = kilogram, μg = microgram.
aAmong all females examined, the gender and race appropriate β-coefficient (as determined in Table 3) was divided by 0.15 (this was the assumed percentage of mercury vapor represented in the urine) to determine the mean daily μg of mercury vapor exposure per amalgam surface. This value was divided by each person’s bodyweight in Kg to determine the mean daily μg of mercury vapor exposure/day/Kg bodyweight. This yielded a value of 0.003905 μg Hg of from an amalgam surface/day/Kg bodyweight. Then, each mercury vapor limit was divided by the resultant value to determine the number of dental amalgam filling surfaces that would not exceed the mercury vapor safety limit.
Discussion
The present study provides the first nationwide insights into the direct contribution of amalgams on Hg vapor exposure among American adults. The median urinary amount of Hg per day among American adults with amalgams was about 2-fold significantly higher compared to American adults with no amalgams. Further, the daily amount of urinary Hg was significantly correlated with the number of amalgam surfaces. Gender and race were observed to significantly impact the correlation between the daily amount of urinary Hg and the number of amalgam surfaces. Overall, a majority of American adults received sustained Hg vapor exposure from amalgams, with many in excess of various Hg vapor safety limits. Demographic factors such as race, gender, age, and country of origin were important risk factors for being over the various Hg vapor safety limits among those with amalgams.
The results observed in this study regarding ongoing Hg vapor exposure from amalgams are compatible with previous observations. It was previously described that amalgams are the single largest source of continuous Hg exposure for the general population. 4 There are more than 14 previous studies that estimated the Hg vapor dose persons received from amalgams 7 with results comparable to those observed in the present study, but none of these studies were population-based assessments of Hg exposure from amalgams specific to the general US population.
Dye et al. 8 and Richardson et al. 4 examined amounts of urinary Hg and tooth restoration status in NHANES data. Both of these studies were subject to significant limitations as compared to the present study. The most important difference between the previous studies and the present study was that older NHANES data did not provide information regarding the material utilized for dental filling surfaces. As a consequence, both of these studies utilized various means to estimate the composition of the dental filling surfaces examined. By contrast, the present study examined new NHANES data, which specified the composition of the dental filling surfaces for each person examined. Further, both previous studies determined the urinary amount of Hg utilizing data derived from spot urine collections. By contrast, the present study utilized the newly available data regarding urine flow rate to calculate the amount of urinary Hg for each person over a 24 h (daily) period. The new NHANES data examined in the present study is important because, as described by NHANES, determination of urine analyte concentrations from spot urine can vary depending on hydration. As a result of this variation, NHANES describes that urine flow rate, when used in conjunction with analyte concentration measured in a spot urine, can produce a better measure of analyte excretion rate, especially in the context of exposure to environmental chemicals. The Dye et al. 8 study is further differentiated from the present study because the investigators made no calculations regarding daily amounts of Hg vapor exposure from estimated amalgam surfaces. They also did not evaluate Hg vapor exposure from amalgams in comparison to various Hg vapor safety limits.
Richardson 6 previously undertook a study that was similar to the present study. Richardson 6 evaluated Hg vapor exposure from amalgams in the Canadian Health Measures Survey (CHMS) collected from 2007–2009. The data analyzed in CHMS was collected using similar methods to that employed in NHANES. The CHMS examined a population of 5604 persons that was representative of the entire Canadian population. In addition, the 2007-2009 CHMS contained data on the number of tooth surfaces restored with amalgams and measures of urinary Hg content. There are several important demographic differences between the NHANES and CHMS study populations. First, the NHANES data was collected on Americans, whereas the CHMS data was collected on Canadians. Second, the NHANES data was collected from 2015–2018, whereas the CHMS data was collected from 2007–2009. The CHMS data showed about 27% of adult Canadians had no amalgams, whereas the NHANES data identified about 42% of adult Americans had no amalgams. In addition, the mean number of amalgam surfaces among Canadian adults was about 11, whereas the mean number of amalgam surfaces among American adults was about 7.
There are also several methodological differences between the present study and the Richardson study. 6 First, the Richardson study 6 measured amounts of daily urinary Hg by multiplying the amount of urinary Hg per gram creatinine by the estimated grams of creatinine excreted in urine over a 24 h period. Whereas, the present study, used measures of urine flow rate and the amount of urinary Hg to determine the amount of urinary Hg produced over a 24 h period. The present study, as compared to the Richardson study, 6 examined differences in the correlation between Hg vapor exposure and amalgam surfaces by different ethnicities. Another difference between the two studies was that the present study examined the overall adult American population (including, those with amalgams and those without amalgams) to determine the percentages of American adults exposed to doses of Hg vapor in excess of various Hg vapor safety limits, whereas the Richardson study 6 only examined adult Canadians with amalgams to determine the percentages of Canadian adults in excess of the Health Canada Hg vapor safety limit.
Despite the differences between the present study and the Richardson study, 6 a qualitatively similar statistically significant correlation coefficient was observed between daily Hg vapor exposure and amalgams. The correlation coefficient observed in this study was slightly higher than in the Richardson study. 6 The mean daily Hg vapor dose per Kg bodyweight from amalgam surfaces was slightly higher in this study as compared to the Richardson study, even when taking into account that the mean number of amalgam surfaces. The mean daily Hg vapor dose per Kg bodyweight from amalgam surfaces from the Richardson study 6 was 0.021 as compared to the observed value of 0.029 from the present study. As a result of this difference, a slightly lower number of amalgam surfaces were estimated to result in an adult receiving Hg vapor doses in excess of the Health Canada Hg vapor safety limit in the present study (between 3 and 4 amalgam surfaces) versus the Richardson study (between 4 and 7 amalgam surfaces). 6 The Richardson study 6 did acknowledge that their observed correlation between amalgam surfaces and amounts of urinary Hg was somewhat lower than other studies.
Furthermore, NHANES is run by the NCHS of the US Centers for Disease Control and Prevention (CDC). 9 The NHANES program began in 1960. It became a continuous program starting in 1999. Under the current continuous NHANES program, 5000 people in different counties across the US are examined each year. The people examined are representative of the entire population of the US, and it is estimated that each NHANES participant represents about 65,000 Americans. NHANES is unique because it combines interviews and physical examinations. The interview component of NHANES collects detailed demographic, socioeconomic, dietary, and health-related data on each person. The examination component of NHANES is administered by highly trained medical personnel. For each person, detailed medical, dental, physiological measurements, and laboratory tests are collected. The US CDC describes that the NHANES is one of the greatest public health resources to learn about the health and nutritional status of American adults and children. The purpose of the NHANES data is to provide important health statistics to help public health officials, legislators, and physicians use the information to develop good health policies, create health programs and services, and increase knowledge about health concerns for the nation. Therefore, the NHANES data examined was collected with the specific purpose of supporting study aims similar to those of the present study.
Study limitations
A potential limitation of this study was that the NHANES data examined were collected using an observational cross-sectional study design without detailed documentation as to daily behaviors of study subjects. It is known that daily behaviors such as eating or drinking of various foods, tooth brushing, bruxism, etc. may influence the release of Hg vapor from amalgams. 10 It is possible with more detailed accounting of study subject’s daily behaviors over the course of a longer period of time that more precise correlations between Hg vapor exposure and the number of amalgam surfaces could be calculated. Since, it was not possible to address such behaviors in the present study; a potential limitation of the present study is reduced statistical power. Despite this potential limitation, it was observed in all analyses that there were significant correlations between the numbers of amalgam surfaces and amounts of urinary Hg. Further, calculations of exposure to Hg vapor from amalgams in this study were similar to previous studies. It is recommended that future studies further examine the impact of various behaviors over time and their impact on Hg vapor exposure from amalgams.
Another limitation of this study was that other sources of daily Hg exposure were not considered such as Hg exposure from fish consumption, the environment, occupation, or medicines. These many other sources of Hg exposure, while potentially significant, should not have significantly impacted the results observed in the present study. It was assumed that such exposures should occur with equal frequency and amount independent of amalgam status. Further, other types of Hg, such as methyl-Hg, which is found in certain species of fish, should have a limited impact on amounts of urinary Hg because the main excretion pathways for methyl-Hg are the bile and feces. 11 Finally, given the large number of persons examined over a multi-year period in this study, and the relative rarity of occupational or medicinal exposures to Hg, their impact on the overall amounts of urinary Hg observed in this study would be expected to be very small. It is suggested, in future studies that further accounting of Hg exposures from other sources be undertaken to evaluate, what, if any impacts they may have on the correlation between urinary Hg amounts and number of amalgams.
A still further limitation of the present study was that direct measurements of daily Hg exposure were not made, but, instead, were calculated from the amount of Hg present in 24 h urine samples. It is possible there may be physiological factors that influence amounts of urinary Hg independent of the total amount of Hg vapor exposure from amalgams. For example, it was previously shown that Hg excretion and organ distribution was significantly different among several strains of methyl-Hg-treated mice. 12 It was also shown that genetic polymorphisms affect susceptibility to Hg mediated dental amalgam neurotoxicity. 13 It is expected genetic and/or biochemical differences that impact amounts of urinary Hg would minimize the statistical power of the present study to observe a significant correlation between Hg vapor exposure and amalgam surfaces. Despite this potential limitation, significant correlations were observed. It is also expected that genetic and/or biochemical differences, while potentially important in mediating an individual’s urinary Hg excretion, in the context of a large population, like the population sample examined in this study, such phenomena would impact a minority of persons, and, thus, would have a minimal impact on the results. In addition, the present study minimized the impact of other known variations in the amounts of urinary Hg. For example, it is known that a person’s daily urinary volume may impact variations in the amounts of urinary Hg. 14 The present study addressed this phenomenon by utilizing urine flow to calculate 24 h urine production, and then utilizing this calculated number to determine the amount of Hg present in the urine over a 24 h period.
Another limitation of this study was dental amalgam data regarding their exact chemical composition and length of placement in the mouth was not available. This data is important because chemical composition and length of placement in the mouth may significantly impact release of Hg vapor from an amalgam. For example, it is known that the amalgams containing high amounts of copper relative to amalgams containing low amounts of copper release significantly more Hg. 15 As another example, it was shown that the contribution of amalgams to the amount of urinary Hg was related to the time since placement (newer amalgams contributing more to urinary Hg than older amalgams). 16 It is expected that such factors would have increased variability in the correlations observed between amalgam surfaces and urinary Hg, and, thus, reduce statistical significance of the results observed. It is recommended that future studies further explore how dental amalgam chemical composition and length of placement in the mouth may impact Hg exposure from amalgams, so as to generate more precise correlations between amalgam surfaces and amounts of urinary Hg.
A final limitation of this study was the Hg vapor safety limits utilized. The Hg vapor safety limits used in this study were derived by governmental health agencies and researchers to ensure that the allowable amount of Hg vapor would result in no negative health outcomes within the population covered. 17 An important limitation of the Hg vapor safety limits is that the underlying data utilized in establishing the Hg vapor safety limits was primarily collected for adult males receiving occupational exposure to Hg vapor. As a result, each Hg vapor safety limit used in this study employed uncertainty factors to ensure that no negative health outcomes would occur within the population covered by the safety limit. The uncertainty factors employed ranged from 30-fold for Health Canada, the US ATSDR, and US EPA Hg vapor safety limits to 100-fold for Richardson et al. Hg vapor safety limit to 300-fold for the California EPA Hg vapor safety limit. 17 The consequence of the uncertainty factors is that the absolute risk of Hg intoxication for a given person receiving a dose of Hg vapor exposure from amalgams in excess of the safety limits is not known, but there is an increasing cause for concern with increasing amounts of Hg vapor exposure from amalgams in excess of the Hg vapor safety limits.
Conclusion
This study is the first to analyze recently available 2015-2018 NHANES data to assess the impact of Hg vapor exposure from amalgams among American adults. The results of this study provide a new and important public health perspective regarding the urgency of continuous exposure to Hg vapor from amalgams. Overall, continuous Hg vapor exposure from amalgams is widespread; nearly, 60% of American adults have ≥1 amalgam surface. This study also reveals that there is a significant correlation between increasing numbers of amalgam surfaces and increasingly daily amounts of urinary Hg. Further, the relationship between amalgams and daily amounts of urinary Hg is influenced by gender and race. Among all American adults, the number over Hg vapor safety limits from their amalgams ranges from about 10% for the least restrictive US EPA Hg vapor safety limit to about 54% for the most restrictive California’s Hg vapor safety limit. The odds of an American adult being over various Hg vapor safety limits was significantly influenced by gender, race, socioeconomic status, country of birth, and age. It is important for public health policy, based upon the findings in this study, showing so many American adults are receiving Hg vapor doses in excess of safety limits, that careful attention is focused on the need to reduce amalgam use when considering all sources of Hg exposure. This is especially true in light of several recent epidemiological studies of adults linking increasing amalgam exposure with the outcomes of arthritis and asthma (these studies considered various types of confounders).18,19 We recommend that future studies be undertaken to explore the potential adverse clinical outcomes of amalgam-associated Hg vapor in excess of safety limits.
Footnotes
Declaration of conflicting interests
The author(s) declared the following potential conflicts of interest with respect to the research, authorship, and/or publication of this article: Dr Mark Geier and Mr David Geier are directors of the nonprofit Institute of Chronic Illnesses, Inc. Dr Mark Geier and Mr David Geier are shareholders in EmeraMed, Ltd (Dublin, Ireland), a company developing a compound to treat mercury toxicity.
Funding
The author(s) disclosed receipt of the following financial support for the research, authorship, and/or publication of this article: Funding for this work was provided by a grant to the nonprofit Institute of Chronic Illnesses, Inc from the International Academy of Oral Medicine and Toxicology (IAOMT).