
Abstract
Objective
Cytochrome P450 3A5 (CYP3A5) is a highly polymorphic gene and the encoded protein variants differ in catalytic activity, leading to inter-individual variation in metabolic ability. The aim of the current study was to investigate the effects of seven allelic variants on the ability of CYP3A5 to metabolize sorafenib in vitro and further explore the impacts of CYP3A5 polymorphism on the proliferation and apoptosis of hepatocellular carcinoma cell line (HepG2) induced by sorafenib.
Methods
Wild-type and variant CYP3A5 enzymes were expressed in Spodoptera frugiperda insect cells using a baculovirus dual-expression system, and protein expression was checked by western blot. The enzymes were incubated with sorafenib at 37°C for 30 min, and formation of the major metabolite sorafenib N-oxide was assayed using ultra-performance liquid chromatography and tandem mass spectrometry. Intrinsic clearance values (V max /K m ) were calculated for each enzyme. Additionally, recombinant HepG2 cells transfecting with CYP3A5 variants were used to investigate the effects of sorafenib on the proliferation of HepG2 cells.
Results
Intrinsic clearance of the six variants CYP3A5*2, CYP3A5*3A, CYP3A5*3C, CYP3A5*4, CYP3A5*5, and CYP3A5*7 was 26.41–71.04% of the wild-type (CYP3A5*1) value. In contrast, the clearance value of the variant CYP3A5*6 was significantly higher (174.74%). Additionally, the decreased ATP levels and cell viability and the increased cell apoptosis in HepG2 cells transfected with CYP3A5*2, CYP3A5*3A, CYP3A5*3C, CYP3A5*4, CYP3A5*5, and CYP3A5*7 were observed, whereas, the increased ATP levels and cell viability and the reduced cell apoptosis in HepG2 cells transfected with CYP3A5*6 were also investigated when compared to CYP3A5*1.
Conclusion
Our results suggest that CYP3A5 polymorphism influences sorafenib metabolism and pharmacotherapeutic effect in hepatic carcinomas. These data may help explain differential response to drug therapy for hepatocellular carcinoma, and they support the need for individualized treatment.

Introduction
The cytochrome P450 (CYP) family of cytoplasmic proteins is involved in multiple catalytic reactions, including the metabolism of compounds. Several studies have suggested that genetic polymorphisms could lead to individual differences in drug metabolism.1–3 The CYP3A subfamilies of CYP proteins are highly expressed in the human liver and intestine and alter the bioavailability and clearance of metabolites.1–4 Previous studies have indicated that the CYP3A5 enzyme may represent >50% of total CYP3A activity in some individuals and possibly more in those carrying at least one mutation in the CYP3A5 gene.5–7 CYP3A5 polymorphism can alter the pharmacokinetics and pharmacodynamics of some drugs, including anticancer agents and antihypertensive drugs. 8 Previous study has reported that the allelic frequencies of CYP3A5*2 (2480 G>A, 0.2%), CYP3A5*3 (6986 A>G, 86.6%), CYP3A5*6 (3079 C>T, 1.7%), CYP3A5*4 (2109 A>G, 0.0%), CYP3A5*5 (1165 C>T, 0.0%), and CYP3A5*7 (2899C>T, 0.0%) were found in the Jordanian population. 9 Additionally, the frequencies of the defective CYP3A5*3 (91%), CYP3A5*2 (1%), CYP3A5*6 (0.1%), and CYP3A5*4 (0%), *5 (0%), and *7 (0%) alleles were found in the Dutch Caucasian population. 10 For example, it may affect the antihypertensive efficacy of amlodipine in patients with hypertension following renal transplantation.
Sorafenib is a widely used tyrosine kinase inhibitor that undergoes CYP enzyme-mediated biotransformation to yield a metabolite that treats advanced hepatocellular carcinoma. Although sorafenib is generally well tolerated, it can lead to a range of toxicities in certain individuals, such as hypertension, edema, and hand-foot syndrome. 11 Individuals with the CYP3A5*3 allelic variant are less able to metabolize sorafenib into its bioactive form than individuals with the wild-type (CYP3A5*1) allele, leading to more severe hepatic and renal damage.12,13 Therefore, the effects of specific CYP3A5 polymorphisms on sorafenib toxicity should be clarified in order to guide the selection of patients for this therapy.
Interestingly, previous study has reported that sorafenib, but not its metabolites, prevents cells from entering the cell cycle and also inhibits cycling cells from completing mitosis in hepatocellular carcinoma cells. 14 Extensive observations have demonstrated that genetic polymorphisms of metabolizers and transporters contribute to highly inter-individual variability in the pharmacokinetics and pharmacodynamics of sorafenib for the treatment of hepatocellular carcinoma.15–17 However, whether CYP3A5 genetic polymorphisms influence sorafenib metabolism and pharmacotherapeutic effect in hepatic carcinomas remains poorly understood.
To our knowledge, we are the first to investigate the catalytic activity of seven CYP3A5 variants (CYP3A5*2, CYP3A5*3A, CYP3A5*3C, CYP3A5*4, CYP3A5*5, CYP3A5*6, and CYP3A5*7) when metabolizing sorafenib in vitro and further explore the impacts of CYP3A5 polymorphism on the proliferation and apoptosis of hepatocellular carcinoma cell line (HepG2) induced by sorafenib. Our study elucidates functional consequences of CYP3A5 polymorphism and supports the need for CYP3A5 genotype-based treatment for hepatocellular carcinoma.
Materials and methods
Reagents
Sorafenib and sorafenib N-oxide were purchased from Sigma-Aldrich (St. Louis, MO, USA). The ultra-performance liquid chromatography (UPLC)@BEH C18 column (2.1 mm × 50 mm, 1.7 μm) was purchased from Millipore (Bedford, MA, USA). NADPH was obtained from Promega (Madison, WI, USA). Recombinant human cDNA encoding wild-type (CYP3A5*1) gene or each of six variant genes (CYP3A5*2, CYP3A5*3A, CYP3A5*3C, CYP3A5*4, CYP3A5*5, CYP3A5*6, and CYP3A5*7) was purchased from Wuhan Bafeier Biological (Wuhan, China). Sorafenib N-oxide as internal standard was purchased from Sigma-Aldrich (St Louis, MO, USA). HPLC-grade solvents were obtained from Fisher Scientific (Pittsburgh, PA, USA), and analytical grade reagents were obtained from Merck Chemicals (Darmstadt, Germany). Rabbit anti-human CYP3A5 IgG primary antibody was obtained from Sigma-Aldrich, and the secondary goat anti-rabbit IgG-HRP–conjugated antibody was purchased from Shanghai Gu Ge Biology (Shanghai, China).
Construction of expression vectors
We used the dual-expression plasmid pFastBacTM Dual to simultaneously express each of the CYP3A5 isoform variants together with the internal control enzyme cytochrome P450 2C19 (CYP2C19*1) in Spodoptera frugiperda insect cells (Sf21). The open reading frame of the internal control (OR) was inserted into cloning sites downstream of the P10 promoter in the baculovirus vector. Then the open reading frame of wild-type or variant CYP3A5 was obtained by performing an overlap extension polymerase chain reaction using CYP2C19*1 cDNA as the template. The amplified templates were digested and ligated into the plasmid to obtain the final dual-expression baculovirus vector.
Virus production and protein expression
Virus preparations associated with high expression of CYP3A5 and internal control were used to infect Sf21 cells in Sf-900 II SFM insect culture medium containing 10% fetal bovine serum, 1 × penicillin (100 U/mL) and streptomycin (171.9 μM), as well as 6.1 μM hemin. After 4 days of infection, the expression level of CYP3A5 was determined by western blot. Protein was resolved by SDS-PAGE on a 12.0% polyacrylamide gel. After separation, the target proteins were transferred to a nitrocellulose membrane and probed overnight at 4°C with antibodies against CYP3A5 IgG (1:1000). Blots were washed and incubated with horseradish peroxidase–conjugated goat anti-rabbit IgG (1:3000). Protein was visualized using a chemiluminescence detection system (Thermo Scientific, USA).
Quantification of recombinant protein expression in microsomes
The CYP3A5 variants spectral levels in microsomes were measured by a dual-wavelength/double beam spectrophotometer (Shimadzu, Tokyo, Japan). Briefly, the microsomes were dissolved in 0.1 M phosphate buffer, pH 7.4 which included 20% glycerol. The sample was subsequently diluted to a final concentration of 1.0 M and added into two 1 cm path length quartz cuvettes with equal amount. Then, a few milligrams of solid sodium dithionite were also added to samples. After the baseline between 400 and 500 nm being recorded, carbon monoxide (CO) was bubbled for 1 min through the sample cuvette, and then the spectrum was recorded.
Assay of sorafenib N-oxide
First, a solution of 200 μL containing final concentrations of 5 pmol of wild-type or variant CYP3A5 protein, 5 pmol of purified cytochrome b5, 10 nM potassium phosphate buffer (pH 7.4), and 3.5 μL of an appropriate dilution of sorafenib, such that the final sorafenib concentration ranged from 1 to 80 μM, was pre-incubated for 5 min at 37°C. Then, 2 μL of a 1 mM NADPH-generating system was added and the mixture was incubated for 30 min with gentle shaking. The reaction was terminated by placing at −80°C. The mixture was thawed, mixed with 400 μL acetonitrile and 30 μL of internal standard (8.3 μM, [13C,2H3]-Sorafenib N-oxide), and diluted 1:1 with water. Samples were centrifuged at 13,000 g for 10 min at 4°C, and supernatant was assayed by UPLC-MS/MS as described below. Assays were performed in triplicate, and results were represented as mean ± SD.
UPLC-MS/MS detection of sorafenib N-oxide
A 20 μL aliquot of supernatant was purified on an ekspert ultraLC 100-XL liquid chromatography system (Eksigent, AB SCIEX, USA). Eluate was ionized using electrospray ionization in positive mode at 550°C and detected on-line with an AB SCIEX 4500 QTRAP mass spectrometer (Applied Biosystems, Foster City, CA). Areas under the curve (AUCs) were calculated for sorafenib N-oxide and internal standard from chromatograms. The concentration of sorafenib N-oxide in each sample was calculated by comparing the AUC to curves generated from calibration standards chromatographed under the same conditions.
Generation of recombinant CYP3A5*1, CYP3A5*2, CYP3A5*3A, CYP3A5*3C, CYP3A5*4, CYP3A5*5, CYP3A5*6, and CYP3A5*7 cell lines
HepG2 cells were grown the day before transfection in 25 cm culture dish (7 × 10⁶ cells) and transfected with Lenti-PacTM based on product specifications with 10 μg of plasmid DNA. In order to select the stable transfectants, cells were reinoculated on 6-well plate (1.0 × 10⁶ cells/well) after transfection. Then, puromycin was added into the cells at a final concentration of 12.7 μM. After that, untransfected cells were discarded and living cells were reinoculated on 6-well plate (1.0 × 10⁶ cells/well) with 4.2 μM of puromycin.
Recombinant HepG2 cells culture and sorafenib treatment
HepG2 recombinant cell lines were grown at 37°C in the presence of 5% CO2 and in Dulbecco's modified Eagle's medium (DMEM) (Gibco, Invitrogen), which contains 10% (v/v) of fetal bovine serum (FBS) and 1% (v/v) of antibiotic-antimycotic solution. Cells in logarithmic growth period were used to proceed subsequent experiments. HepG2 recombinant cell lines were grown in 96-well plates (1 × 10⁴ cells/well) or 6-well plate (1 × 10⁶ cells/well), and 24 h later, 30 μM sorafenib was added. Confluent cells (80–90%) were recovered using trypsin/EDTA after washing in PBS. Sorafenib was added to DMEM in 0.1% dimethylsulfoxide (v/v); control cells received an equivalent volume of solvent.
ATP detection
Cellular ATP formation was quantified using the CellTiter-Glo luminescent assay (Promega Corp., Madison, WI). Testing was performed in triplicate in at least three separate experiments.
CCK-8 assay
HepG2 recombinant cell lines were grown in 96-well plates (1 × 10⁴ cells/well) for 24 h; then, 30 μM sorafenib was added in cells. After treatment with drugs for 24 h, 10 μL of CCK8 reagent was added to 96-well plate and further incubated for 2 h. The absorbance (OD) was analyzed by an ELISA plate reader at 450 nm.
Cell apoptosis analysis
HepG2 recombinant cell lines were seeded in 6-well plates (1 × 10⁶ cells/well) and were treated with 30 μM sorafenib for 24 h after which they were harvested by trypsinization and washed with PBS. Cells were fixed overnight in ice-cold 80% ethanol (v/v), recovered by centrifugation at 660 g for 15 min at 4°C and then resuspended in 0.1 M PBS containing 0.1% NP40 (w/v) and 0.1 mg/mL RNAse A. After staining with Annexin-FITC/propidium iodide, cells were incubated on ice for 1 h and subjected to flow cytometry on an FC500 instrument (Beckman Coulter Australia, Lane Cove, NSW) using MXP software.
Statistical analysis
Km and Vmax were determined using GraphPad Prism 5 (GraphPad Software, San Diego, CA, USA). Statistical analysis of differences between groups was performed in SPSS 17.0 (IBM, Chicago, IL, USA). Inter-group differences were assessed using one-way ANOVA, while differences in catalytic parameters between wild-type CYP3A5 and its variants were assessed using Dunnettʼs test. p < 0.05 was regarded as statistically significant.
Results
Generation of recombinant insect cells
Recombinant baculovirus were constructed to co-express the CYP2C19 enzyme, known to metabolize sorafenib into sorafenib N-oxide, as well as the wild-type or mutant CYP3A5 enzyme under investigation. Our plan was to co-purify the two enzymes from the insect cells in parallel and assay them for sorafenib-metabolizing activity. We wished to compare the activity of the individual CYP3A5 mutants with that of the wild-type enzyme.
Expression of CYP3A5 variants in insect cells
Levels of CYP3A5 variants in Sf21 cells were determined using western blot (Figure 1). All CYP3A5 variants were detected. Levels of CYP3A5*3A, CYP3A5*3C, and CYP3A5*4 were noticeably higher than those of the wild-type CYP3A5*1 protein. A dual-wavelength/double beam spectrophotometer was used to determine the concentration of active recombinant CYP3A5 holoprotein in microsomes. This concentration ranged from 0.84 to 1.72 nM across all CYP3A5 alleles. Expression of CYP3A5 variants in Sf21 cells. Insect cells were transfected with baculovirus co-expressing CYP2C19 enzyme (as an internal control) together with the wild-type CYP3A5 enzyme (CYP3A5*1 allele) or one of its variants. Protein expression was determined by western blot.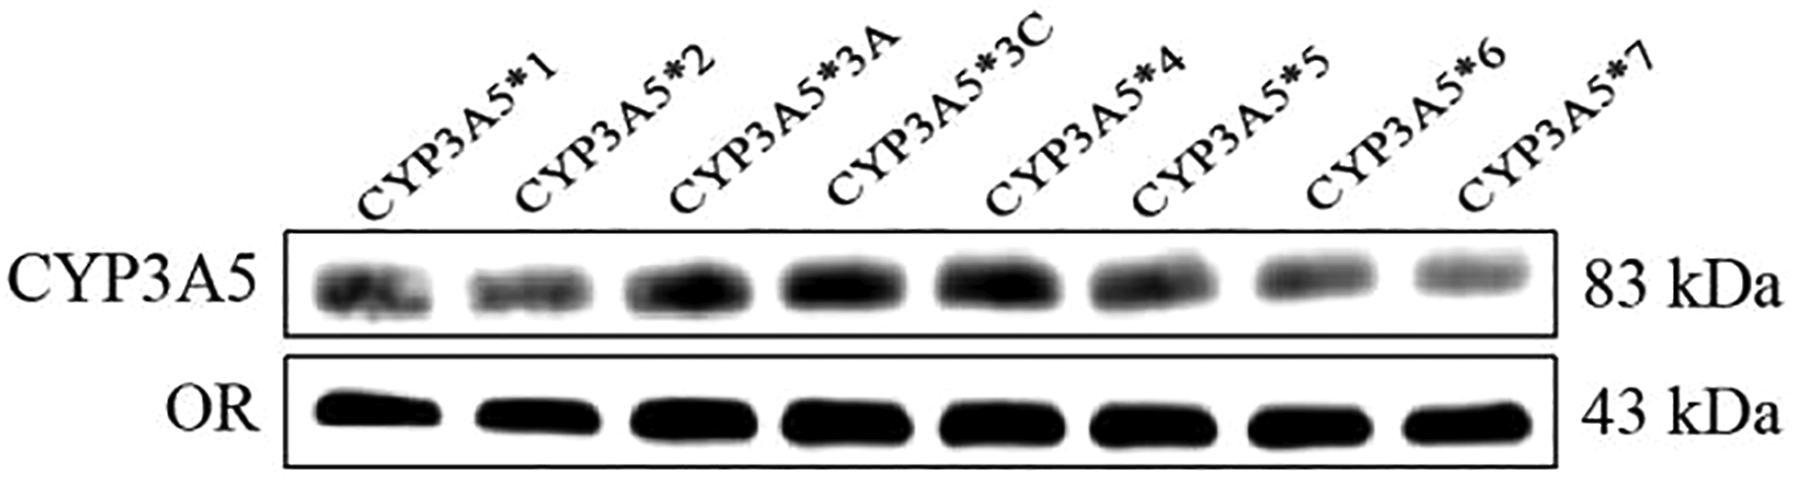
Ability of wild-type and variant CYP3A5 enzymes to metabolize sorafenib
We compared the enzymatic activities of wild-type and seven variant CYP3A5 proteins on sorafenib metabolism in vitro (Figure 2 and Table 1). Six allelic variants showed much lower enzymatic activity than with wild-type. CYP3A5*2, CYP3A5*3A, and CYP3A5*5 showed significantly lower intrinsic clearance (V
max
/K
m
), corresponding to 26.41–71.04% of the wild-type value. A milder reduction in intrinsic clearance was observed for CYP3A5*3C, CYP3A5*4, and CYP3A5*7, whose values were 51.37–71.04% of wild-type. Interestingly, CYP3A5*6 displayed 174.74% higher intrinsic clearance than wild-type. V
max
was significantly greater for this variant than for wild-type (7.25 vs 4.34 pmol/min/pmol P450), but K
m
was similar for the two proteins. This suggests that the observed increase in clearance was due to faster turnover and not to tighter binding afffinity for sorafenib. Conversely, CYP3A5*4 showed significantly lower V
max
than wild-type (3.43 vs 4.34 pmol/min/pmol P450), but similar K
m
, leading to intrinsic clearance that was 79.04% of wild-type. Comparison of CYP3A5 enzymatic activity for metabolizing sorafenib in vitro. Wild-type and variant CYP3A5 enzymes were incubated with increasing concentrations of sorafenib. The Michaelis–Menten equation was applied and sorafenib intrinsic clearance determined. Data are shown as mean ± SD. Experiments were performed in triplicate. Kinetic parameters of wild-type and variant CYP3A5 enzymes for N-oxidation of sorafenib in vitro. aMean ± SD of three independent tests. bBoldfaced values differ significantly from wild-type, 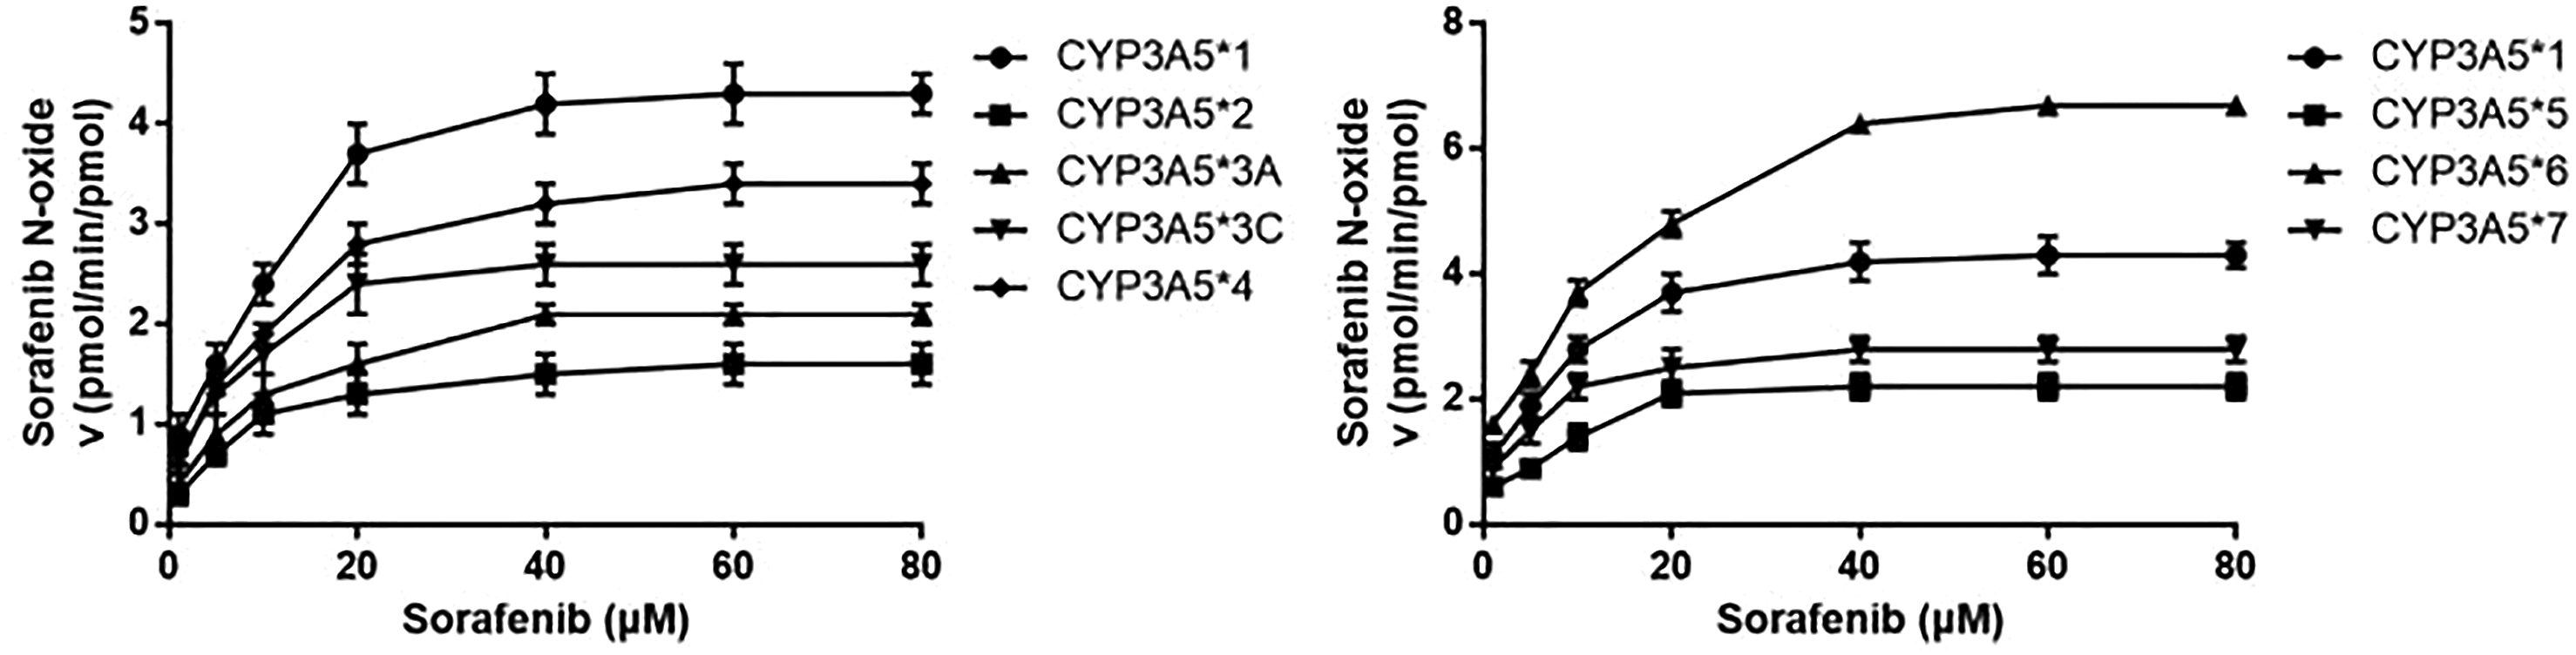

Over-expression of CYP3A5 variants in recombinant HepG2 cell lines
Expressions of all CYP3A5 variants in recombinant HepG2 cell lines were measured by western blot (Figure 3). Levels of CYP3A5*1, CYP3A5*2, CYP3A5*3A, CYP3A5*3C, CYP3A5*4, CYP3A5*5, CYP3A5*6, and CYP3A5*7 were all over-expressed in recombinant cell lines. Thus, these stable recombinant cell lines were used for followed experiments. Overexpression of CYP3A5 variants in recombinant HepG2 cell lines. HepG2 cells were stably transfected with CYP3A5*1, CYP3A5*2, CYP3A5*3A, CYP3A5*3C, CYP3A5*4, CYP3A5*5, CYP3A5*6, and CYP3A5*7 plasmids. Protein expression was determined by western blot.
CYP3A5 variants alter the impacts of sorafenib on cell viability
We further observed the effects of sorafenib on cell viability in recombinant HepG2 cell lines due to ATP involving in cell replication. As shown in Figures 4(a) and (b), the levels of ATP and cell viability in cells transfected with CYP3A5*2, CYP3A5*3A, CYP3A5*3C, CYP3A5*4, CYP3A5*5, and CYP3A5*7 were significantly decreased compared with cells transfecting with CYP3A5*1 (all p < .05). In contrast, the levels of ATP and cell viability in cells transfected with CYP3A5*6 were significantly increased compared with cells transfecting with CYP3A5*1 (all p < .05). These results suggested that the increased CYP3A5 enzymatic activity for metabolizing sorafenib could reduce the inhibitory role of sorafenib in HepG2 cell proliferation. The inhibitory roles of sorafenib in HepG2 cell viability were affected by CYP3A5 genetic polymorphism. HepG2 cells were stably transfected with CYP3A5*1, CYP3A5*2, CYP3A5*3A, CYP3A5*3C, CYP3A5*4, CYP3A5*5, CYP3A5*6, and CYP3A5*7 plasmids. Then, recombinant HepG2 cell lines were treated with 30 μM sorafenib for 24 h. (a) The levels of ATP in recombinant cell lines were measured using the CellTiter-Glo luminescent assay. (b) Relative cell viability was determined using CCK-8 assay. Compared with cells transfected with CYP3A5*1, p < .05.
CYP3A5 variants alter the impacts of sorafenib on cell apoptosis
The results in Figure 5 indicated that the cell apoptosis in cells transfected with CYP3A5*2, CYP3A5*3A, CYP3A5*3C, CYP3A5*4, CYP3A5*5, and CYP3A5*7 was significantly increased compared with cells transfecting with CYP3A5*1 (all p < .05). In contrast, the cell apoptosis in cells transfected with CYP3A5*6 was significantly decreased compared with cells transfecting with CYP3A5*1 (all p < .05). These results suggested that the increased CYP3A5 enzymatic activity for metabolizing sorafenib could induce cell apoptosis. Collectively, CYP3A5*6 displayed higher intrinsic clearance for sorafenib and reduce the effective concentration of this drug. CYP3A5*6 polymorphism decreased HepG2 cell apoptosis induced by sorafenib. HepG2 cells were stably transfected with CYP3A5*1, CYP3A5*2, CYP3A5*3A, CYP3A5*3C, CYP3A5*4, CYP3A5*5, CYP3A5*6, and CYP3A5*7 plasmids. Then, recombinant HepG2 cell lines were treated with 30 μM sorafenib for 24 h. Relative cell apoptosis was determined using Annexin-FITC/PI staining assay. Compared with cells transfected with CYP3A5*1, p < .05.
Discussion
The CYP3A5 gene is highly polymorphic among different ethnicities, and this may result in inter-individual and inter-ethnic variability in drug metabolism and therefore response to drug treatment. For example, subjects who are homozygous for null variants of the gene show a “poor metabolizer” phenotype for whom sorafenib poses a higher risk of toxic side effects during clearance.
18
Conversely, individuals with an “ultra-rapid metabolizer” phenotype tend to respond poorly to standard doses of sorafenib.19–21 The metabolites of sorafenib and metabolic enzymes are shown in Figure 6. A figure with sorafenib metabolism and major metabolites and enzymes.
This is, to our knowledge, the first study to evaluate the catalytic activity of seven CYP3A5 variants. Many studies have investigated the influence of CYP3A5 polymorphism on drug efficacy, but most have focused on the most common allelic variant, CYP3A5*3, which accounts for >45% of Asians with the “poor metabolizer” phenotype.22,23 In our study, we constructed a dual-expression plasmid model of CYP3A5 isoform variants and the internal control enzyme (CYP2C19*1) to observe the effects of CYP3A5 polymorphisms on sorafenib metabolism. Previous study has also reported that CYP2C19 enzyme could not metabolite sorafenib and does not affect CYP3A5 activity;12,24 thus, the dual-expression of CYP2C19 would not affect our assays testing on sorafenib toward CYP3A5 activity.
All but one of the variants, except CYP3A5*6, showed much lower sorafenib metabolism than wild-type (Figure 2 and Table 1). In these six cases, the mutations are predicted to alter the protein sequence, and these substitutions may alter enzyme activity by altering the enzyme’s structure and/or its interactions with sorafenib. It is well known that the single nucleotide polymorphisms (SNPs) in the non-synonymous or the synonymous variants could change the gene sequence. Although the non-synonymous variants do not alter the protein sequence near the substrate binding site or active site, they may change the protein conformation to influence the catalytic activity. 25 Therefore, these mutations in CYP3A5 gene may change enzyme’s structure and/or its interactions with substrates. In contrast to the other six variants, the CYP3A5*6 allele encoded an enzyme showing much higher intrinsic clearance than wild-type. Additionally, the V max value of CYP3A5*6 was significantly increased compared with CYP3A5*1 wild-type gene, whereas its K m value did not change significant, suggesting that the variant reduces the catalytic turnover (speed) and does not alter the binding affinity for sorafenib (Table 1). The higher clearance by this variant is all the more notable given that it was expressed at much lower levels than the other variants.
In clinical observations, some researchers have found that CYP3A5 allelic variants (CYP3A5*2, *3, *6, and *7) which code for enzymes with significantly reduced activities were compared among esophageal cancer and healthy controls in Black and Mixed Ancestry South Africans. 26 In contrast, our study showed that CYP3A5*6 which code for enzyme with dramatically increased activity for sorafenib metabolism. The increased activity of CYP3A5*6 depends on the structural domain of the enzyme which interacts with sorafenib. Furthermore, the decreased activity of CYP3A5*6 in esophageal cancer could be affected by many factors in vivo, including drug antagonist, cytokines, changes in signal protein in cancer cells. 26 However, a previous study has demonstrated that no statistically significant association was investigated among CYP3A5 genotype and plasma donepezil concentrations, or between genotypes and clinical response. 27 The inconsistent results in clinical studies may attribute to the ethnic differences, limitations of sample numbers, and individual differences, so these conclusions need to be further verified in vitro. On the other hand, our results also found that CYP3A5 polymorphisms (CYP3A5*2, CYP3A5*3A, CYP3A5*3C, CYP3A5*4, CYP3A5*5, and CYP3A5*7) decrease the catalytic activities for sorafenib.
Interestingly, previous study has reported that sorafenib, but not its metabolites, prevents cells from entering the cell cycle and also inhibits cycling cells from completing mitosis in hepatocellular carcinoma cells. 14 Thus, we further study the effects of CYP3A5 variants on cell proliferation and apoptosis of HepG2 cells exposed to sorafenib. Although sorafenib has been the only system treatment available for advanced hepatocellular carcinoma over decade, 28 the genetic polymorphisms of metabolizers and transporters also contribute to highly inter-individual variability in the pharmacokinetics and pharmacodynamics of sorafenib.15–17 And our study showed that CYP3A5 polymorphisms (CYP3A5*2, CYP3A5*3A, CYP3A5*3C, CYP3A5*4, CYP3A5*5, and CYP3A5*7) decreased cell proliferation (Figure 4) and induced apoptosis in HepG2 cells (Figure 5), whereas CYP3A5*6 had the opposite effect. These findings suggested that CYP3A5 polymorphisms affect the survival of hepatocellular carcinoma cells via regulating metabolic rate of sorafenib.
Conclusions
In summary, our research provides new insights into the implications of CYP3A5 polymorphisms for efficacy of sorafenib treatment. Future work should seek to confirm these insights and apply them to the development of personalized approaches to treating patients with advanced hepatocellular carcinoma.
Footnotes
Acknowledgments
The authors thank the Department of Pharmacy, Wuhan Third Hospital (Tongren Hospital of Wuhan University). This study was supported by Health Commission of Hubei Province scientific research project (No. WJ2021M011).
Author contributions
HYS, JSX, and YGC conceived and designed the research. LC conducted the experiments. HYS contributed to the new reagents and analytical kits. JSX and YGC analyzed and interpreted the data. HYS drafted the article. LC read and approved the final article. All authors read and approved the final article.
Declaration of conflicting interests
The author(s) declared no potential conflicts of interest with respect to the research, authorship, and/or publication of this article.
Funding
The author(s) received no financial support for the research, authorship, and/or publication of this article.