
Abstract
Liver cancer is a malignant cancer with great harmfulness. Fenofibrate is a peroxisome proliferation activated receptor (PPARα) agonist widely used in the treatment of dyslipidemia. Previous studies have shown that fenofibrate may promote cell proliferation, but the underlying mechanism has not been fully characterized. The aim of this study was to investigate the role of PPARα agonist fenofibrate in cell proliferation of SMMC-7721 cells compared with that of THLE-2 cells. SMMC-7721 and THLE-2 cells were treated with different concentrations of fenofibrate. Cell proliferation was analyzed by MTT, using flow cytometry for cell cycle analysis, and CyclinD1, Cyclin-dependent kinases2 (CDK2) and Proliferating Cell Nuclear Antigen (PCNA) were analyzed by Western blotting. RT-qPCR method was used to assess CDK2, CyclinD1 and PCNA mRNA levels. The results showed that 10−9–10−4 mol/L fenofibrate could induce cell growth and 10−4, 10−5, 10−6 mol/L fenofibrate could reduce the number of G0/G1 phase cells and increased in the number of cells in S and G2/M phase of cell cycle in SMMC-7721 cells. Furthermore, fenofibrate could significantly increase the expression of cell cycle related protein (CyclinD1, CDK2)and cell proliferation related proteins (PCNA). The use of PPARα inhibitor MT886 inhibited cell cycle progression and promote tumor cell apoptosis. But fenofibrate had no obvious effect on THLE-2 cells. These results revealed the effect of fenofibrate on the cell cycle of liver cancer cells, and provided a reasonable explanation for studying how fenofibrate promotes cell proliferation.
Introduction
According to research reports, liver cancer was expected to become the sixth most common cancer and the fourth leading cause of cancer death in the world in 2018, with approximately 841,000 new cases and 782,000 deaths each year. In most parts of the world, men’s morbidity and mortality are two to three times higher than women’s. Liver cancer ranks fifth among global cases and second among male deaths. 1 Liver cancer is one of the most common cancers in China and the main cause of cancer deaths, accounting for more than 50% of new cases and deaths worldwide. The incidence of liver cancer in my country is higher than other countries in the world. China’s population accounts for approximately 19% of the world’s population, but new cases and deaths of liver cancer account for more than 50% of the world’s new cases and deaths. 2 In 2014, there were about 364,800 new cases of liver cancer in China (268,900 men and 95,900 women), and about 318,800 liver cancer deaths (233.5 million men and 85,300 women). It would decrease by more than 44% between 2014 and 2030 in China. 3
PPARα receptor is one of the members of the PPAR nuclear receptor family, and is a ligand-dependent transcription factor expressed in large amounts in the liver. 4,5 PPARα can be activated by fatty acids and other lipid species, as well as by a chemical substance that is a peroxisome proliferator. 6,7 In rats and mice, peroxisome proliferators are a special kind of Liver growth carcinogens can cause peroxisome and smooth endoplasmic reticulum proliferation, increase replicative DNA synthesis and cell proliferation. 8 It is well known that clofibrate can induce oxidative stress in rodents through PPAR-mediated peroxisome proliferation, which indicates that this chemical may be a carcinogen specific to rodents. 9
Fenofibrate and clofibrate have similar structures and belong to fibric acid compounds. They are widely used as a lipid-lowering drug for hypercholesterolemia with dyslipidemia, residual hyperlipidemia, hypertriglyceridemia, and mixed Type hyperlipidemia. 10,11 In addition to lowering blood lipids, fenofibrate has also been shown to have other beneficial effects, such as enhancing endothelial function, anti-inflammatory and anti-atherosclerotic effects. Fenofibrate exerts its effect by activating a nuclear transcription factor PPAR, the transcription factor. Studies have shown that fenofibrate is an effective PPAR anti-agonist. 12,13 Fenofibrate drugs can also have toxic effects, including obvious peroxisome proliferation and carcinogenic effects on rodents. 14 –16 According to information released by the US Food and Drug Administration (FDA), fenofibrate at a concentration of 200 mg/kg increases the incidence of liver cancer in rats and mice. Recently, Kawai et al. also reported that fenofibrate increased the number of pre-tumor lesions in rasH2 mice (this model was created by microinjecting the human c-Ha-ras gene into C57BL/6 x BALB/c F2 zygotes). 17 It is hypothesized that fenofibrate destroys the growth regulation of hepatocytes by inducing abnormal cell proliferation and inhibiting cell apoptosis. 18,19 However, the exact molecular mechanism of fenofibrate involved in the occurrence of liver cancer is still unclear. 20 In view of the fact that fenofibrate is widely used in the treatment of various diseases and has high clinical value, it is very important to study the toxicity mechanism of fenofibrate that occur in vitro.
We noticed that the subject of above studies was rodents and the dose of above studies was several times of the clinical dose. Literature reported high levels of fatty acids promotes the proliferation of breast cancer by stimulating PPARα. 21 and PPARα can induce the cell cycle related protein by to adjust the cell cycle. 22 Therefore, we conducted a study on the effect of fenofibrate at therapeutic dose on the proliferation and cell cycle of human liver cancer cells.
In this study, we investigated the role of PPARα agonist fenofibrate in cell proliferation between SMMC-7721 cells and normal hepatocytes THLE-2 cell lines. We found that the expression of PCNA, CyclinD1 and CDK2 induced by fenofibrate may be one of the potential mechanisms to change cell cycle regulation and the progress of liver cancer. The use of PPARα inhibitor MT886 inhibited cell cycle progression and promote tumor cell apoptosis. This reveals that PPARα receptors may play an important role in tumor cell proliferation.
Materials and methods
Chemicals and reagents
Culture media and growth supplements include Dulbecco’s Modified Eagle’s Medium (DMEM) and heat-inactivated fetal bovine serum (FBS), were purchased from Every Green (Zhejiang Tianhang Biotechnology Co., Ltd). Fenofibrate, MT886 and vincristine were obtained from MedChemExpress (MedChemExpress LLC, China). Cell cycle kit was purchased from Bestbio (Institute of Biotechnology, Shanghai, China). The primary antibodies PPARα, CyclinD1, cyclin-dependent kinases (CDK2) and Proliferating Cell Nuclear Antigen (PCNA) were obtained from Proteintech (Wuhan, China). Anti-β-actin and anti-rabbit horseradish peroxidase were purchased from Zhongshan Jinqiao, (Beijing, China). phenylmethanesulfonyl fluoride (PMSF) (Biyuntian, China). BCA assay kit (BestBio, Institute of Biotechnology, Shanghai, China). PVDF membrane (Millipore, Billerica, MA, United States) ECL-chemiluminescent kit (Thermo Scientific, United States).
Cell cultures and treatments
SMMC-7721, THLE-2 cells were purchased from Cell Bank of Chinese Academy of Sciences (Shanghai, China). Cells were maintained in DMEM, supplemented with 10% FBS and 1% Penicillin-Streptomycin solution, cultures were maintained at 37 ºC in a humidified 5% CO2 incubator. The fresh medium was changed every other day.
MTT assay
The MTT method was used to determine the viability of the cell line after adding the drug. Cells were seeded in a 96-well plate at a density of 1 × 10³ cells per well, and 100 µl of medium was added to each well for 24 hours without any treatment. 24 h later, cells were treated with various doses of fenofibrate (0, 10−3, 10−4, 10−5, 10−6, 10−7, 10−8 and 10−9 mol/L) for 24 h. Afterward, 20 µl MTT tetrazolium salt (2 mg/ml) was added to wells and the cells were incubated for 4 h.
After incubation, we removed the medium and added DMSO to the 96-well plate. It dissolved the insoluble Formazan crystals and produced a purple color. Each group had 6 replicates. Measure the absorbance value at 490 nm and calculate the cell survival rate according to the formula (mean OD of treated cells/mean OD of control cells) × 100. All measurements were repeated three times.
Cell cycle analysis
The cells were inoculated to 6-well plates by the number of 2 × 10⁵ cells per well, after the cells were attached to the wall, serum culture solution was added for 24 h. Fenofibrate with concentrations of 0, 10−4, 10−5, 10−6 mol/L was added for further incubation for 24 h. 1 × 10⁵–5 × 10⁵ cells were collected. The cells were washed twice with cold PBS, the supernatant was discarded, 2 ml ice ethanol was added, and fixed at 4°C for 12–24 h. Centrifugation was performed at 1000 g for 5 min and supernatant was discarded. Then the cells were washed with cold PBS twice, centrifuged at 1000 g for 5 min, the supernatant was discarded, and the cells were suspended with cold PBS at 500 μl. Rnase A (100 μg/ml) 20 µl was added, water bath at 37°C for 30 min, and supernatant was centrifuged and discarded. Then added 400 µl staining solution propidium iodide (PI), incubated at 4°C for 30 min, and detected with 488 nm flow cytometry.
Western blotting analysis
The cells were incubated with various concentrations of fenofibrate (0, 10−4, 10−5, 10−6 mol/L) for 24 h. The total protein was extracted with PMSF-containing radioimmunoprecipitation (RIPA) buffer. The whole extract was prepared, and the protein level was measured with the BCA kit. Always separate the protein SDS-PAGE from the sample and apply it to the PVDF membrane, then block it with 5% skimmed milk at 37°C for 2 h. The transfer membrane and the primary antibody were incubated overnight at 4°C. After washing three times with TBS/Tween-20, incubate for 1 h in goat anti-mouse or goat anti-rabbit horseradish peroxidase binding antibody diluted 1:10000 in TBS/Tween-20 containing 5% skim milk. Wash the membrane three times with TBS/Tween-20, and the ECL-chemiluminescence kit displays the protein. Densitometric analysis of specific bands was performed using Image J software (National Institutes of Health, Bethesda, MD). The categories and concentrations of primary antibodies: anti-PCNA (human, 1:2000), anti-CyclinD1 (rabbit, 1:2000), anti-CDK2(mouse, 1:2000), anti-β-actin (mouse, 1:500), anti-PPARα (human, 1:2000).
Real-time qPCR
Total RNA was prepared from SMMC-7721 cells and THLE-2 cells using Trizol reagent (Invitrogen, USA). To perform RNA quality control, RNA was quantified spectrophotometrically using a spectrophotometer (DeNovix, Inc., USA), and RNA integrity was verified by agarose gel electrophoresis. We used the epitaxy DS-11FX+ spectrophotometer (Epitaxial Company, USA) to measure the absorbance at different wavelengths. RNA has a maximum absorbance at 260 nm, and the ratio of absorbance at 260, 280 nm and 260, 230 nm was used to evaluate RNA purity. The A260/A230 ratio was used to estimate the presence of contaminants, such as salt, carbohydrates, peptides, etc. while the A260/A280 ratio was used to estimate mRNA purity. The ratio range is generally 1.8–2.1. When the ratio of A260/A280 is lower than 1.8, it means that the RNA sample is contaminated by proteins or other compounds that absorb OD280 nm light. The ratio of A260/A280 of our experimental RNA solution was between 1.95 and 2.05. All RNA samples were free of contamination. 23 Using TAKAR RT-qPCR synthesis kit, cDNA was synthesized with 11 RNAs according to the instructions (TAKARA, Dalian, China). SYBR premixed Ex Taq II (TAKARA, Dalian, China) was used for cDNA synthesis on the PikoReal 96 qPCR system (Thermo Scientific, USA). 24 Gene expression with actin as an internal control gene (“housekeeping” gene). Data were processed by the 2−ΔΔCt method. The sequences of the primers used (Sangon Biotech, China) are shown in Table 1.
Primers for real-time PCR.

Cell apoptosis analysis
The cells were inoculated to 6-well plates by the number of 2 × 10⁵ cells per well, after the cells were attached to the wall, serum culture solution was added for 24 h. Fenofibrate with concentrations of 0, 10−4, 10−5, 10−6 mol/L was added for further incubation for 24 h. 1 × 10⁵–5 × 10⁵ cells were collected. Suspended cells were collected by centrifugation, the microcentrifuge speed was 2000 RPM, and the centrifugation time was 5 min to discard the culture medium. The cells washed twice with cold PBS. Then we used 400ul 1X Binding Buffer to suspend cells at a concentration of about 1 × 10⁶ cells. 5ul Annexin V-FITC was added to the cell suspension, mixed gently at 2–8°C. After adding 10ul PI, mixed gently and incubated at 2–8°C in the dark for 5 minutes. Finally, flow cytometry was used for detection within 1 hour.
Statistical analysis
All data were represented as Mean ± SD. Statistical significance was performed by either the three-way ANOVA or Student’s t-test by SPSS software (version 17.0). The significant difference was statistically considered as *p < 0.05, **p < 0.01, ***p < 0.001; #P < 0.05, ##P < 0.01, ###P < 0.001; & P < 0.05, && P < 0.01, &&& P < 0.001; N.S not significant.
Results
Fenofibrate increased proliferation in SMMC-7721 cells
Fenofibrate is a typical PPARα agonist, in order to study the effect of fenofibrate on the proliferation of liver cancer cells, SMMC-7721 and THLE-2 cells were selected to study the effect of fenofibrate. Two kinds of cells were cultured with different doses of fenofibrate (0, 10−3, 10−4, 10−5, 10−6, 10−7, 10−8 and 10−9 mol/L) for 24 h respectively, and cell viability was determined by MTT method. As shown in the Figure 1, the cell viability of SMMC-7721 cells was improved after 24 h treatment. Compared with the control group, the cell viability was significantly improved after fenofibrate treatment (P < 0.05) (P < 0.01) (Figure 1(a)). Especially at 10−4 mol/L, the cell survival rate reached the maximum 158.7%, and the proliferation rate was the highest at this 58.7% concentration. However, the drug was cytotoxic at higher concentrations of 10−3 mol/L, which significantly inhibited cell growth. Meanwhile, fenofibrate had little effect on THLE-2 cells at 0, 10−4, 10−5, 10−6, 10−7, 10−8 and 10−9 mol/L concentrations, except for cytotoxicity at 10−3 mol/L concentrations. Therefore, we believed that fenofibrate has little effect on THLE-2 cells (Figure 1(b)).
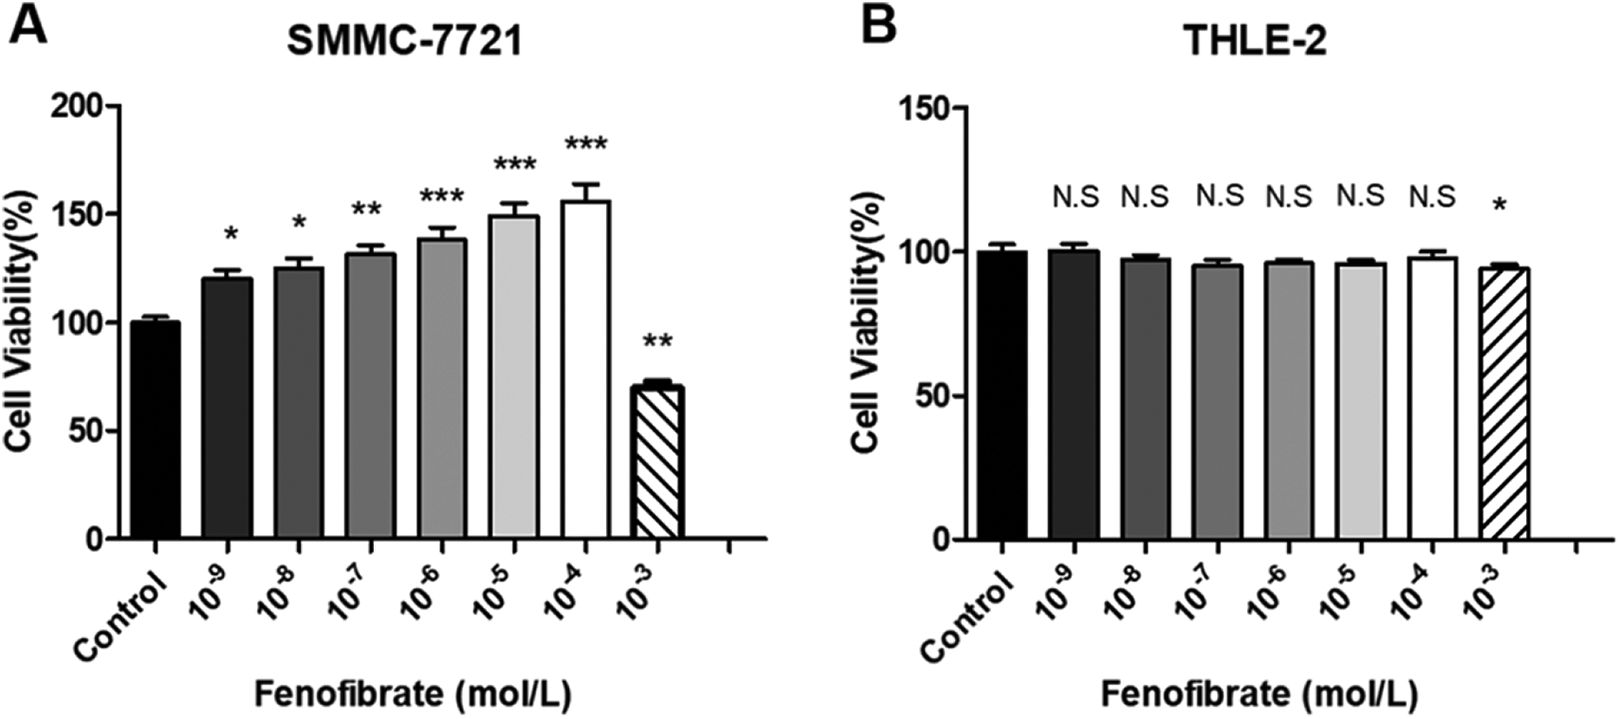
Fenofibrate has a significant proliferation effect on SMMC-7721 cells and has cytotoxic effect only when the concentration is 10−3 mol/L. Meanwhile, it has little or no effect on THLE-2 cells. SMMC-7721 (A) and THLE-2 (B) cells were treated with Fenofibrate (10−3–10−9 mol/L) for 24 h and cell viability was analyzed by MTT assay. Results are represented as mean ± S.D. Data. *p < 0.05, **p < 0.01, ***p < 0.001; N.S not significant; compared with control group.
Fenofibrate promoted cell cycle progression of SMMC-7721 cells
The cell proliferation rate is determined by calculating the proportion of cells in each phase of the cell cycle. The decrease in the number of cells in the G0/G1 phase, while the increase in the number of cells in the S and G2/M phases indicated that the drug treatment had led to the progression of the cell cycle. In order to determine whether fenofibrate induces SMMC-7721 cell proliferation through cell cycle progression, we conducted a cell cycle test. Flow cytometry was also performed on THLE-2 cells. As shown in Figure 2, compared with the control group, 24 h after fenofibrate treatment, G0/G1 phase cells were significantly reduced, which was accompanied by an increase in the number of S phase and G2/M phase cells in SMMC-7721 cells cell cycle (P < 0.05) (P < 0.01) (Figure 2(a) and (c)), in the control group, G1 stage was 72.92%, and fenofibrate of 10−4 mol/L was 54.30%. In THLE-2 cells, after 24 h of fenofibrate treatment, there was no significant change in cell cycle, indicating that the drug had little effect on THLE-2 cells (Figure 2(b) and (d)). This suggested that fenofibrate treatment is responsible for the development of the cell cycle. In particular, at the drug concentration of 10−4 mol/L, S and G2 cells account for the largest proportion of the whole cell cycle, from 10−7 to 10−4 mol/L, and the proportion of S and G2 cells in the whole cell cycle gradually increases with the increase of drug concentration. It suggested that fenofibrate can promote the proliferation of SMMC-7721 cells by affecting the cell cycle progression.
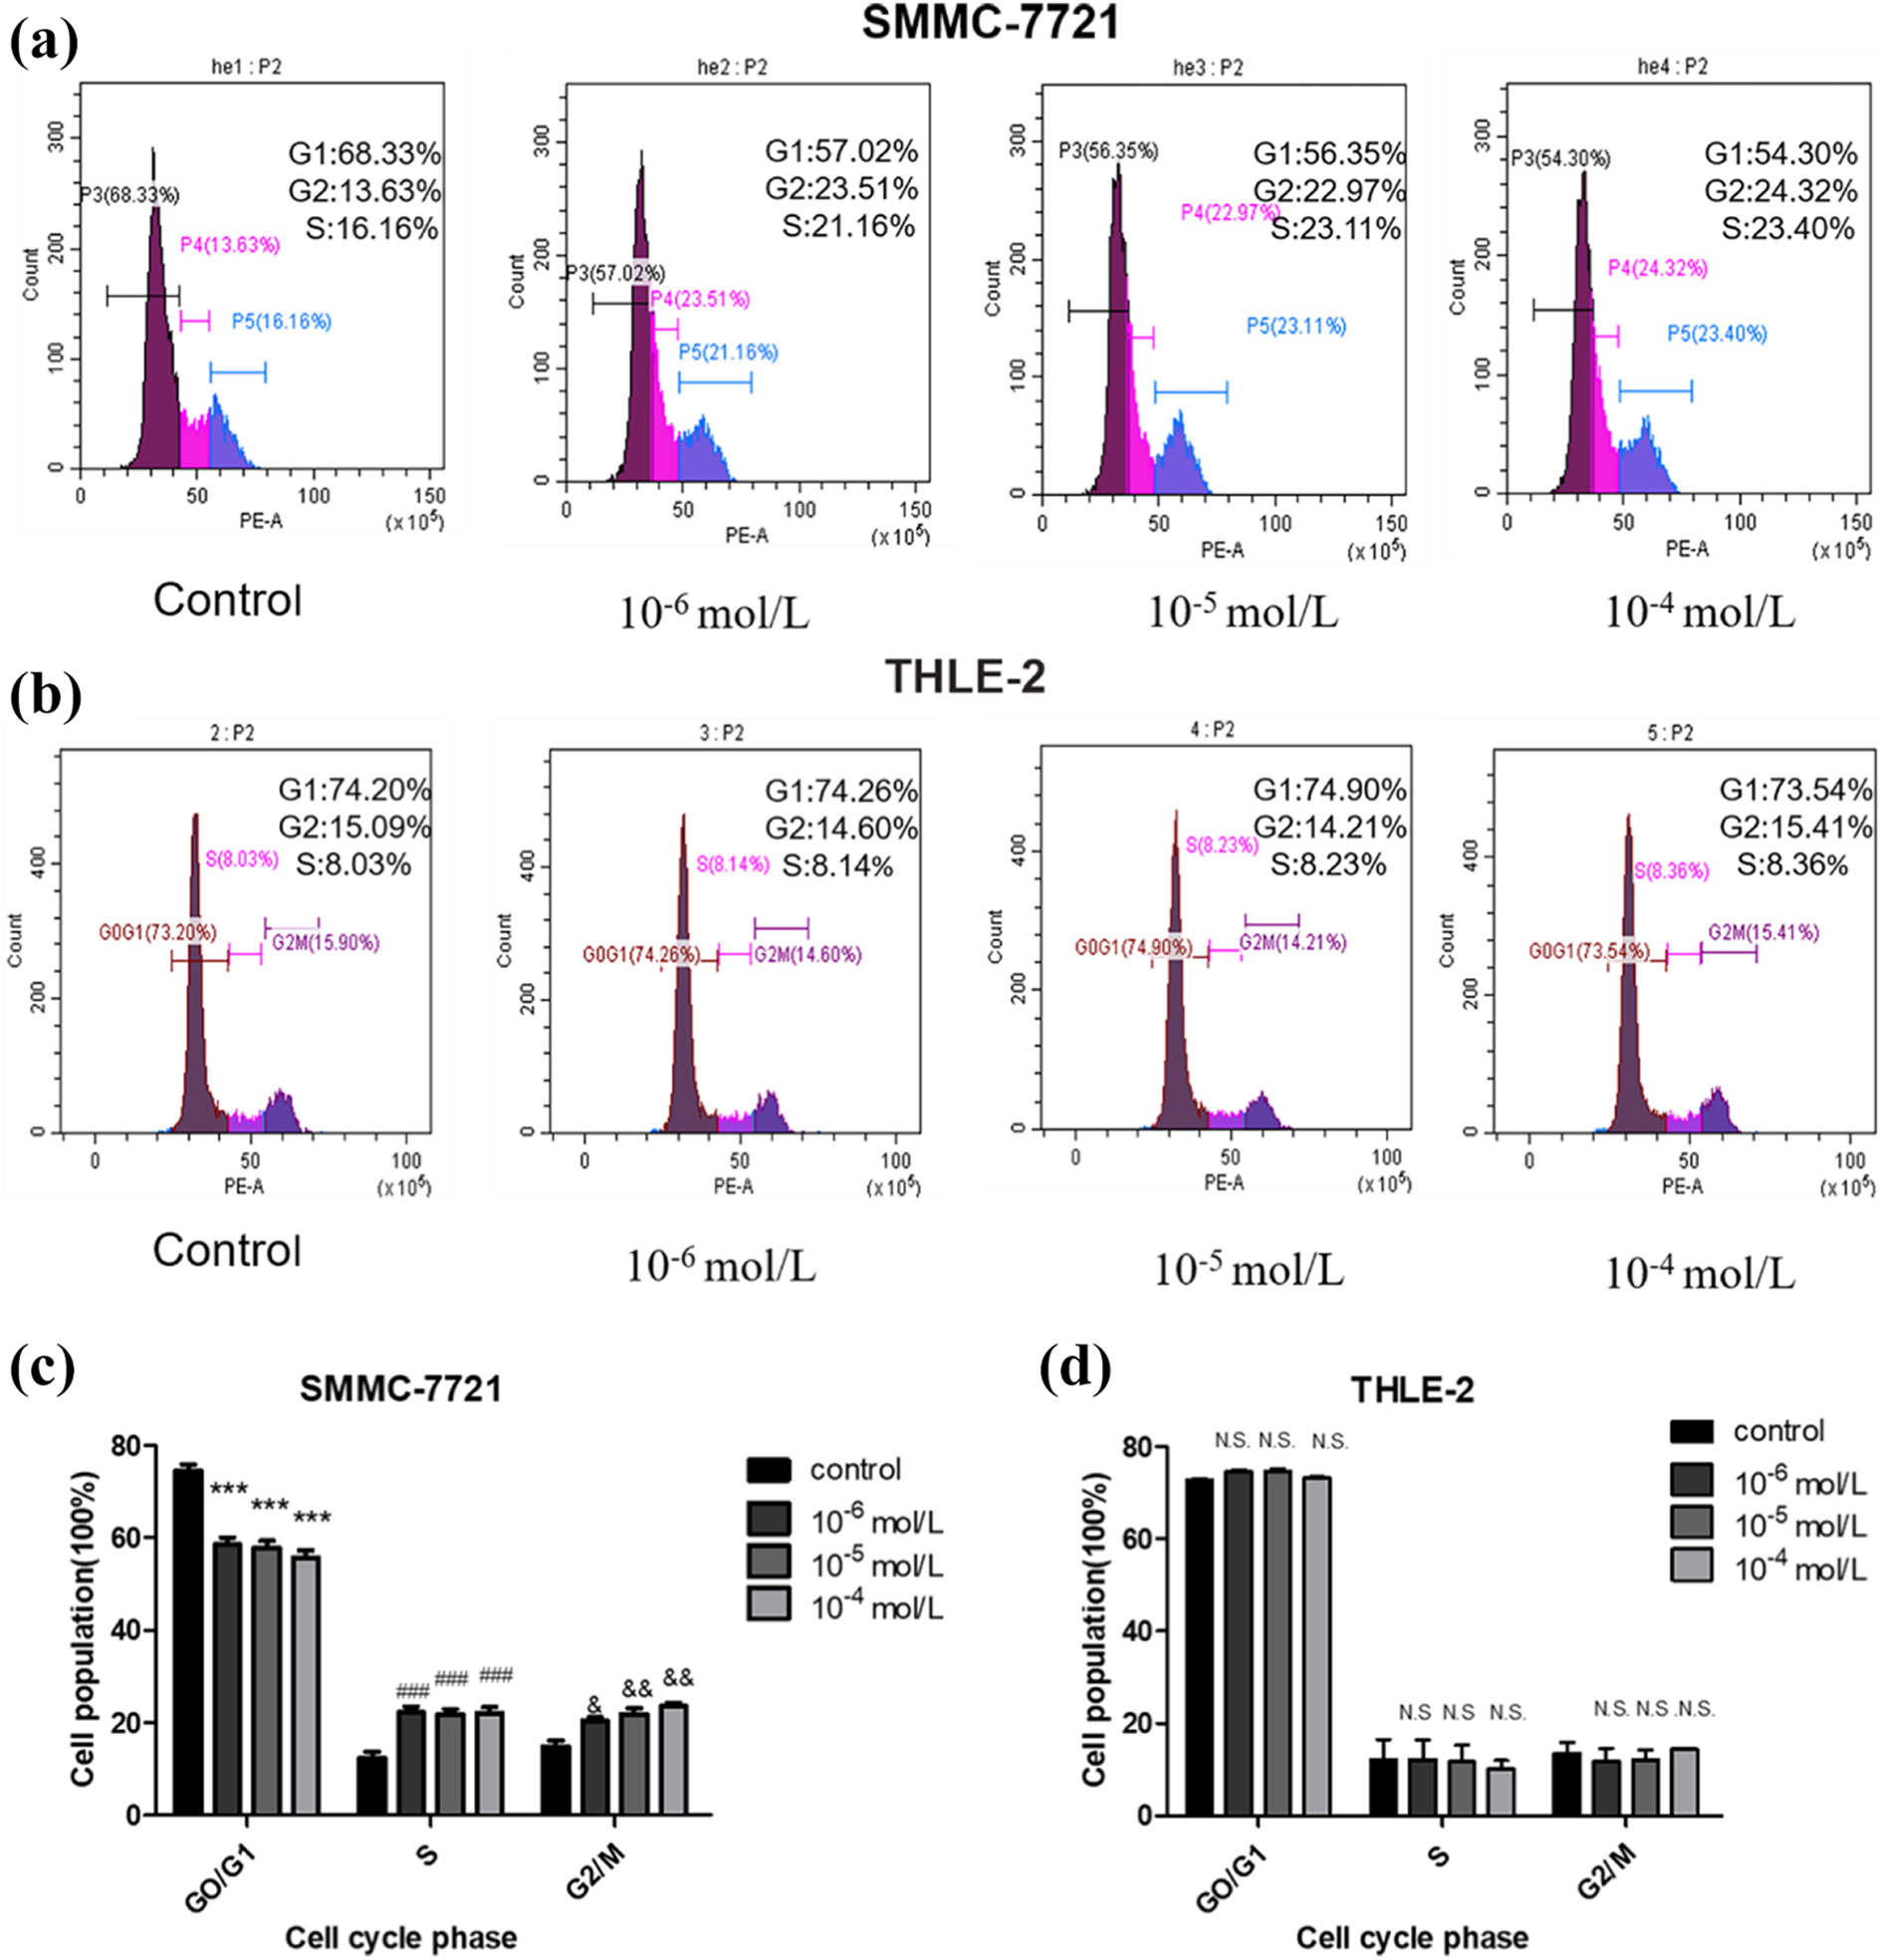
After treating SMMC-7721 and THLE-2 cells with 10−4, 10−5, 10−6 mol/L fenofibrate for 24 hours (a and b), flow cytometry detection showed that fenofibrate could change cell cycle in SMMC-7721 cells. Compared with the control group, 24 h after fenofibrate treatment, G0/G1 phase cells were significantly reduced, which was accompanied by an increase in the number of S phase and G2/M phase cells (c). Meanwhile, it had little effect on normal liver cell THLE-2 (d). Results are represented as mean ± S.D. Data. *p < 0.05, **p < 0.01, ***p < 0.001; #P < 0.05, ##P < 0.01, ###P < 0.001; & P < 0.05, && P < 0.01, &&& P < 0.001; N.S not significant; compared with control group.
Fenofibrate stimulated the high expression of PPARα in SMMC-7721 cells, compared with acting on THLE-2 cells
The expression of PPARα is relatively low in normal cells. SMMC-7721 cells in our study were more sensitive to fenofibrate. As shown in the Figure 3, we did a WB experiment to study the expression of PPARα in SMMC-7721 cells and THLE-2 cells after adding fenofibrate (10−4 mol/L). The results show that PPARα expression in tumor cells is higher than normal cells, at the same time, fenofibrate is more sensitive to SMMC-7721 cells. Compared with acting on THLE-2 cells, fenofibrate stimulates the high expression of PPARα in SMMC-7721 cells.

SMMC-7721 and THLE-2 cells were treated with 10−4mol/L fenofibrate for 24 hours, Western blotting was used to analyze the protein level of PPARα. Compared with acting on THLE-2 cells, fenofibrate stimulates the high expression of PPARα in SMMC-7721 cells. *p < 0.05, **p < 0.01, ***p < 0.001; #P < 0.05, ##P < 0.01, ###P < 0.001; & P < 0.05, && P < 0.01, &&& P < 0.001.
Fenofibrate treatment increased CyclinD1, CDK2 and PCNA expression levels
CyclinD1 and CDK2 are the key to cell cycle regulation, especially in checkpoint regulation. Cyclin-dependent kinases play an important role in cell cycle regulation, which makes it a targeted target with multiple therapeutic potentials. Therefore, we use Western blotting to detect the expression of CyclinD1, CDK2 and PCNA in SMMC-7721 cells. Indeed, the data demonstrated that fenofibrate significantly increased their expression in SMMC-7721 cells compared to control (P < 0.05) (Figure 4(a)). At the same time, there was no significant difference in the expression of THLE-2 cells, indicating that the drug had little effect on THLE-2 cells (P < 0.05) (Figure 4(b)). The results demonstrated that fenofibrate significantly increased the expression levels of CyclinD1, CDK2 and PCNA in SMMC-7721 cells.

SMMC-7721 and THLE-2 cells were treated with 10−4, 10−5, 10−6 mol/L fenofibrate for 24 hours, Western blotting was used to analyze cell cycle related protein levels of CylinD1, PCNA and CDK2. Fenofibrate significantly increased their expression in SMMC-7721 cells compared to control (a), and it had little effect on normal liver cell THLE-2 (b). Results are represented as mean ± S.D. Data. *p < 0.05, **p < 0.01, ***p < 0.001; #P < 0.05, ##P < 0.01, ###P < 0.001; & P < 0.05, && P < 0.01, &&& P < 0.001; N.S not significant; compared with control group.
Fenofibrate promoted the expression of cell cycle genes in SMMC-7721 cells
The cell cycle plays an important role in the proliferation of cancer cells. CylinD1, PCNA and CDK2 are key molecules in cell cycle regulation, especially in checkpoint regulation. RT-qPCR was used to detect the mRNA levels of CylinD1, PCNA and CDK2 after fenofibrate treatment. As shown in Figure 5(a), the mRNA levels of CylinD1, CDK2 and PCNA were up-regulated in SMMC-7721 cells when exposed to fenofibrate for 24 h compared with control group (p < 0.05). Meanwhile, as shown in Figure 5(b), the mRNA levels of CylinD1, CDK2 and PCNA almost had no change in normal THLE-2 cells after fenofibrate treatment. These data demonstrated that fenofibrate can promote the mRNA levels of CylinD1, CDK2 and PCNA in SMMC-7721 cells compared with normal THLE-2 cells.

Fenofibrate altered the expression of cell cycle genes in SMMC-7721 and THLE-2 cells. Cells were treated with 10−4, 10−5, 10−6 mol/L fenofibrate for 24 hours, quantitative real-time PCR was used to detected the mRNA level of CylinD1, PCNA and CDK2 (a and b). Results are represented as mean ± S.D. Data. *p < 0.05, **p < 0.01, ***p < 0.001; N.S not significant; compared with control group.
Fenofibrate inhibited apoptosis of SMMC-7721 cells
Fenofibrate promoted cell proliferation and inhibits cell apoptosis, then realized its proliferation effect on SMMC-7721 cells. As shown in Figure 6, we conducted apoptosis experiments on SMMC-7721 cells and THLE-2 cells respectively. Cell flow cytometry found that compared with the normal group, fenofibrate reduced the apoptosis rate of SMMC-7721 cells, reaching an apoptosis inhibition rate of about 8%; under the same experimental conditions, fenofibrate had almost no effect on the apoptosis rate of THLE-2 cells.

Flow cytometry detection showed that compared with the normal group, at concentrations of 10−4, 10−5, 10−6 mol/L, fenofibrate the apoptosis of SMMC-7721 cells (a and c), the same concentrations had almost no effect on THLE-2 cells (b and d). Results are represented as mean ± S.D. Data. *p < 0.05, **p < 0.01, ***p < 0.001; N.S not significant; compared with control group.
Effect of PPARα inhibitor MT886 on SMMC-7721 cyclins
We added the PPARα inhibitor MT886 to SMMC-7721 cells to study the important role of PPARα receptors in tumor cells. And we chose the tumor suppressor vincristine as the positive control drug. We first studied the inhibitory effects of different concentrations of MT886 and vincristine on SMMC-7721 cells through MTT experiments (Figure 7(a) and (b)). Fenofibrate, MT886 and vincristine were added to the cells at a concentration of 10−5mol/L. Then, through WB and q-PCR experiments, we found that compared with the control group, the PPARα inhibitor MT886 significantly inhibited the expression of cyclin CDK2 and CyclinD1 (Figure 7(c) and (d)).

MTT experiment showed the inhibitory effect of PPARα inhibitor MT886 and vincristine on SMMC-7721 cells (a and b). WB and q-PCR experiments showed that MT886 and vincristine inhibited the expression of CDK2 and CylinD1, compared with the control group (c and d). Results are represented as mean ± S.D. Data. *p < 0.05, **p < 0.01, ***p < 0.001; #P < 0.05, ##P < 0.01, ###P < 0.001; & P < 0.05, && P < 0.01, &&& P < 0.001; N.S not significant; compared with control group.
Discussion
Fenofibrate is a member of fibric acid compounds and is widely used in lipid-lowering drugs for the treatment of various lipid diseases. Some studies have shown that fenofibrate can stimulate the development of liver cancer in rodents, 14 –16 so we want to evaluate the stimulation of SMMC-7721 cells proliferation by fenofibrate, and SMMC-7721 is a human liver cancer cell line.
In this study, we investigated the role of PPARα agonist fenofibrate in cell proliferation of SMMC-7721 cells, compared with that of THLE-2 cells. We found that fenofibrate can induce cell proliferation of SMMC-7721 cells (Figure 8). In the further experiment of cell cycle detection, we found that fenofibrate can reduce the number of G0/G1 phase cells and increase the number of cells in S phase and G2/M phase in SMMC-7721 cells. The cell cycle is a series of events that cause a duplicating and dividing cell to divide into two equal copies. The cell cycle of eukaryotes is divided into G0 phase, G1 phase, S phase, G2 phase and M phase. DNA is synthesized in S phase and cells divide in M phase. 25 When the proportion of S phase and G2/M phase cells in the total cell cycle increases, the number of cells in the cell division phase or late division phase increases, meanwhile the number of cells in the early division phase and dormant phase decreases. This suggested that fenofibrate is responsible for the development of the cell cycle. In cancer, proliferation is mostly driven by altered cell cycle progression. 26 It suggested that fenofibrate can promote the proliferation of SMMC-7721 cells by affecting the cell cycle progression.

Schematic image of taking fenofibrate drugs can cause cancer cells to proliferate in the body.
The effect of fenofibrate on cell proliferation is controversial. The result of one study 18 suggest that DNA damage caused by cell proliferation induction, apoptosis inhibition and oxidative stress may be involved in the mechanism of fenofibrate inducing liver cancer in rats. Other articles report that it inhibits proliferation. 27
Only the decrease in the proportion of G0/G1 cells cannot be judged as the result of cell cycle activation. At the same time, it is necessary to look at the expression of cyclin and cyclin-dependent kinase (CDK). 28 Different cyclin subtypes activate CDK to regulate the cell cycle. Some oncoproteins, tumor suppressor proteins and transcription factors can act on the promoter region of CyclinD1 and regulate the expression of CyclinD1.At different stages, if the expression of cyclin increases, G0/G1 quickly enters S phase and G2/M phase, and the proportion of G0/G1 cells decreases, which is the result of cell cycle activation. If the cyclin subtype that regulates G2/M is suppressed and the cell cycle stays in the G2/M phase, although the proportion of G0/G1 cells decreases, then it is the result of cell cycle arrest. 29,30 In our study, MTT experimental data demonstrated the proliferation effect of fenofibrate on cells, Cyclin D1 and CDK2 regulates cell proliferation by promoting the progression through G1 to S phase of the cell cycle, indicating that the ratio of cells in the S and G2/M phases increased through the checkpoint of DNA damage in the G2/M phase, which accelerated the progress of cell cycle. Some studies 31,32 suggest that a decrease in the G0/G1 cell ratio leads to G2/M phase arrest and apoptosis. Reading these articles carefully, we found that they all did MTT or CCK-8 experiments, where the data showed that the drug inhibited the cells. The drugs induced G2/M phase cell cycle arrest by inhibiting and the protein expression of CDK. Their flow cytometry data showed that the drug reduced the ratio of G0/G1 cells, failed to pass the G2/M phase checkpoint, leading to cell arrest in G2/M phase.
In our study, fenofibrate didn’t act on THLE-2 cells. First, this is due to the high expression of cyclin and kinases in tumor cells. When cells suffer DNA damage in the G2 phase, the G2 DNA damage checkpoint inhibits the activity of the cell cycle complex and prevents entry into mitosis. CDK2, CyclinD1 and PCNA are overexpressed in cancer cells, 33 which may form a complex with kinases, initiate mitosis, and cross cell cycle checkpoints, leading to uncontrolled cell proliferation. Secondly, tumor cells and normal cells have different sensitivity to drugs. There are some articles that study the different effects of drugs on tumor cells and normal cells. 34,35 Third, PPARα may be involved in regulating the viability and proliferation of cancer cells, 36 when forced to overexpress PPARα, it will promote cell proliferation and reverse cell senescence. At the same time, the expression of PPARα is relatively low in normal cells. Last, SMMC-7721 cells in our study were more sensitive to fenofibrate. As shown in the figure below, we did a WB experiment to study the expression of PPARα in SMMC-7721 cells and THLE-2 cells after adding fenofibrate (10−4 mol/L). The results show that PPARα expression in tumor cells is higher than normal cells, at the same time, fenofibrate is more sensitive to SMMC-7721 cells. Compared with acting on THLE-2 cells, fenofibrate stimulates the high expression of PPARα in SMMC-7721 cells.
Dyslipidemia and atherosclerosis are the main causes of the occurrence and death of type 2 diabetes. 37 In the past few decades, fenofibrate and other fibrates have been widely used as therapeutic drugs. 38,39 Fenofibrate is a PPARα agonist, and the activation of PPARα can reduce serum triglyceride and cholesterol levels. 40 Through our in vitro experiments, we found that fenofibrate promoted tumor cell proliferation by promoting cell cycle progression. The use of PPARα inhibitor MT886 inhibited cell cycle progression and promote tumor cell apoptosis. This reveals that PPARα receptors may play an important role in tumor cell proliferation. Therefore, when using fenofibrate to treat type 2 diabetes patients, pay special attention to the dosage of the drug. If the type 2 diabetes patient is also a liver cancer patient, using fenofibrate to treat type 2 diabetes will aggravate the condition, cause cancer proliferation and deterioration. This will provide references for clinical rational use of drugs.
Although the exact molecular mechanism of how fenofibrate affects liver cancer cells still need to be studied, these results have revealed the new role of fenofibrate in cell cycle regulation and tumor expansion. Further research will help to clarify the pharmacological effects of fenofibrate more comprehensively, avoid its side effects, and develop safer and more effective strategies for using fenofibrate to treat human diseases.
Highlights
Fenofibrate could obviously induce proliferation of SMMC-7721 cells in normal concentrations, but couldn’t obviously induce proliferation of THLE-2 cells.
Fenofibrate could affect the cell cycle progression by reducing the number of cells in G0/G1 phase and increasing the number of cells in S phase and G2/M phase in SMMC-7721 cells.
The increasing S phase and G2/M phase of cell cycle caused proliferation accelerated in SMMC-7721 cells.
Fenofibrate could promote cell cycle from G0/G1 phase to S phase via increasing the expression of proteins of CyclinD1 and CDK2.
Fenofibrate could increase the number of cells in G2/M phase via increase the expression of proteins of PCNA.
The results of this study provide a new insight for the safety of fenofibrate.
Practical applications
The study of the pharmacological and toxic side effects of fenofibrate is helpful for rational clinical use and avoiding the adverse effects on patients in large doses. This study provides a reasonable explanation and mechanism for the effect of fenofibrate on the proliferation of tumor cells.
Footnotes
Acknowledgment
Many thanks to professor Tao Xu for his guidance and help!
Author contributions
Biao Li and Yong Jin designed, guided and revised this paper. Biao Li wrote this paper, analyzed data, and completed molecule experiment design. Hai-Yan Jiang, B Li, Zhi-Hao Wang completed cell experiments. Biao Li performed PCR and Western Blots. Yu-Chen Ma, Xiang-Yu Zhu, Hong-Guang Xia and Yan-Ni Bao completed the MTT experiment. All authors approved the final manuscript.
Declaration of transparency and scientific rigor
This Declaration acknowledges that this paper adheres to the principles for transparent reporting and scientific rigor of preclinical research recommended by funding agencies, publishers and other organizations engaged with supporting research.
Declaration of conflicting interests
The author(s) declared no potential conflicts of interest with respect to the research, authorship, and/or publication of this article.
Funding
The author(s) disclosed receipt of the following financial support for the research, authorship, and/or publication of this article: The present study was financially supported by Anhui Province Natural Science Foundation (No. 1808085MH235) and Scientific Research Foundation of Institute of Anhui Province Transformational Medicine (No. 2017zhyx32).