
Abstract
Transcriptional factor NRF2 is an emerging tool in reviewing mechanistic behavior of drug-specific injury pathways. Drug-induced liver injury (DILI) represents a major clinical concern that often manifests oxidative stress and cell death. Despite the pivotal role of NRF2 pathway in liver pathologies, it is questioned whether NRF2 activation or regulatory efficiency could be hindered in by the severity of DILI and progression of cell death. In this study, we evaluate NRF2 as a biomarker to DILI in comparison to severity of injury as well as explore stress mediating factors affecting Nrf2 expression. In vivo DILI model was established in C57BL/6 mice by acetaminophen (APAP) at different toxic doses, confirmed by dose-dependent liver pathological changes and accompanied with in vitro time- and dose-dependent depletion of GSH and SOD in isolated primary mouse hepatocytes. Increase in liver NRF2 translocation and cytosolic content was observed in 70 mg/kg APAP-treated mice. At this subtoxic dose, liver Nrf2 transcription was increased in mice by 18.3-fold, a prominent downregulation was seen in ARE (antioxidant response element) genes; Hmox1, Nqo1 and Glcm, and apoptotic Bcl2 regulating genes. In addition, upregulation in necrosis inducer Parp2 was associated to downregulation in Hmgb1. Collectively, expression of genes related to cell survival were regulated at mild APAP hepatotoxicity. By increasing APAP dose, hemorrhagic necrosis and impaired genetic transcription in both Nrf2 and several other genes were evident. In conclusion, NRF2/ARE system and cell death modulation is halted by the increase of chemical stress and found directly associated with DILI severity.
Introduction
The gene nuclear factor erythroid 2-like factor 2 (NRF2 or NFE2L2) is a member of the cap ‘n’ collar (CNC) subfamily of basic leucine zipper (bZIP) protein family regulating expression of antioxidant proteins against oxidative stress. 1 Loss of Nrf2 in unstressed homeostatic conditions leads to compromised cell physiology, as it has been shown to alter glutathione synthesis, cell differentiation, autophagy and many other signaling pathways including reactive oxygen species (ROS)-dependent signal transduction. 2 Cells possess a sophisticated adaptive defense system of enzymatic and non-enzymatic antioxidants that counterbalance overall ROS levels. Amongst these antioxidants are endogenous reduced glutathione (GSH) via nicotinamide pair namely; NADPH (reduced NAD phosphate), enzymes such as glutathione peroxidase (GPx), superoxide dismutase (SOD), and proteins such thioredoxin (TRX) and metallothioneins. In addition to an array of genes encoding detoxifying enzymes and other factors that are promptly activated in oxidant signaling. 3 Any perturbation in the redox homeostasis is often coupled to an activation of a cascade of cytoprotective genes and cellular factors, which are considered as mechanistic markers of the cellular status subsequent to chemical insult. 4
NRF2 is key host defense transcriptional factor of particular importance to the regulation of antioxidant, detoxifying and cytoprotective genes via binding to genes containing common and specific promoter regions, namely antioxidant or electrophile response element (ARE or EpRE). 5 ARE-mediated genes encode antioxidant proteins and enzymes such as Hmox-1 (Heme oxygenase 1), Nqo1 (NAD(P)H dehydrogenase, quinone 1), Gst (glutathione S-transferase) and others that are involved in drug detoxification and counteracting oxidative stress. 6 Such adaptive response has been reported essential in regulating basal and inducible expressions of a battery of encoding genes concerned in redox transport, stress response, ROS catabolism, mitochondrial apoptosis and other oxidant signaling, in addition to a set of drug-metabolizing enzymes (DMEs). 7 Several studies support the fact that Nrf2 activation and its targeted gene modulation is required for regulating hepatic functions including drug metabolism and transport, GSH synthesis and cytoprotective response to oxidative stress and chemical toxicity.7,8 Therefore, activation of NRF2 has been recognized as a key indicator for screening the intrinsic biochemical reactivity to a compound during direct chemical stress.8,9 Furthermore, researchers tend to adopt NRF2-targeting as a chemopreventive and therapeutic tool to enhance its protective cascade.10,11
Chemical and oxidative stress is usually associated with the adverse effects of many compounds, particularly by presence of electrophiles and free radicals that react with cellular macromolecules and disrupt normal redox processes leading to cellular dysfunction or death. 12 In the case of drug-induced liver injury (DILI), acetaminophen (APAP) has been the classical drug of choice to evaluate mechanism-based biomarkers of DILI and several studies reported increased mortality and marked drop in detoxifying biomarkers in Nrf2-dificient study animals exposed to high doses of APAP. 13 APAP-induced liver injury involves generation of a highly reactive electrophile namely, NAPQI (N-acetyl-p-benzoquinone imine), that depletes cellular GSH stores and causes consequent protein adduct formation and oxidative stress. It has been reported that NAPQI adducts impair GSH production and as cells are deprived from its first line of defense, oxidative stress induces the production of ROS and cessation of ATP.14,15
Despite the pivotal role of NRF2/ARE pathway in liver pathologies growing evidences indicate against the use of NRF2 as a sole marker of DILI. 16 The correlation between the signaling pathway and progression of DILI remains elusive. Thus, the current study aimed to re-evaluate Nrf2 as a marker to DILI in comparison to the severity of DILI (low, moderate, severe). As well, some stress sensitive factors affecting Nrf2 expression and cell death were also explored in order to elucidate other factors/pathways that may aid in establishing new makers of DILI. Such approach using multiple response markers might help in establishing a better experimental model to predict cytotoxicity pathways associated with severity of chemical and oxidative stress.
Materials and methods
General animal information
Eight-week-old male C57BL/6 mice (25 ± 4 g; Charles River Laboratories Inc. (Wilmington, MA, USA)) were housed and acclimatized in well ventilated environment under controlled temperatures (22–24°C), humidity (55–65%), and photoperiod cycles (12 light/12 h dark). The selection of C57BL/6 mice was due its reported actions on DILI testing and its confirmed sensitivity to APAP-induced toxicity. 17 All experiments were in accordance with University of Petra Institutional Guidelines on Animal Use which adopt the guidelines of the Federation of European Laboratory Animal Science Association (FELASA). The study protocol was reviewed and approved by the Ethical Committee approval number 2A-2-2019 (10 April 2019), University of Petra (Amman, Jordan).
Primary mouse hepatocyte isolation and cell culture
An adult male C57BL/6 mouse was placed over a surgical platform (Kent Scientific, USA) and anaesthetized by isoflurane (Hikma Pharmaceuticals, Jordan) (5% induction and 2.5% maintenance) carried by oxygen (Dual flow oxygen concentrator, China) using a low-flow anesthesia system (SomnoSuite, Kent Scientific, USA). After reaching the surgical depth of anesthesia, the liver was perfused with collagenase (1000 IU) and isolated as described previously.18,19 Briefly, a 24-gauge butterfly cannula was surgically inserted into the portal vein. Pre-warmed perfusion buffer was infused at a flow rate of 3 ml/min for 20 min and until the liver had blanched to light-brown and all lobes begun to swell. Infusion rate was then decreased to 4 ml/min and perfusion buffer was switched to another buffer containing collagenase for another 20 min. Once the liver turned mushy, it was then dissected and soaked in cooled liver collection medium in order to be transferred to the cell culture hood. Buffers and solutions were prepared as previously published. 20
Under air laminar flow within the cell culture hood, liver cells were dispersed gently using sterile cell scrapers in a sterile petri dish within the buffered collection medium. Connective tissues and undigested tissue fragments were removed, and cell suspension was then strained in sterilized 100 µm pore nylon mesh cell strainer (SPL, India) into a conical centrifugation tube and prepared for culture as described by Shen et al.18 Within the cell suspension, cells were counted using dye-exclusion assay using 0.4% Trypan blue stain (Thermo Fisher, USA) under light microscope using a hemocytometer (Marienfeld-Superior, Germany). Hepatocytes were plated and allowed to recover for at least 2 h at 37°C in a 5% (v/v) CO2 containing atmosphere.
Extracellular and cytosolic liver GSH and SOD assay
Cultured cells were treated with their corresponding APAP concentrations (2.5, 5, 10 mM) for specific exposure duration.21,22 Cells were collected by centrifugation at 2,000 ×g at 4°C for 10 min and the supernatant (culture medium) within each tube, which represents the extracellular status of each sample, was aspirated for assaying. As for the remaining pellets, 200 µl lysis buffer (20 mM HEPES, pH 7.2 in PBS, 1 mM EDTA, 210 mM mannitol and 70 mM sucrose (VWR, Pennsylvania, USA)) was added and samples were sonicated for 10 s on ice (Qsonica, USA). Thereafter, the suspension was centrifuged at 10,000 ×g at 4°C for 15 min in order to facilitate cell lysis. 23 Determination of GSH and SOD in primary cultured hepatocytes was assessed using colorimetric Glutathione and Superoxide dismutase assay kits (Cayman (USA)) according to the manufacturer’s instructions.
Histopathology and liver collection for gene and protein extracts
Mice were independently acclimatized into four main groups according to their treatments and fasted overnight with free access to water prior treatment. Mice received their corresponding treatment as follows; a control receiving a vehicle composed of 0.5% carboxymethylcellulose (CMC), three other groups receiving different doses of APAP. APAP doses were calculated starting with a dose slightly above the maximum recommended human dose (4000 mg/70 kg adult) specifically 70 mg/kg (1×; mild toxicity), and two high toxic doses often used throughout the literature, specifically 350 and 700 mg/kg (5× and 10×; moderate and severe toxicity models).24,25 Both APAP and CMC were obtained from Sigma-Aldrich, Germany.
For obtaining liver samples for histopathology, 24 adult male mice were assigned to four groups (n = 6) receiving their corresponding treatments. After 6 h from treatment, mice were euthanized by cervical dislocation, necropsied and liver specimens were dissected and preserved in 10% buffered formalin at 4°C until further processed. Biopsies were later sectioned and stained with hematoxylin and eosin (H&E) then slides were compared under light microscopy (Optika B-190 Series, Bergamo, Italy) at magnification of (×40). 26
Liver tissue homogenates for gene and protein extractions were freshly prepared from 48 mice that were assigned to four groups as formerly mentioned (n = 12). At each time interval namely; 0.25, 0.5, 1 and 2 h post treatment, mice (n = 3/interval/group) were euthanized by cervical dislocation and liver samples were promptly collected. Autopsies from right and left lateral liver lobes were collected, weighed and rinsed in ice cold saline for immediate extraction processing.
Cytosolic and nuclear NRF2 fraction determination
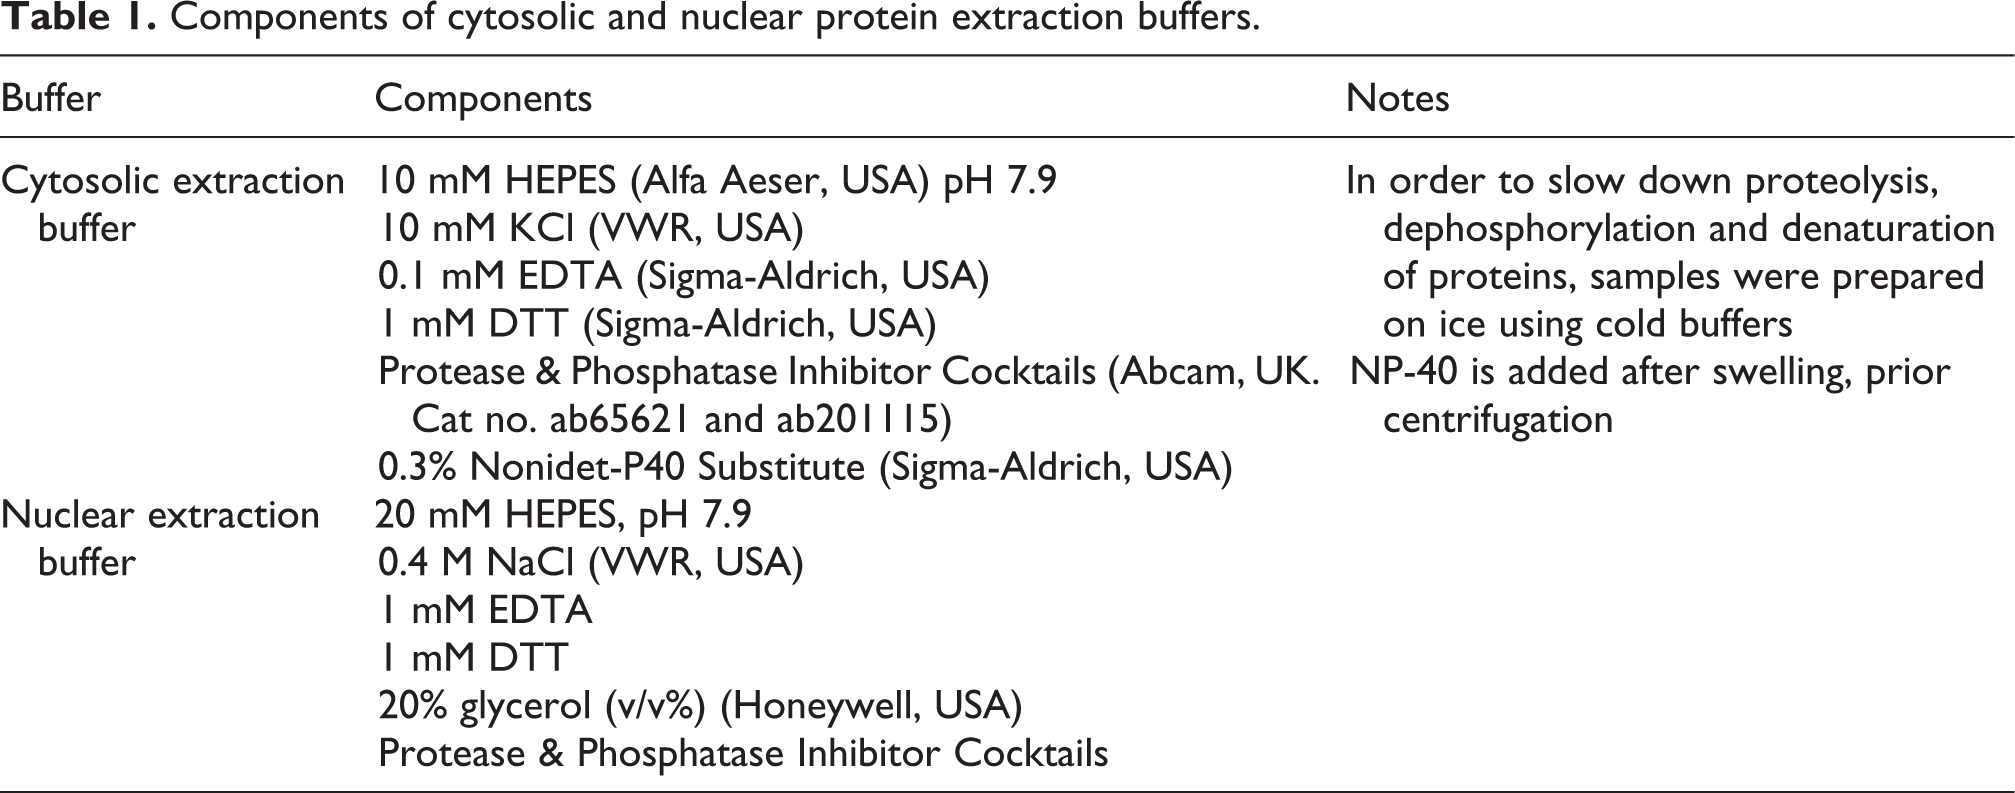
Liver samples excised from the right lateral lobe were immediately homogenized physically between two glass slides under aseptic conditions. Tissue samples (about 5 mg) were then soaked in 300 µl ice cold cytosolic extraction buffer (Table 1) and agitated for 2 h at 4°C to allow swelling of cells. Swelled cells were centrifuged for 20 min at 16,000 ×g at 4°C in order to aspirate the supernatant composing the cytosolic extract. The remaining pellet was suspended in 100 µl ice cold nuclear extraction buffer and left to swell in same conditions as preceded. Later, samples were centrifuged for 5 min at 22,000 ×g at 4°C in order to aspirate the supernatant composing the nuclear extract. Extracts of cytosolic and nuclear protein fractions were quantified using micro-Bradford assay method through Pierce Coomassie Plus (Bradford) Assay Kit (Cat. 23236, Thermo Fisher Scientific, USA) as per the manufacturer’s instructions and reserved as aliquots in −80°C until examination. Determination of cytosolic and nuclear fractions of NRF2 in cellular extracts was assessed using colorimetric Mouse NRF2 ELISA Kit purchased from Novus Biologicals (USA) and performed as per the manufacturer’s instructions.
Components of cytosolic and nuclear protein extraction buffers.
RNA isolation and quantitative polymerase chain reaction
For each time interval, a pool of isolated biopsies obtained from left lateral liver lobes of three mice were equally weighed and homogenized by mincing. Pooled liver homogenates were proceeded with RNA extraction using RNeasy Mini Kit (QIAGEN, Germany) as per manufacturer’s recommended procedure. Extracted RNA samples were further quantified by UV-Vis spectrophotometer using NanoDrop 2000c (Thermo Scientific, USA) to assess integrity and purity of RNA. Absorbance was measured at 260 nm (A260) to determine RNA concentrations, and ratios of A260/A280 and A260/A230 were calculated to determine protein and salt impurities, respectively. Ratios approximate to 2.0 for protein and 2.0–2.2 for salt impurities were accepted during sample quality checks. In order to further observe RNA integrity, samples were loaded into a 2% agarose gel (LE Agarose Multi-Purpose, Cleaver Scientific Ltd, UK) in 1× Tris Borate EDTA (TBE) buffer (Bio Basic Canada Inc, Canada) validated and prepared as Rio et al. (2010) 27 . A 100 base pair DNA ladder (Bio-Helix, Taiwan) was loaded along with study sample RNAs mixed with gel loading dye (New England BioLabs, UK) into wells of horizontal gel electrophoresis tank (multiSUB Midi, Cleaver Scientific Ltd, UK) on voltage set at 120 V for 30 min (nanoPAC-300, Cleaver Scientific Ltd, UK). Gel was imaged using Gel Documenting System Gel Doc EZ Imager (BIO-RAD, USA). The staining intensity of the major ribosomal RNA (rRNA) bands and any degradation products were observed. The criteria of accepting RNA samples were assessed by sample visualization and density on the gel. 28 Samples were aseptically normalized using nuclease-free (NF) water (Ambion, USA) and preserved at −20°C for further analysis.
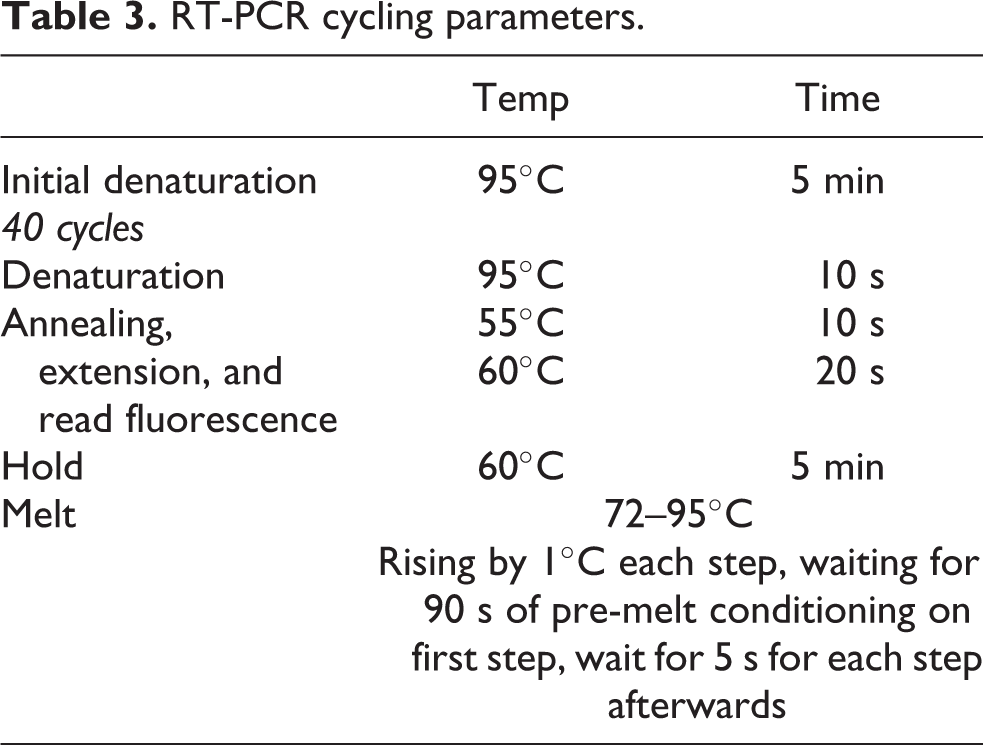
Total RNA samples were used to reverse transcribe a complementary DNA (cDNA) using High-Capacity cDNA Reverse Transcription Kit (Thermo Fisher Scientific, USA) in Bioer GeneQ thermal cycler (China), prepared and programmed as per manufacturer’s instructions. The synthesized cDNA was then amplified implementing real-time PCR and performed by using SYBR Green master mix (Luna Universal qPCR Master Mix, New England Biolabs, UK). using Rotor-Gene Q (QIAGEN, Germany). The recipe per sample was as follows: 10 µl Mastermix, 6 µl NF water, 0.8 μg/ml cDNA sample and 1 µl from each corresponding primer. The 20 µl RT-PCR samples were prepared, loaded in triplicates in PCR strip-tubes in 72-well rotor disc, locked and placed in real-time PCR cycler (Rotor-Gene Q, QIAGEN, Germany). Primers sequences used in this study is presented in Table 2 at cycling parameters set as shown in Table 3. Initially, samples were obtained from mice at each time interval and analyzed for gene expression of two key cell stress regulators, specifically Nrf2 and Hmgb1. Such approach was intended to narrow down and determine the efficient time point of response. RT-PCR analysis was performed on samples and normalized to β-actin as a housekeeping gene.
Primers for amplification of cDNA.

RT-PCR cycling parameters.
The performed PCR reactions were calculated using Rotor-GeneQ Pure Detection Series Software (Version 1., Build 94; 5-Plex, QIAGEN, Germany) and the Threshold cycle (CT) method, namely 2−ΔΔCT method was used to analyses the fold-change amplification data. 29 CT was selected in regard to the optimal efficiency of amplification (∼2.00) as previously described. 30 For all RT-PCR readings, gene induction or repression as measured by their mRNA level were considered as real if above four-folds.
Quantitaitve RT2 profiler polymerase chain reaction array
In order to evaluate genes linked to oxidative stress and cell death, described in Table 4, analysis of several pathways and gene expressions was performed using Mouse Molecular Toxicology PathwayFinder RT2 Profiler PCR Array (Cat no. PAMM-401Z, QIAGEN, Hilden, Germany). This array was designed to quantitatively profile expression of pathway-focused genes comprising five housekeeping (reference) genes; β-actin (Actnb), Beta-2 microglobulin (B2m), Gapdh, Glucuronidase beta (Gusb) and Heat shock protein 90 alpha class B member 1 (Hsp90ab1). In addition, each array contains a panel of proprietary controls to monitor genomic DNA contamination (GDC); Mouse Genomic DNA Contamination (MGDC) as well as the first strand synthesis Reverse Transcription Control (RTC) and real-time PCR efficiency Positive PCR Control (PPC).
Quantitative RT2 profiler PCR array study genes.

Selected previously extracted pooled purified RNA samples were reverse transcribed using RT2 First Strand Kit (Qiagen, Germany) as per the protocol and amplified using RT2 SYBR Green ROX FAST Mastermix (both from QIAGEN, Germany). The array was sealed with the Rotor-Disc Heat Sealer (QIAGEN, Germany) carefully according to the manufacturer’s instructions. Then, the array was placed in Rotor-Disc 100 Rotor, secured and placed in Rotor-Gene Q thermal cycler and run through cycling conditions recommended by the manufacturer and presented in Table 4. Threshold cycle (CT) values were automatically calculated using Rotor-GeneQ Pure Detection Series Software set and ensured consistent amongst runs in the same analysis. A dissociation (melting) curve analysis was performed to verify PCR specificity. Raw values of CT were exported to Excel spreadsheet and uploaded to QIAGEN’s GeneGlobe Data Analysis Center (http://www.qiagen.com/geneglobe)in order to conduct data analysis using a software-based tool.
The quantitative (relative) gene expression was determined using the ΔΔCT method with normalization of the raw data to the housekeeping gene, after running and analyzing the array data simultaneously. CT values were normalized against the arithmetic mean of housekeeping gene Actnb. Fold-change was calculated using 2-ΔΔCT formula.
Statistical analysis
One-way ANOVA followed by post-hoc Tukey’s HSD test was performed using IBM SPSS Statistics 25, IBM Corporation (New York, USA) to calculate the statistical significance of the results reported. Values with p-value less than 0.05 were considered significant. Values are presented as mean ± standard error of mean (SEM).
Results
Depletion of GSH levels in primary mouse hepatocytes
Different concentrations (2.5, 5, 10 mM) of APAP were given to primary mouse hepatocytes and left for specific incubation periods (1, 2, 4 h). Since APAP toxicity is initiated by the depletion of scavenger GSH, levels of cytosolic GSH in the primary cultured hepatocytes were determined. GSH levels were found released from stores at the lowest concentration used (5 mM APAP) demonstrated by increased GSH levels in cytosolic lysate (Figure 1(a)). The levels of GSH in the cytosol were gradually decreased possibly scavenged by the toxic metabolites of APAP, namely NAPQI. Moreover, depletion was significant at the highest concentration of APAP (10 mM) (p < 0.05), as shown in Figure 1(a). On the other hand, analysis of the extracellular cell deposit of GSH in primary hepatocytes, showed a dose-dependent depletion in GSH levels during the first hour of APAP exposure (Figure 1(b)). Moreover, after 4 h of incubation with APAP (2.5, 5 mM) GSH levels were significantly dropped to baseline, similar to control levels. Prompt uptake of released GSH levels in the extracellular matrix of primary mouse hepatocytes was observed diminished to baseline levels after APAP treatment (10 mM).
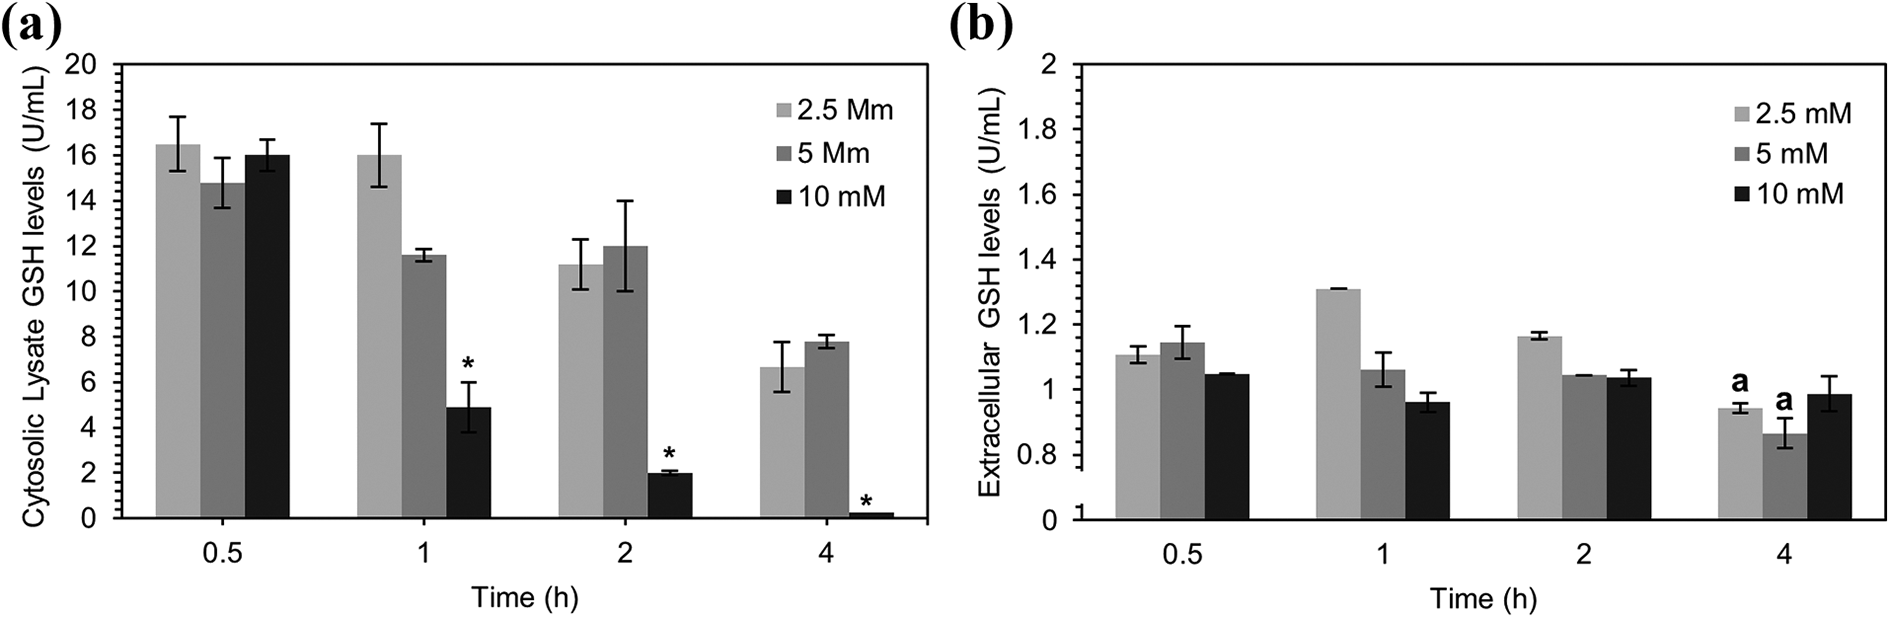
Determination of cytosolic (a) and extracellular (b) GSH levels in isolated mouse primary hepatocytes cytosolic GSH levels was observed between control cells and doses levels (p < 0.05). aSignificant difference treated with different concentrations of APAP. Values are normalized to control. *Significant difference in For Peer Review in depletion of GSH in comparison to earlier time points (p < 0.01). Each data point presents mean ± SEM (n = 3).
Increase of SOD levels in primary mouse hepatocytes
Dose-dependent increase in extracellular SOD was observed in hepatocytes treated with different concentrations of APAP (2.5, 5, 10 mM). The difference in influence between the lowest and the highest concentration was significant at short exposure durations, specifically during the first hour of APAP exposure. Following the exposure of hepatocytes to the lowest APAP concentration at least a three-fold increase in SOD was observed (p < 0.05) as shown in Figure 2. Such increase in SOD level was dose-dependent, nevertheless, gradual depletion of SOD was proportional to the prolongation of exposure duration. Such event is accounted to the formation of SOD after employing a toxin to primary cultured mouse hepatocytes to combat arising oxidative stress.

Determination of extracellular SOD levels in isolated mouse primary hepatocytes treated with different concentrations of APAP. aSignificant difference between 5 mM and 10 mM (p < 0.05); bSignificant difference between 5 mM and 10 mM (p < 0.01); **Significant SOD levels in both high concentrations of APAP, 5 and 10 mM at time points of 0.5, 1 and 2 h (p < 0.01). Each data point presents mean ± SEM (n = 3).
Dose-dependent hepatocellular necrosis
Histological evaluation of mice liver biopsies indicated morphological changes in liver tissue of APAP-treated mice (Figure 3(a)). Microscopic examination of the control liver had normal structure, compactly arranged hepatocytes and uniform morphology along with central vein (CV). In mice treated with 70 mg/kg APAP, inflammatory infiltration was evident which is indicative of apoptotic cell death.31,32 Conversely, liver areas of hemorrhage were initially observed in liver sections of mice treated with 350 mg/kg APAP and progressed massively in liver sections of mice treated with the higher APAP dose (700 mg/kg), indicating necrotic action of APAP. 33 Macroscopically, liver specimens treated with 700 mg/kg APAP dose appeared darker to the sight during gross inspection.

Representative liver sections stained with hematoxylin and eosin (40×). (a) Control hepatocytes with normal structure; Liver of mice treated with APAP 70 mg/kg after 6 h from administration showing apoptosis/single cell necrosis, inflammatory infiltration (dashed arrow), hepatocyte vacuolization; APAP 350 mg/kg treated sample showing cell swelling, mild centrilobular and periportal necrosis, in addition to mild coagulative necrosis; APAP 700 mg/kg treated marked confluent hepatocellular necrosis with associated hemorrhage and sinusoidal congestion (arrow). (b) Shows a Scatter Plot that compares the normalized expression of every gene on the PCR Array between the control group and APAP (A: 70; B: 350; C: 700 mg/kg) by plotting them against one another to quickly visualize large gene expression changes. The center diagonal line indicates unchanged gene expression, while the outer diagonal lines indicate the selected fold-regulation threshold. Genes with data points beyond the outer lines in the upper left and lower right corners are upregulated or downregulated, respectively, by more than the fold-regulation threshold in the APAP (A: 70; B: 350; C: 700 mg/kg) group relative to control group. Generated scatter plot shows graphical representation of Log10(normalized expression of control group) verses Log10 (normalized expression of APAP (70; 350; 700 mg/kg)). (c) Liver mRNA expression of key encoding genes of three main pathways in of C57BL/6 mice treated with three dose levels of APAP normalized to Actnb as reference amplicon. *Fold regulation higher than 4 were considered significant. Both b and c indicated by gene symbols, Bcl2 indicates B-cell leukemia/lymphoma 2; Bcl2l(xL), Bcl2l1-XL: Bcl2-like 1; Casp8, Caspase 8; Casp9, Caspase 9; Fasl, Fas ligand (TNF superfamily, member 6); Gclm, Glutamate-cysteine ligase, modifier subunit; Grb2, Growth factor receptor bound protein 2; Hmox1, Heme oxygenase (decycling) 1; Ncoa7, Nuclear receptor coactivator 7; Nqo1, NAD(P)H dehydrogenase, quinone 1; Parp2, Poly (ADP-ribose) polymerase family, member 2.
Stress-induced Nrf2 activation and downregulation of Hmgb1
In order to determine the time point at which genes present a genetic response translated as gene amplification, Nrf2 and Hmgb1 genes were amplified in liver tissue samples after multiple exposure durations (0.25, 0.5, 1, 2 h). A delay in Nrf2 and Hmgb1 gene transcription in all dose-levels was observed as seen in considerable fold-regulation was not observed until 2 h from APAP exposure. Treatment with APAP 70 mg/kg for 2 h significantly induced expression of the transcriptional factor Nrf2, upregulating it by 18.3 folds in comparison with the control, despite insignificant changes observed at shorter exposure durations. Treatment with doses higher than 70 mg/kg namely; 350 and 700 mg/kg, expressed insignificant and inconsistent changes in Nrf2 gene regulation (Figure 4(a)). The expression of the pro-regenerative redox-sensitive biomarker namely; Hmgb1, was significantly downregulated in liver samples treated with APAP 350 mg/kg for 2 h by 60.1 folds compared to control. However, at time intervals less than 2 h, downregulation was observed in mice treated with the lowest APAP dose (70 mg/kg). Furthermore, neglected fold-change of mRNA Hmgb1 was calculated for mice treated with 700 mg/kg despite the duration of exposure (Figure 4(b)).
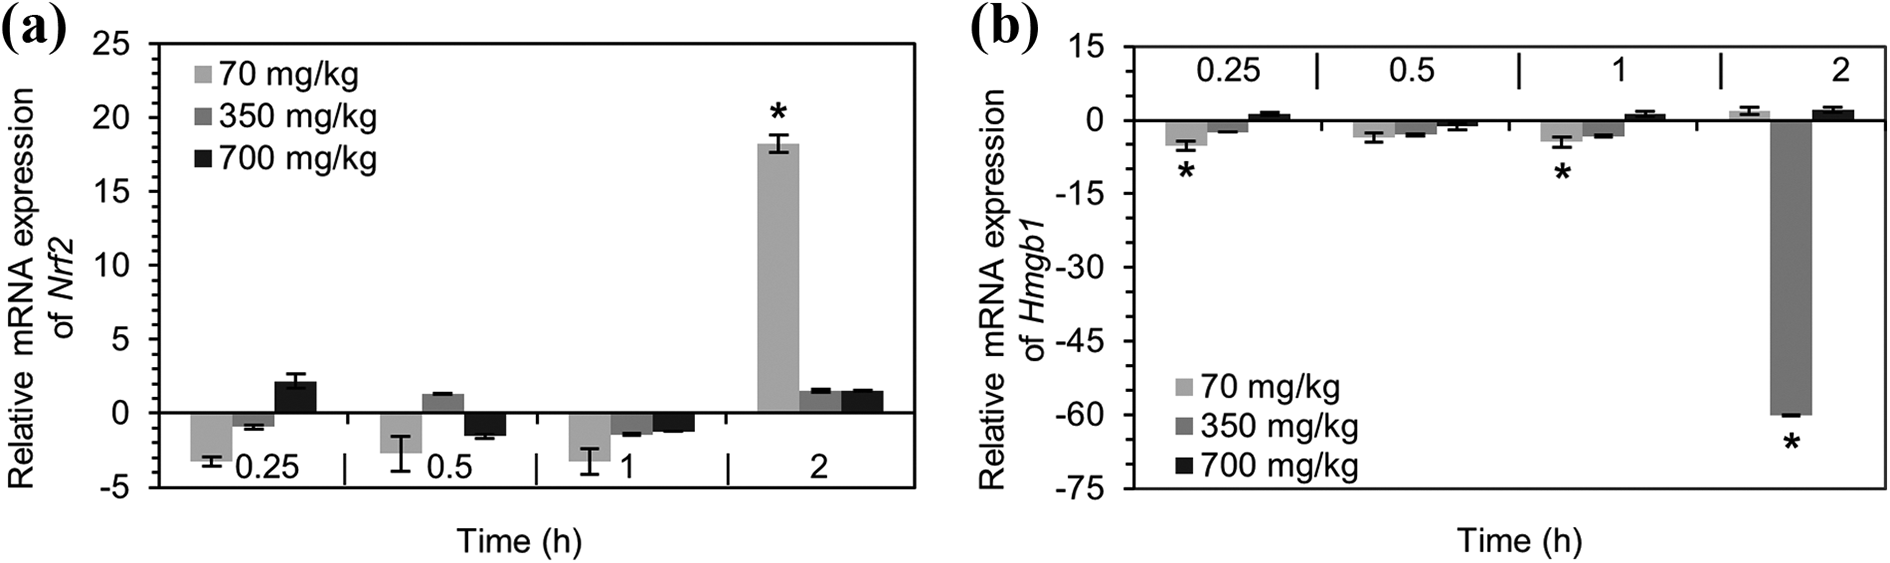
mRNA expression of Nrf2 (a) and Hmgb1 (b) in pooled samples of C57 mice treated with APAP dose levels (70, 350, 700 mg/kg) at multiple time interval exposure (0.25, 0.5, 1, 2 h). Results are expressed as Figure 4 Fold-regulation normalized to β-actin ± SEM (n ≥ 3). *Fold regulation higher than 4 were considered significant. Nrf2: nuclear factor erythroid 2-like factor 2; Hmgb1: high mobility group box-1 protein.
Gene expression profiles in DILI and high dose-induced cell death and transcriptional dysfunction
Profiled by quantitative PCR, liver tissue of mice exposed to APAP doses for 2 h were run. Study genes showed a capacity of amplification and change in gene fold-regulation after administrating mice with APAP (70, 300 mg/kg). However, lack of gene expression was noticed after employing high dose APAP (700 mg/kg) (Figure 3(b) and (c)). As indicated by morphological changes (Figure 3(a)), increase in APAP dose-induced necrotic cell death in liver tissue which is molecularly reflected by dysfunction of the nucleic encoding, thus, accounting the loss of gene expression to development of necrosis. Normalized to the housekeeping gene, namely Actnb, change in regulation of several genes was observed in mRNA samples of mice treated with 70 mg/kg APAP (Figure 3(b) and (c)). Amongst the mouse molecular toxicology pathway focused genes in the utilized array, 11 genes related to oxidative stress, apoptotic and necrotic cell death were downregulated including NRF2 target genes namely; Hmox1, Nqo1 and GSH modulator Gclm. Furthermore, reduction in expression of the apoptosis regulators Bcl2 and Bcl2-xL, in addition to the apoptosis executioner gene, Casp-9 was evident (Figure 3(c)).
mRNA levels of genes encoding for cellular toxicity pathways affected by APAP 350 and 700 mg/kg were found regressed and changes were considered insignificant for most of the genes (Figure 3(b) and (c)). Furthermore, mRNA samples of mice treated with 350 mg/kg APAP presented further decrease in Bcl2-xL fold-regulation and upregulation in stress-inducing Parp2 gene. Death domain ligand Fasl was found significantly upregulated (7.2 folds) in comparison with its changes in groups treated with 70 and 350 mg/kg (−3.9, + 3.5 folds, respectively) (Figure 3(c)).
Translocation of NRF2 into the Nucleus
Since NRF2 is activated and released from the cytosol into the nucleus in response to toxic stimuli, fractions of cytosolic and nuclear extracts were subjected to determination whether NRF2 translocated into the nucleus or remained localized in the cytosol. Translocation of NRF2 into the nucleus was evident in liver tissue homogenates of mice treated with all three doses of APAP, as seen in Figure 5(a). The highest translocation ratio was significantly calculated in mice treated with the 350 mg/kg APAP dose. Although insignificant, cytosolic levels of liver NRF2 in mice liver with 70 mg/kg APAP were restored at 2 h time point to levels higher than the control (Figure 5(b)). In comparison to ratio between Figure 5(a) and (b), cytosolic levels of groups treated with 350 and 700 mg/kg showed opposing quantities despite the claimed high ratio seen at 2 h time point.

Nuclear to cytosolic ratio of NRF2 (a) and cytosolic levels (b) of NRF2 in liver lysates of C57/BL6 mice group, 100% presents control levels. *Significant to control (p < 0.05). aSignificant to mean of 70 mg/kg treated with APAP dose levels assessed at different time points. Data are normalized to values of control For Peer Review APAP-treated mice (p < 0.05). bSignificant to 700 mg/kg APAP treated mice liver (p < 0.05). Each data point presents mean ± SEM (n ≥ 3).
Discussion
The general understanding of the toxicodynamics of cellular stress response pathway activation in DILI is limited. Herein, the toxicant-specific alterations in NRF2/ARE signaling and cell death responsive genes and its association to severity of DILI was investigated. Selection of robust biomarker genes linked to NRF2 system or stress-responsive genes crosslinking with the former is critical for understanding the cytoprotective network and preclinical risk prediction of deleterious progression upon chemical stress. In the current study, findings suggest that activation of Nrf2 does not necessarily alter the expression levels of some NRF2-target genes. Moreover, a complex network of other transcriptional factors and cellular signaling may render the activation of different subsets of encoding genes.
Through in vivo administration of three dose levels of APAP in C57/BL6, DILI was confirmed by classical changes observed by liver microscopic examination which showed hepatocyte vacuolization and swelling in liver sections of mice treated with 70 mg/kg APAP. 33 Areas of hemorrhage were initially observed in liver sections of mice treated with 350 mg/kg APAP and progressed massively in liver sections of mice treated with the higher APAP dose (700 mg/kg) (Figure 3(a)). Furthermore, focally congested sinusoids observed in liver sections of mice treated with 350 mg/kg APAP have developed to extensive confluent sinusoidal bleeding in liver of mice treated with 700 mg/kg APAP. Such morphological outcome is often associated with necrosis, 34 thus, progression of necrosis manifests centrilobular necrosis that further develops confluent necrosis. 35 Beyond pathological toxicity, reduction of GSH depletion through time with increased concentrations of APAP could be attributed to the uptake and scavenge of GSH by APAP metabolite, most importantly NAPQI. Furthermore, depletion of in vitro GSH stores was accompanied with reduced mRNA expression of Gclm, which transcribes for a rate-limiting enzyme that regulates GSH synthesis. 36 Assuring the fundamental role of SOD by being at first line defense antioxidant, besides to GSH, attenuating APAP-induced lipid peroxidation, 37 an initial increase of 300–650% in SOD levels was observed in hepatocytes soon after exposure to APAP which however gradually diminished as exposure time increased (Figure 2).
In line to what has been reported in the literature, depletion in protein levels of NRF2 is a response to diminishing GSH exposure to APAP. The current investigation confirmed translocation of NRF2 into the nucleus as soon as 15 min after exposure to APAP, which persisted in mild toxicity. As explained by, 6 the uptake of NRF2 cytosolic stores mirrors a positive feedback signaling to its transcribing gene as seen in Figures 4(a) and 5(b) where Nrf2 expression increased after 2 h from toxicity, thus, ensured restoration of cytosolic NRF2 stores. The vital role of NRF2 is established through its labor from Keap1 enzyme and activation by translocating into the nucleus to induce transcription of antioxidant and cell survival genes. 38 Translocation of NRF2 into the nucleus was evident in livers of mice treated with the three APAP doses, however, consistency in uptake and translocation of NRF2 ratio was not observed in doses which accumulated aggressive toxicity after exposure to APAP. Such result might most likely indicate expel of the nuclear content due to development of necrosis. 39
Administration of 70 mg/kg APAP increased mRNA levels of Nrf2 to 18.2 folds and downregulated genes mediating cellular response to toxic conditions (Figure 4(a)) In the current study, along to the increased expressions of Nrf2 and decreased Nqo1 and Ncoa7 expression was observed which comes in line with a recent study which reported downregulation of some NRF2-target genes including Nqo1 despite the increased Nrf2 expression in C57BL/6 mice treated with non-lethal APAP dose. The study concluded this downregulation as mediated by activation of JNK pathway which plays a vital role in the susceptibility of models to APAP toxicity. 40 It has been also reported that administration of toxic APAP doses to Nrf2-null mice generates electrophilic stress and subsequently increases levels of hepatic NQO1 and GCLC. 41 Deprivation from NQO1 associates depletion of ATP levels, therefore, cells tend to develop ATP-independent cell death, specifically necrosis which was confirmed in the current study. In addition, NQO1 induces formation of cell death inducing factors including endonucleases, cytochrome c and others that are linked to mitochondrial dysfunction. 42 As for the modulating gene namely, Ncoa7, it is mostly reported affecting processes in the nervous system. 43 However, Nair et al. suggested potential role of Ncoa7 in the ability of NRF2 to crosstalk with AP-1, a redox-sensitive transcriptional factor as linked to apoptosis,44,45 yet further studies are required to determined its involvement in NRF2 and DILI.
Furthermore, NRF2 is responsible for activating Bcl2-xL expression which is responsible of attenuating cell death executioners including BAX and caspases. 46 Such event was confirmed in the current results (Figure 3(c)) as expression of Bcl2-xL was found downregulated in mice treated with 70 and 350 mg/kg. The former has been linked to the capacity of NRF2 in protecting hepatocytes from Fas-induced apoptosis and reduced DNA as NRF2 has been long reported to regulate the sensitivity of death receptor Fas via affecting intracellular GSH levels, as discussed by. 47 In the current investigation, upregulation of Fasl was evident subsequent to the increase of APAP dose to 350 mg/kg. As mentioned in the literature, Fasl is expressed by Kupffer cells, the liver resident macrophages, 48 and in cases of apoptotic body formation, signaling of phagocytosis through Kupffer cells is activated. 49 Thus, the increased expression of Fasl might be a response mechanism of response to the accumulated apoptotic bodies at high APAP doses.
Interestingly, current results showed significant changes in Nrf2 occurring at the lowest dosage of APAP at the 2 h time point, moreover, changes in Hmgb1 expression were seen with the middle dose at the same time point. Together these events suggest that former genes are not necessarily triggered simultaneously at the same cytotoxic circumstances. However, the expression of Nrf2 and its response mechanisms might be upregulated in apoptotic cell death to combat the oxidative stress, whereas for Hmgb1, explanations on its toxic process and targeted cells are not fully clarified in the literature. HMGB1 was claimed as both a nuclear pro-inflammatory factor and a secreted protein autophagy sensor in oxidative stress, that is passively released from cells undergoing secondary necrosis following apoptosis. However, apoptotic cells do not release HMGB1 as they fail to promote inflammation. 50 Recently, HMGB1 has been confirmed to amplify hepatocyte necrosis and thus excreted by APAP-stressed cells. 22 Collectively, in vivo APAP-treated liver (350 mg/kg) seem to strive in inhibiting pro-necrotic actions, contributed by HMGB1, through negative feedback suppression of its encoding gene, thus, attenuate further progression of stress-induced necrosis in hepatocytes.
In line with in a study by Goldring et al., induction of NRF2-downstream genes including its encoding gene was only observed at doses of APAP which causes mild hepatotoxicity while higher doses did not induce mRNA levels of such genes suggesting severe degeneration and necrosis impaired mRNA synthesis, 51 as seen in Figure 3. Nevertheless, most of gene expressions regressed to assemble minimal change in fold-regulation after administration of 350 and 700 mg/kg APAP doses as determined by quantitative PCR profiling. Such observation might be accounted in part to dysfunction in hepatic mRNA due to the progression of necrotic cell death as well as PARP and Fasl-mediated DNA damage and loss in gene transcription in necrotic hepatocytes.49,52 At aggressive stressing in DILI, Nrf2 exhibited low constitutive expression and suppression in cytoprotective genes profile mediating molecular toxicology response following APAP treatment. Such responses could be summed by the toxic effect of APAP on the liver including diminished hepatic GSH stores, consequent oxidative stress, overlapping of other signaling pathways and development of necrosis which yield impaired genetic transcription.
Conclusion
In summary, the transcriptional factor NRF2 is well-known to activate a battery of cytoprotective genes that act in chemical and oxidative stresses. Its activation could be hindered in by the severity of toxicity and influenced negatively through cell death signaling. The correlation between NRF2/ARE signaling and cell death modulation is halted by the increase of chemical stress. Thus, the study merits further evaluation of pivotal genes involved in regulating cell death processes and pathways to understand the mechanisms behind such dysfunction of NRF2 signaling. Furthermore, results imply that NRF2 system activation is responsive in mild toxicity whereas its dysfunction could be adopted as a toxicity marker after employing supratoxic doses. Such, can be applied to enhance safety profiling and toxicity prediction of drugs especially when oxidative stress is provoked.
Footnotes
Declaration of conflicting interests
The author(s) declared no potential conflicts of interest with respect to the research, authorship, and/or publication of this article.
Funding
The author(s) disclosed receipt of the following financial support for the research, authorship, and/or publication of this article: Deanship of Scientific Research, University of Petra, Amman, Jordan (grant number 11/4/2019).