
Abstract
Phytochemical composition and antioxidant activity of flowers decoction at post-flowering stage (F3D) of Opuntia dejecta were determined. The obtained findings demonstrate that F3D has a marked antioxidant activity in all tested assays. Furthermore, the present study was designed to test the protective activity of F3D against induced Diabetes type 2 (DT2) in male rats. Those metabolic syndromes were induced by a high-fructose diet (HFD) (10% fructose solution) for a period of 20 weeks. F3D was administered orally (100 and 300 mg/kg body weight) daily for the last 4 weeks. Metformin (150 mg/kg body weight) was used as a standard drug and administrated orally for the last 4 weeks. The results showed a significant increase in blood glucose, triglycerides and hepatic markers (ALAT, ASAT and ALK-P) in HFD group. A significant increase in hepatic TBARS and a significant decrease in SOD, CAT and GPX were observed in fructose fed rats compared to control group. Administration of F3D showed a protective effect in biochemical and oxidative stress parameters measured in this study. Also, oral administration of F3D restored the histological architecture of rat liver in comparison with rats fed HFD. In conclusion, F3D attenuated hepatic oxidative stress in fructose-fed rats.
Introduction
During the last years, the prevalence of diabetes mellitus (DM) has increased throughout the world and it is presenting enormous public health issues. DM has been defined as a chronic disease with persistently elevated blood glucose levels, causing many complications such as cardiovascular disease, stroke and chronic kidney disease.1,2 Unfortunately, the total number of patients with diabetes is predicted to achieve 366 million in 2030 with the prevalence of Type 2 Diabetes (DT2) (95% of total existing diabetic cases in the world).3–5
DT2 is characterized by an insulin resistance and a progressive decline in pancreatic β-cells function. 6 The factor that is most commonly involved in the development of DT2 is the excessive intake of fructose which leads to insulin resistance and compensatory hyperinsulinemia responses. 7 The treatment of DT2 is managed by synthetic hypoglycemic agents which produce serious side effects whereas bioactive compounds derived from natural resources are more effective, safe, affordable and acceptable. 4 Thus, many plants have been recommended for the treatment of diabetes. The ethnobotanical information reports about 800 plants that may have anti-diabetic activities. 8 Many medicinal plants have been used in the traditional Indian medicine for their hypoglycemic activities. 9 The Cactus (Opuntia sp.) also known as nopal is native to central Mexico, has long been used in traditional medicine for treating many diseases such as stomach ulcers, renal diseases and diabetes. 10 For instance, the fruits of Opuntia ficus indica have been used for its antiulcerogenic, 11 anti-diabetic 12 and anticancer 13 properties. Furthermore, the flowers have been employed as folk treatment for various medical purposes, including the treatment of hemorrhoid, chronic colitis, digestive system disorders, kidney diseases, abdominal pain, diabetes and diarrhea, 14 the infusion of flowers has been also used in the traditional Italian remedies for its diuretic effect. 15 The chemical composition of flowers differs from one stage of maturation to another. In fact, Cactus flowers pass through different stages of ripening (vegetative, initial flowering, full flowering and post-flowering stages). Previous studies demonstrated that the post-flowering stage of Opuntia microdasys was richer in antioxidant than the other stages. 16 As yet there is no published study on the effect of O. dejecta on DT2 and hepatic oxidative stress in high-fructose-fed rats (HFD). The present study aimed to investigate the antioxidant activity and the protective effect of the flowers decoction of O. dejecta, at post-floral stage (F3D) against induced DT2 hepatotoxicity in male Wistar rats.
Material and methods
Samples
Post-flowering stage flowers (F3D) were collected from the cliff of Monastir (Tunisia) in the last week of June (2015). The flowers were dried under shade, grounded with a Warring blender then reduced to a fine dried powder and mixed to obtain a homogenous sample.
Reagents
2,2-Diphenyl-1-picrylhydrazyl(DPPH), 2,2_-azinobis(3- ethylbenzothiazoline-6-sulphonic acid) diammonium salt (ABTS), Folin–Ciocalteu’s reagent and gallic acid were purchased from Sigma–Aldrich Co. (St. Louis, France).
Preparation of the decoction
For the preparation of F3D, 100 g of the sample was added to 2 L of distilled water and left to boil for 5 min then left to stand at room temperature for further 5 min. Afterwards, the mixture was filtered through a Whatman filter paper. The obtained decoctions were frozen and lyophilized.
Phytochemical compounds content
Total phenolic content (TPC) of F3D were determined according to Thouri et al. 17 using Folin-Ciocalteu with the gallic acid as a standard. The results were expressed as mg of gallic acid equivalents (GAEs) per 100 g of extract. Total flavonoid content (TFC) was determined also as described by Thouri et al. 17 The absorbance was measured at 510 nm. The results were expressed as mg of (+)-catechin equivalents per g of extract. The content of flavonols was evaluated according to the method of Romani et al. 18 The results were expressed as mg rutin equivalents (RE) per 100 g of extract. For the ortho-benzenediol contents, the content was determined according to Mekni et al. 19 method. Results was expressed as mg hydroxytyrosol equivalents (HE) per 100 g of extract. Total tannin contents were measured according to the method adopted by Thouri et al. 17 The absorbance was measured at 500 nm. The results were expressed as mg of (+)-catechin equivalents per 100 g of extract. Every test was performed in triplicate.
Antioxidant activity
The DPPH, ABTS+ radical scavenging activity and ferric reducing antioxidant power (FRAP) were evaluated according to the method of Thouri et al. 17 The extract concentration providing 50% antioxidant activity or 0.5 of absorbance in reducing power assay (EC50) was calculated by interpolation from the graph of absorbance against extract concentration. Trolox was used as a standard. 17 All the tests were carried out in triplicate.
Regarding the DNA nicking assay, a volume of 2 µL of pGEM®-Tplasmid DNA (0.5 μg/ well) was mixed with 5 µL of the extract at the concentration of 2 mg/mL. The mixture was first incubated at room temperature for 10 min. After this, 10 µL of Fenton’s reagent (3 mmol/L H2O2, 50 μM L-ascorbic acid and 80 μM FeCl3) were added. The obtained mixtures were then incubated for 5 min at 37°C and the DNA was analyzed on 1% (w/v) agarose gel electrophoresis and visualized under ultraviolet light (302 nm). 20
Animals
Male adult Wistar rats (180–200 g) were purchased from Central Pharmacy of Tunis, Tunisia. Animals were kept under standard laboratory conditions (Temperature: 22 ± 1°C and a 12 h dark/12 h light cycle). Water and food were available ad-libitum. All animals were used according to the guidelines of the Tunisian Society for the Care and Use of Laboratory Animals, and the study was approved by the University of Tunisia Ethical Committee (approval number: FST/LNFP/Pro 152,012).
Experimental design
Seven groups of eight Wistar rats were used in this experimentation which were treated as following: Group 1 (control group): Rats fed with standard aliment and drinking water for 20 weeks; Group 2 (diabetic control group): Rats fed HFD (10% fructose solution) for 20 weeks as the negative control. Group 3: Rats fed a HFD for 20 weeks and treated by metformin at 150 mg/kg/day for the last 4 weeks as the positive control group; groups 4 and 5, rats fed a HFD for 20 weeks and orally given F3D (100 and 300 mg/kg orally, once daily respectively) for the last 4 weeks. Groups 6 and 7: Wistar rats fed with standard food and drinking water for 20 weeks and receiving F3D at 100 and 300 mg/kg/day for the last 4 weeks respectively. Every rat’s weight was recorded every week and food weighted daily during the whole experiment period. One day before the end of the experiment, rats were fasted for overnight and then anesthetised. Blood was withdrawn from all rats by cardiac puncture. In order to collect the serum, the blood in empty vacutainer tube was centrifuged at 4000 rpm for 10 min at 4°C. Then, the plasma was collected and biochemical parameters were analyzed.
Oral glucose tolerance test (OGTT)
Overnight-fasted rats from all experimental groups received a dose of 2 g of glucose / kg body weight one day before the end of the experiment. Blood was sampled from the tail vessels of conscious rats as following (t = 0), 30, 60, 90 and 120 min after glucose administration. Glucose level was determined with an Accu-Check Advantage Blood Glucose Monitor.
Serum biochemical measurements
Triglycerides (TG), Total Cholesterol (TC), high-density lipoprotein-cholesterol (HDL-C) Glucose, Total Bilirubin (TB), Alkaline Phosphatase (Alk-P), and liver-function enzymes such as Aspartate Transaminase (AST) and Alanine Transaminase (ALT) were determined in serum by enzymatic methods with an integra automaton (Roche Diagnostics, Mannheim, Germany). Protein content was determined using bovine serum albumin as a standard.
Hepatic markers of oxidative stress
Thiobarbituric acid-reactive substances (TBARS)
TBARS were determined spectrophotometrically based on the reaction between malondialdehyde which was an index of lipid peroxidation and thiobarbituric acid the absorbance of the obtained product was measured at 530 nm and the results were expressed as nmol/mg protein. 21
Glutathione peroxidase activity (GPX)
GPX was performed according to the method of Flohe and Gunzler. 22 This activity was based on the calculation of the decrease in the rate of GSH reduced compared to the nonenzymatic reaction. It is expressed as U/mg protein.
Superoxide dismutase activity (SOD)
The SOD activity was determined by using a spectrophotometric method as described by Aebi. 23 The activity was expressed as U/mg protein.
Catalase activity (CAT)
CAT was done as described by Aebi. 23 The disappearance of the Hydrogen peroxide (H2O2) was controlled kinetically for 1 min at 240 nm. The results were expressed as mmol H2O2/mn/mg protein.
Histological study
Liver was cut and a small portion was fixed in a Bouin’s solution. Then, after dehydratation, it was embedded in paraffin, sectioned, stained with Hematoxylin–Eosin (H&E) and Masson’s Trichrome and examined under a microscope.
Statistical analysis
Results were expressed as mean ± standard deviation (SD). The mean data of different groups were analyzed with one-way analysis of variance (one-way ANOVA) followed by Tukey test. A value of p < 0.05 was considered to be statistically significant.
Results and discussion
Phytochemical content of the decoction of post-flowering stage
Table 1 shows the results of total phenolic content, flavonols and condensed tannins and ortho-benzenediol contents of the decoction of F3D. F3D is a rich source of polyphenols, surpasses the fruits of Black elderberry which is situated in the 10th rage in Polyphenol database.24,25 The flavonol, tannin and ortho-benzenediol contents were also quantified to deepen the phytochemical composition of Opuntia dejecta aqueous flowers extract at post-flowering stage. They are as follow 752.59 ± 0.60 mg RE/100 g of extract, 141.20 ± 0.05 mg CE/100 g of extract and 121.75 ± 0.35 mg HE/100 g of extract. Our results are in accordance with those reported by Ammar et al. 25 and Minhaj et al. 26 who proved the presence of phenolic acids and derivatives and also flavonoids (flavonols and flavones) in the decoction of the post-flowering stage of Opuntia ficus indica. These compounds have been also found in the methanolic extract of the flowers of O. microdasys. 16
Phytochemical content and antioxidant activity of Opuntia dejecta aqueous flowers extract at post-flowering stage.

a mg GAE/100 g extract: mg of Gallic Acid Equivalents (GAE) per 100 g of extract.
b mg CE/100 g extract: mg of catechin equivalents (CE) per 100 g of extract.
c mg RE/100 g extract: mg of rutin equivalents (RE) per 100 g of extract.
d mg CE/100 g extract: mg of catechin equivalents (CE) per 100 g of extract.
e mg HE/100 g extract: mg of hydroxytyrosol equivalents (HE) per 100 g of extract.
EC50: the sample concentration at which 50% of radicals are scavenged or 0.5 of absorbance in reducing power assay; Mean ± SD, n = 3 (The results represent the averages of three different experiments).
The phytochemical content of cactus flowers varies according to the extraction method of Ammar et al. 25 Phytochemicals such as polyphenols compounds (flavonoids, tannins) have been reported to have multiple benefits for the maintenance of health and prevention of diseases. 27 Sabu and Kuttan 28 and Hardoko et al. 29 previously confirmed the antidiabetic activity of green tea polyphenols.
Evaluation of the antioxidant activity
The antioxidant activity was evaluated by three methods: DPPH, ABTS and ferric reducing antioxidant power (FRAP). Table 1 showed that the obtained values of EC50 varied between 1.07 ± 0.05 and 1.46 ± 0.09 mg/mL. It was reported that the antioxidant activity of plants was related to their phytochemical content such as polyphenols, flavonoids and proanthocyanidins. 30 The antioxidant activity of the aqueous extract was probably associated with its content of total phenolic compounds found in the flowers of Opuntia dejecta at post-flowering stage. There is a significant correlation (Table 2) registered between polyphenols content and the antioxidant activity, which seems closely related to these ubiquitous plant compounds. Our results are in accordance with those previously reported by Chahdoura et al. 16 Regarding the DNA nicking assay, Figure 1 shows the DNA damage protecting activity of the decoction of the flowers. Hydroxyl radical generated in reaction mixture by the Fenton reagent is known to cause oxidative induced damaging of DNA strands to yield the open circular form.31,32 Consequently, the mixture of plasmid DNA caused the total degradation of plasmid and the loss of specific band (lane 2), while, the negative control (untreated DNA) (lane1) presents the three forms: the nicked, the linear and the supercoiled DNA. On the other hand, after incubation of the plasmid DNA with the decoction at 2 mg/ml and further exposure to the Fenton reagent, the scission of plasmid DNA was reduced (lane 3). Thus, F3D had the capacity to scavenge the Hydroxyl radicals protecting the pGEM®-Tplasmid DNA.

Protective effect of O. dejecta flowers decoction in DNA Nicking assay. Lane 1: Negative control (PGEM®-TPLASMID DNA); Lane 2: Control (Fenton’s reagent + DNA); Lane 3: decoction (2 mg/mL) + DNA + Fenton’s reagent.
Correlation coefficients of phenolic compounds and the antioxidant activity.
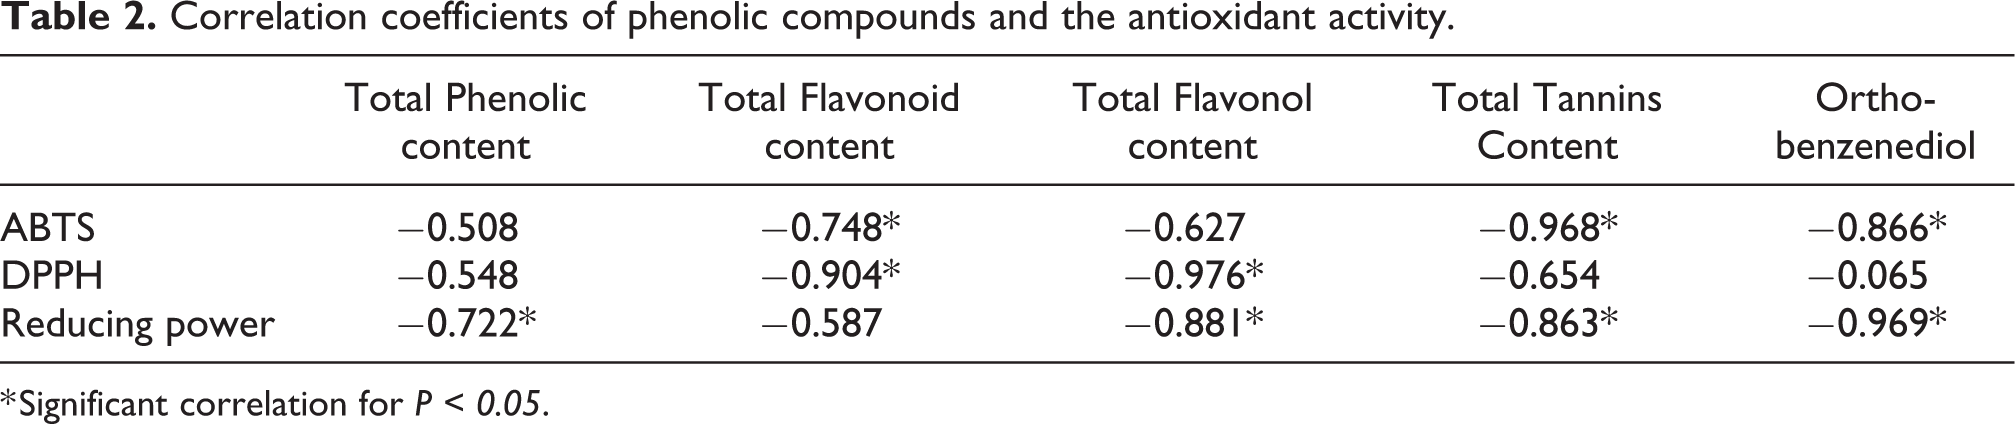
* Significant correlation for P < 0.05.
Blood glucose levels and oral glucose tolerance test (OGTT)
The nutritional disorder is a leading cause of diabetes. For rats receiving HFD, Serum Glucose levels (SGL) were significantly higher than in the control group (Table 3). However, daily administration of F3D (100 and 300 mg/kg) to the HFD animals lowered significantly the SGL and was comparable to the effect of metformin. These results are in agreement with the recent study of Chahdoura et al. 33 which demonstrated the capacity of Opuntia microdasys aqueous flowers extract at post-flowering stage to decrease the levels of glucose. Supplementation of F3D to rats fed normal diet didn’t have any effect on SGL. These results suggest that F3D could lower SGL in diabetic animals. Previous reports showed the capacity of Opuntia species to reduce the glycemia in diabetic rats. 33 Moreover, López-Romero et al. 34 have proved that Opuntia had low glycemic activity and can be recommended in type 2 diabetes. Furthermore, Feugang et al. 35 and Bouhrim et al. 36 revealed the capacity of cactus seed oil to decrease the serum glucose concentration in rats by a potential induction of insulin secretion, converting glucose to glycogen. The beneficial effects of F3D extract may be attributed to its antioxidant activity, the antioxidants decrease the blood glucose levels by lowering glycosylated hemoglobin 30 also to its content on polyphenols and flavonoids which are known by their capacity to reduce the blood glucose. 37 Oral glucose tolerance test (OGTT) was carried out in fructose-fed rats after 20 weeks to verify insulin resistance. The administration of glucose caused a significant increase in blood glucose levels in diabetic group at 30 min compared with the control group (Figure 2) These data are in agreement with several reports38–40 and confirm that consumption of high-fructose diets leads to the development of insulin resistance. In contrast, HFD fed animals receiving F3D (100 or 300 mg/kg body weight) and metformin exhibited lowered blood glucose levels compared with HFD rats. Among these groups, the F3D (300 mg/kg body weight) was more efficient in lowering the blood glucose level than the metformin. Nevertheless, no significant differences were noted among the rats fed normal diet and supplemented with F3D in OGTT. The hypoglycemic effect of F3D may be related to its polyphenols content. Indeed, the polyphenols can lower the blood glucose levels by different mechanisms especially in the peripheral tissues either by inhibiting the gluconeogenesis, stimulating the insulin release by pancreatic β-cells or by inhibiting the glucose uptake by the gut. 41 Furthermore, several previous researches revealed the antidiabetic effect of polyphenols, quercetin extracted from onion exhibited a strong antidiabetic activity. 42 Previous results showed that saponins delay the transfer of glucose from stomach to the small intestine. 43

Effect of decoction of post-flowering stage of Opuntia dejecta on the oral glucose tolerance test (OGTT) in rats feeding normal or high-fructose diet for 20 weeks and treated by metformin or F3D orally during the last 4 weeks.
Effect of the decoction of post-flowering stage on serum glucose level.
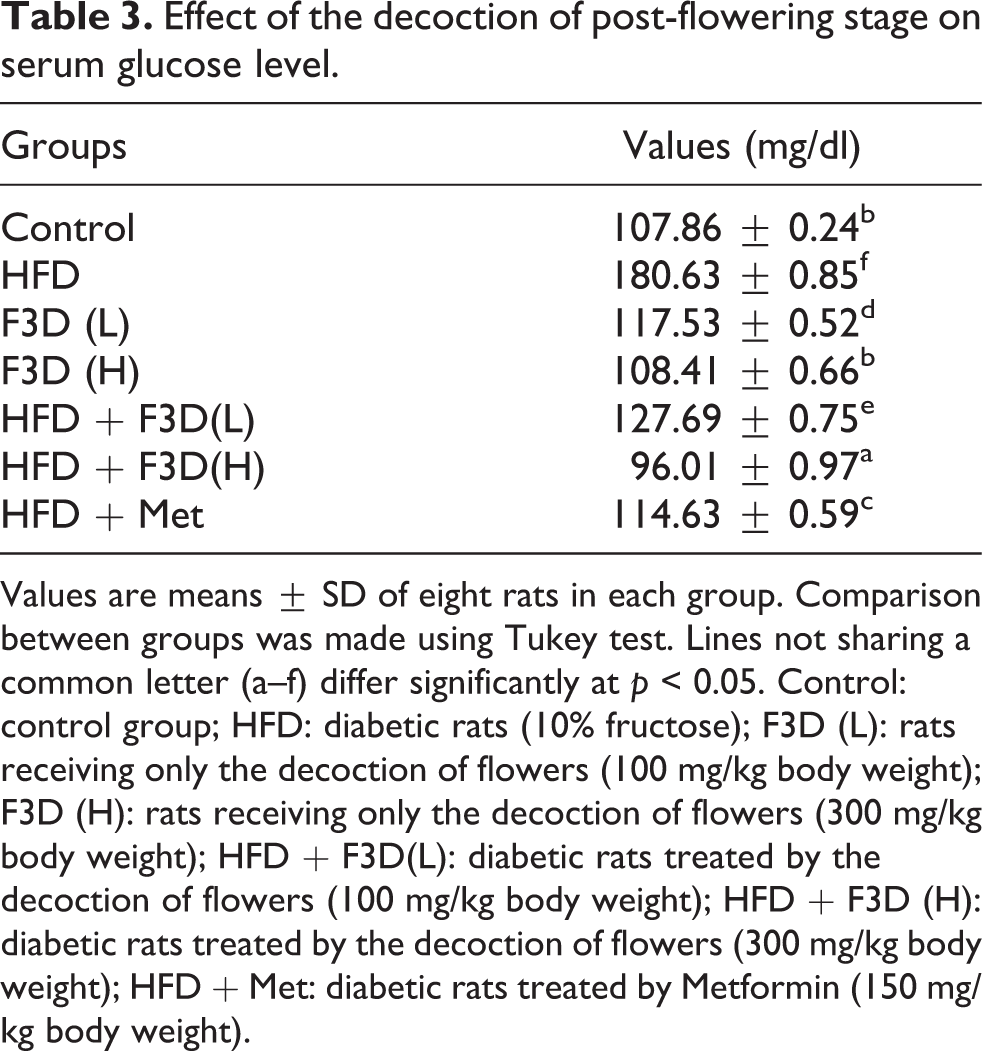
Values are means ± SD of eight rats in each group. Comparison between groups was made using Tukey test. Lines not sharing a common letter (a–f) differ significantly at p < 0.05. Control: control group; HFD: diabetic rats (10% fructose); F3D (L): rats receiving only the decoction of flowers (100 mg/kg body weight); F3D (H): rats receiving only the decoction of flowers (300 mg/kg body weight); HFD + F3D(L): diabetic rats treated by the decoction of flowers (100 mg/kg body weight); HFD + F3D (H): diabetic rats treated by the decoction of flowers (300 mg/kg body weight); HFD + Met: diabetic rats treated by Metformin (150 mg/kg body weight).
Effect of F3D on serum biochemical parameters
The hepatic (ALT, AST, ALK-P and TB) and lipidic parameters (HDL-C and TG) profiles in the plasma of rats are shown in Tables 4 and 5, respectively. The activities of transaminase (AST and ALT), Alk-P and TB were increased significantly in rats fed HFD in comparison with control group. These findings were in agreement with previous studies. 44 An increase in the activities of enzymes including AST, ALT and Alk-P reflects hepatic dysfunction.45,46 In addition, there are no remarkable differences between F3D (100 and 300 mg/kg) and control group into the liver parameters. Although, the administration of F3D (100 and 300 mg/kg) to the HFD rats reverted the values of liver dysfunction indices back to normal. In fact, F3D has a comparable preventive effect to metformin. Therefore, dietary fructose causes hyperinsulinemia which leads to the stimulation of lipogenesis in the liver along with insufficient control of hyperglycemia.47,48 This was in agreement with the present findings (Table 5); a significant increase in the total cholesterol and triglycerides was observed in the diabetic rats when compared to the normal rats. The insulin resistance and the hypertriglyceridemia noted in High-fructose Diet fed rats are due to the decreased expression of lipoprotein lipase. 49 However, a significant decrease (p < 0.05) in the level of HDL-C was noted in the HFD rats. The administration of F3D to the diabetic animals improved the lipidic profile by reducing the levels of TC and TG and increasing the rate of HDL-C which becomes comparable to the normal values. Metformin also lowered the plasma lipid levels when administered to HFD fed rats. The hypolipidemic effect of F3D could be related to its contents of polyphenolic compounds and flavonoids which have the capacity to reduce serum lipids 16 by inhibiting the pancreatic lipase which is responsible for hydrolyzing fatty acids and this can induce the increased insulin sensitivity. 50 The same results were observed by using the aqueous extract of cladodes of Opuntia ficus indica. 51
Effect of the decoction of post-flowering stage on serum hepatic marker enzymes.

Values are means ± SD of eight rats in each group. Comparison between groups was made using Tukey test. Lines not sharing a common letter (a–e) differ significantly at p < 0.05. Control: control group; F3D (L): rats receiving only the decoction of flowers (100 mg/kg body weight); F3D (H): rats receiving only the decoction of flowers (300 mg/kg body weight); HFD: diabetic rats (10% fructose); HFD + Met: diabetic rats treated by Metformin (150 mg/kg body weight); HFD+ F3D(L): diabetic rats treated by the decoction of flowers (100 mg/kg body weight); HFD + F3D (H): diabetic rats treated by the decoction of flowers (300 mg/kg body weight).
Effect of the decoction of post-flowering stage on lipidic profil.
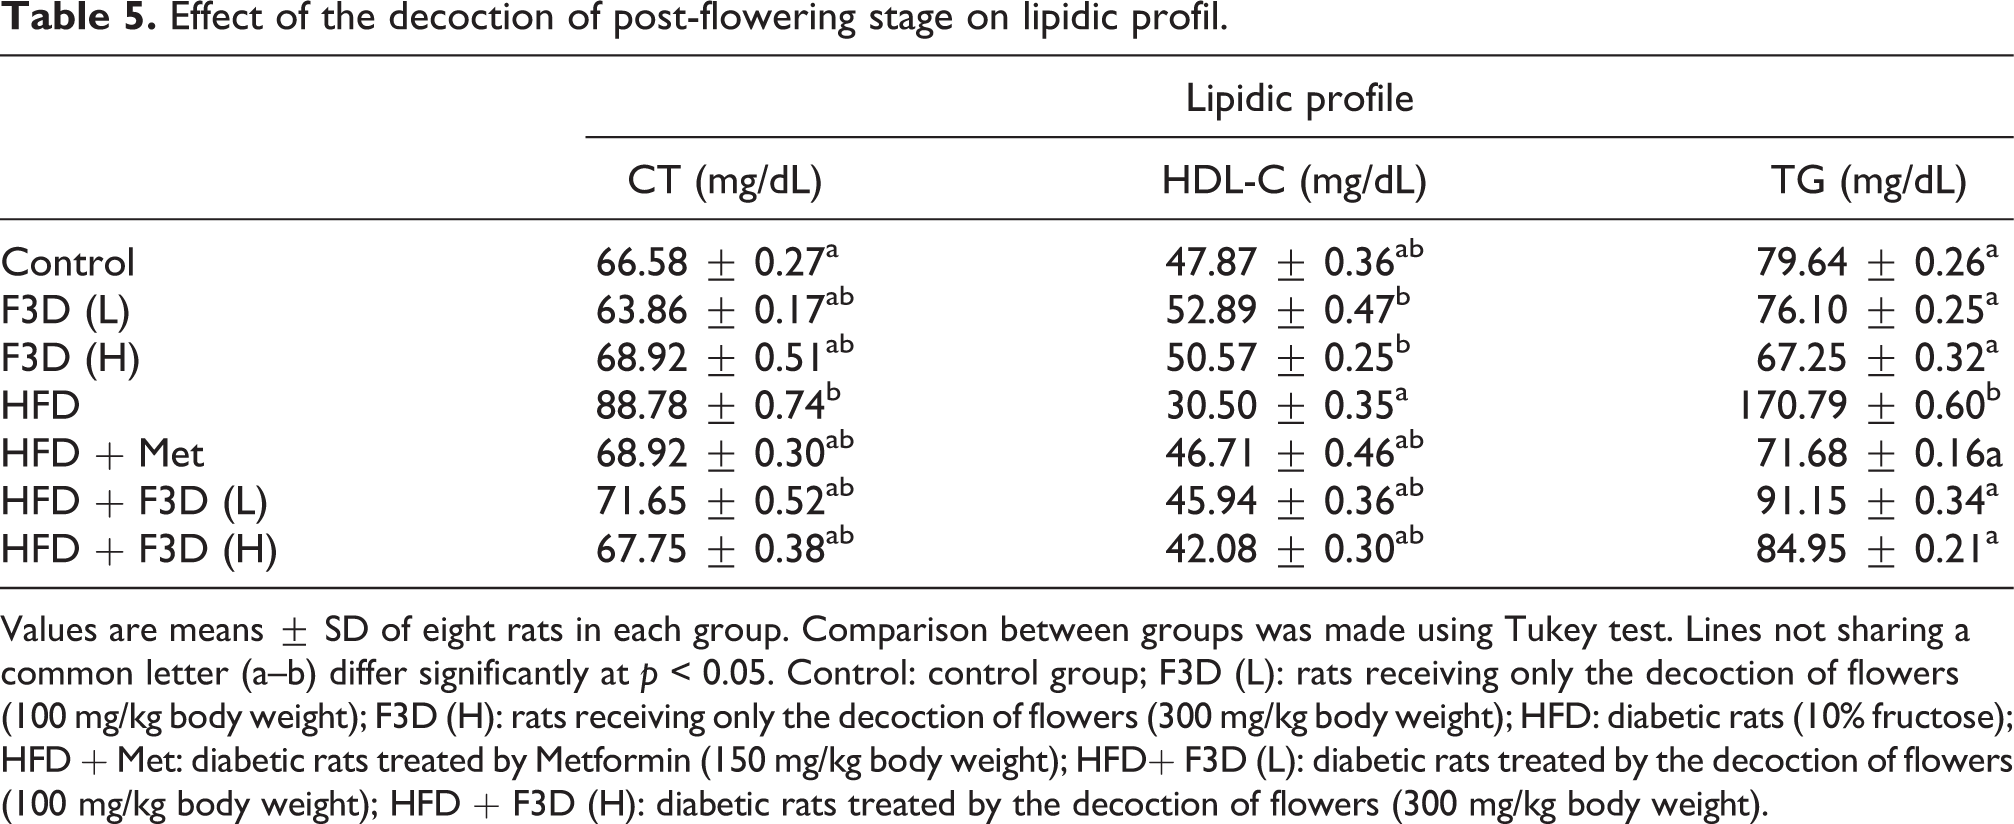
Values are means ± SD of eight rats in each group. Comparison between groups was made using Tukey test. Lines not sharing a common letter (a–b) differ significantly at p < 0.05. Control: control group; F3D (L): rats receiving only the decoction of flowers (100 mg/kg body weight); F3D (H): rats receiving only the decoction of flowers (300 mg/kg body weight); HFD: diabetic rats (10% fructose); HFD + Met: diabetic rats treated by Metformin (150 mg/kg body weight); HFD+ F3D (L): diabetic rats treated by the decoction of flowers (100 mg/kg body weight); HFD + F3D (H): diabetic rats treated by the decoction of flowers (300 mg/kg body weight).
Effect of F3D on the hepatic oxidative markers
The chronic consumption of high-fructose diets represents an important factor to excessive formation of reactive oxygen species (ROS) leading to oxidative stress, and insulin resistance. Previous data demonstrated that lipid peroxydation caused a destruction of a variety of tissues, which may contribute to several abnormalities including diabetes mellitus. 33 As it was showed in Figure 3 exposure to fructose caused a significant (p < 0.05) decrease in the activities of enzymatic antioxidants: SOD, CAT and GPX in the liver of fructose-fed rats to 81.31 ± 3.90, 25.13 ± 2.15 and 0.68 ± 0.09 U mg/Protein, respectively, when compared to the control groups (Control, F3D (100 mg/kg) and F3D (300 mg/kg)). Nevertheless, the HFD group exhibited significantly higher concentrations of hepatic TBARS than control group (Figure 3(A)). These results are in harmony with previous studies that revealed a significant decrease of hepatic antioxidant enzyme activities and a significant increase in lipid peroxidation in fructose-induced diabetic rats.49–53 Whereas, the supplementation of F3D (100 and 300 mg/kg) displayed significantly lower level of hepatic TBARS than the HFD group. In addition, the supplementation of F3D to the HFD animals caused an increase in the antioxidant enzymes activities (SOD, CAT and GPX) compared with the diabetic group (Figure 3(B) to (D)). There was no significant difference between the antioxidant enzyme activities in the HFD group treated with Metformin or supplemented with the flowers decoction especially at the concentration 300 mg/kg. This antioxidant activity of the F3D may be due to the high content in antioxidant compounds mainly polyphenols and flavonoids. Many data revealed the capacity of natural antioxidant in plants to inhibit lipid peroxidation.54,55 The hypoglycemic effect of Polyphenols is due to its inhibition of starch digestion by inhibition of digestion enzymes, improvement of insulin resistance, and inhibition of glycation end products (AGEs) formation 56 which is known to generate oxidative stress. Thereby, the effect of the F3D extract can be linked to the richness of the extract on polyphenols which enhance the expression of antioxidant enzymes increasing SOD, CAT and decreasing of the by-product of lipid peroxydation MDA. 33 Previous studies demonstrated that grape seeds polyphenols inhibited the oxidative stress caused by high glucose in cultured LLC-PK1 cells. 42 Also, Rizvi and Mishra 57 proved the capacity of quercetin to protect the diabetics against the lipid peroxydation and to enhance the antioxidant system.

Effect of the decoction of post-flowering stage and metformin administration on MDA (A), hepatic SOD activity (B), catalase activity (C) and GPX activity (D) after 20 weeks of fructose feeding. Control: control group; HFD: diabetic rats (10% fructose); F3D (L): rats receiving only the decoction of flowers (100 mg/kg body weight); F3D (H): rats receiving only the decoction of flowers (300 mg/kg body weight); HFD + F3D(L): diabetic rats treated by the decoction of flowers (100 mg/kg body weight); HFD + F3D (H): diabetic rats treated by the decoction of flowers (300 mg/kg body weight); HFD + Met: diabetic rats treated by Metformin (150 mg/kg body weight).
Histopathology
The primary organ which comes under stress because of the metabolic syndrome and insulin resistance is the liver. 58 Fructose consumption causes metabolic alterations in liver that leads to abnormalities including oxidative stress.59,60 Livers of the controlled rats showed normal histoarchitecture (Figure 4(A) and (B)). Similar results were found in the rats fed normal diet with the supplementation of the decoction of post-flowering stage (Figure 4(B) to (E)) which had classical liver architecture with normal parenchyma, centrilobular vein, portal space and sinusoids which were normally dilated. Nevertheless, livers of diabetic rats were damaged which is confirmed by the enzymatic essays. Decreased level of antioxidant enzymes, excess generation of free radicals and increased lipid peroxidation causes deleterious changes in the structure of the liver of the diabetic rats. 61 The hepatic histology of these animals presented a marked dilatation of portal space (Figure 5(A)), centrilobular vein (Figure 5(E)) and sinusoids (Figure 5(D)), congestion of blood and massive necrosis of hepatocytes (Figure 5(B)) and lymphocytic infiltration (Figure 5(D)). Moreover, these rats showed hepatic fat accumulation which leads to diffuse parenchyma steatosis and foamy vacuoles (Figure 5(F)) associated with fibrosis (Figure 5(C)). Interestingly, in the diabetic rats treated with metformin (Figure 6(A) and (B)) either F3D (100 and 300 mg/kg) respectively (Figure 6(C) to (F)), the hepatocytes were looking healthy, the liver presented a normal hepatic structure with reduction in the accumulation of hepatic lipids. These effects were more noticeable at the high dose of F3D than the low dose. The liver fibrosis was evaluated by Masson’s trichrome staining which showed a portal fibrosis (Figure 7(D) and (E)) and slight sinusoidal fibrosis (Figure 7(F)) in diabetic rats when compared with the control group (Figure 7(A)). These pathological changes were ameliorated in the liver sections of the treated groups with metformin (Figure 7(G)) and with plant extract at 100 mg/kg (Figure 7(H)) and 300 mg/kg (Figure 7(I)). These results are in accordance with Lozano et al. 62 who showed that HFD caused steatosis and fibrosis. Previous study revealed that fructose consumption causes discernible changes in liver such as distended vein, fibrosis and leucocytic infiltrations. 48

Photomicrographs of histopathological findings of control liver sections (H&E). (
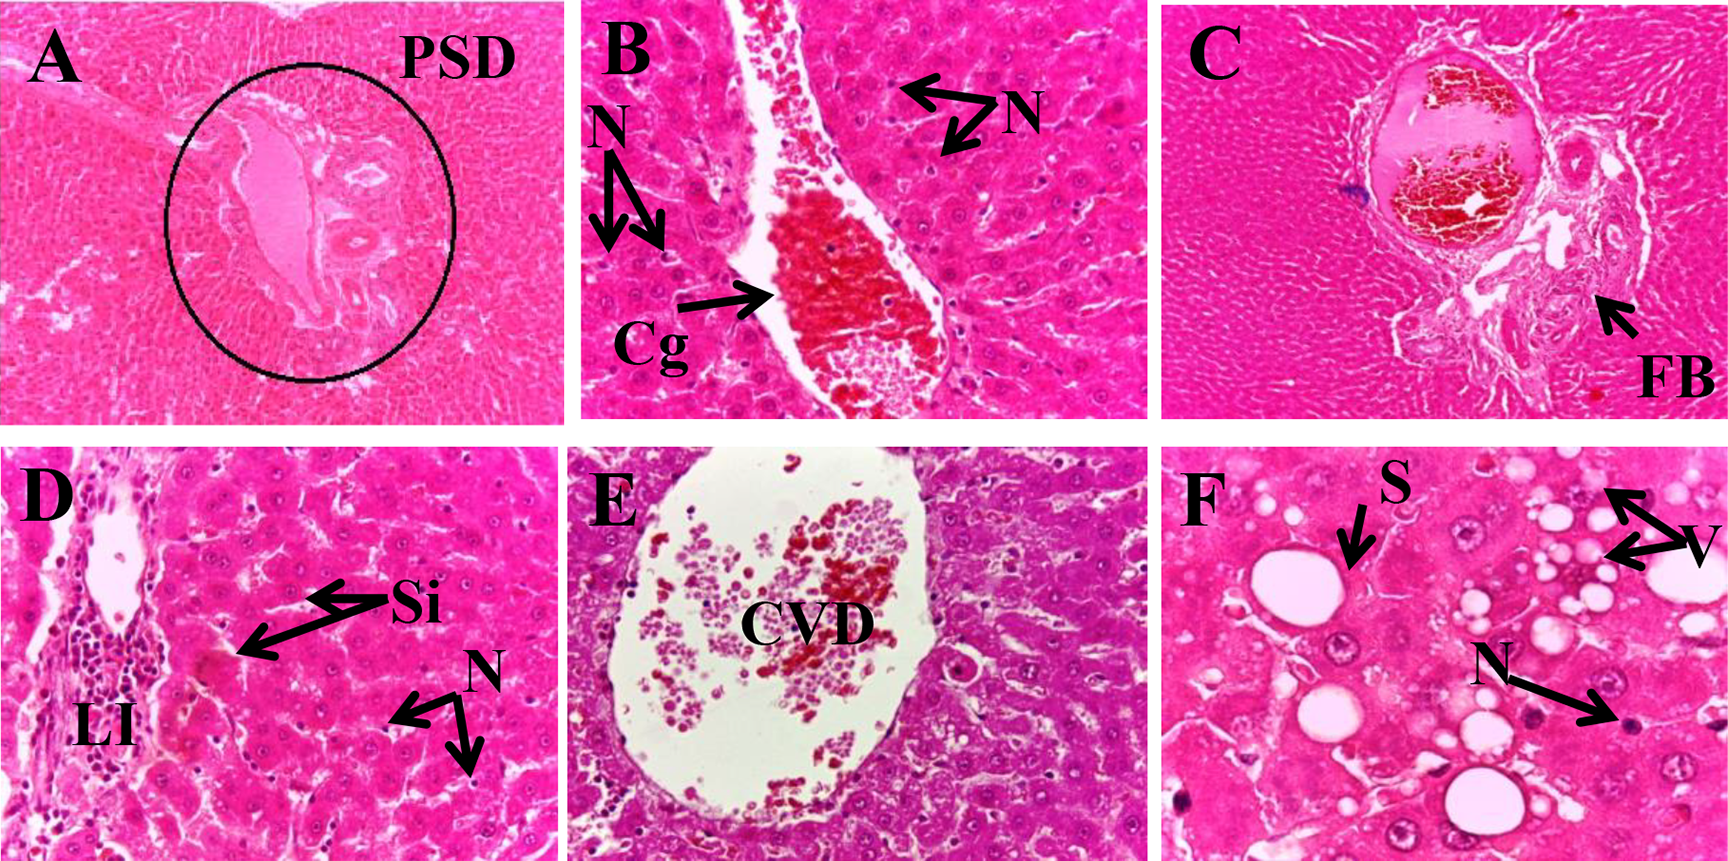
Photomicrographs of liver sections of diabetic rats (H&E). The liver showed marked dilatation of portal space (A × 10), centrilobular vein (E × 40) and sinosoids (D × 40), congestion of blood and massive necrosis (B × 40), fibrosis (B × 10), lymphocytic infiltration (D × 40) and diffuse parenchyma steatosis and foamy vacuoles (D × 40). PSD: Dilated Portal Space, CVD: Dilated Centrilobular Vein, Si: Sinusoid, S: Steatosis, V: Vacuoles, Cg: Congestion, LI: Lymphocytic Infiltration,

Photomicrographs of liver sections of diabetic rats treated with either F3D (100 and 300 mg/kg) or metformin (150 mg/kg) (H&E). (A × 10 and B × 10) livers of rats treated with metformin showed normal histology except a little dilated portal triad and centrilobular vein and slightly more sinusoidal spaces and lymphocytic infiltration. (C × 10, D × 40/E × 10 and F × 40) livers of rats treated with F3D (100 and 300 mg/kg) respectively kept normal hepatic structure with no pathological changes such as congestion and necrosis compared to the diabetic rats except little steatosis and lymphocytic infiltration. PS: Portal Space, CV: Centrilobular Vein, Si: Sinusoid, S: Steatosis, LI: Lymphocytic Infiltration.

Photomicrographs of liver sections stained with Masson’s trichrome. (7A × 10) liver sections of control rats. (B × 10 and C × 10) liver sections of normal rats fed with F3D (100 and 300 mg/kg respectively). (D × 10, E × 40 and F × 40) liver sections of diabetic rats showing portal fibrosis (D × 10, E × 40) and slight sinusoidal fibrosis (F × 40). (G × 40) liver sections of diabetic rats treated with metformin. (H× 40 and I × 40) liver sections of diabetic rats treated with F3D (100 and 300 mg/kg respectively). PS: Portal Space, PF: Portal Fibrosis, SF: Sinusoidal Fibrosis.
Conclusion
The phytochemical content and the antioxidant activity of the decoction of post-flowering stage of Opuntia dejecta were evaluated. Indeed, this aqueous extract revealed an important antioxidant activity. The excessive fructose intake has been linked to insulin resistance, impaired postprandial lipid metabolism and oxidative stress. Opuntia Flowers were used in the traditional medicine for the treatment of diabetes. This was confirmed by our findings which revealed that the decoction of post-flowering stage of Opuntia dejecta (Salm-Dyck) has a significant antidiabetic activity by decreasing the glucose level. Also, this study demonstrates the hepatic protective effect of the flower decoction by improving the metabolic alterations and the abnormalities including oxidative stress induced by Fructose consumption.
Footnotes
Acknowledgement
The authors would like to thank all of the colleagues who contributed to this study.
Declaration of conflicting interests
The author(s) declared no potential conflicts of interest with respect to the research, authorship, and/or publication of this article.
Funding
The author(s) received no financial support for the research, authorship, and/or publication of this article.