
Abstract
We investigated changes in 8-hydroxy-2-deoxyguanosine (8-OHdG) activity which is a product of oxidative DNA damage, histopathological changes and antioxidant responses in liver and gill tissues of rainbow trout, following a 21-day exposure to three different concentrations of linuron (30 µg/L, 120 µg/L and 240 µg/L). Our results indicated that linuron concentrations caused an increase in LPO levels of liver and gill tissues (p < 0.05). While linuron induced both increases and decreases in GSH levels and SOD activity, CAT activity was decreased by all concentrations of linuron (p < 0.05). The immunopositivity of 8-OHdG was detected in the hepatocytes of liver and in the epithelial and chloride cells of the secondary lamellae of the gill tissues. Our results suggested that linuron could cause oxidative DNA damage by causing an increase in 8-OHdG activity in tissues, and it induces histopathological damage and alterations in the antioxidant parameters of the tissues.
Introduction
Pesticides are chemical substances widely used to control crop pests in agricultural production. 1 Although some benefits of pesticides use are known, they may also cause different side effects. 2 Natural aquatic ecosystems can be contaminated by pesticides due to their indiscriminate use in agriculture, and these pesticides have negative effects on the aquatic environment including fish. 3 –5 Several researchers have indicated that pesticides induce toxicity in various species of fish, e.g. they cause modifications of the DNA structure in freshwater animals and marine life, 6 apoptosis in the rainbow trout liver and gill tissues, 7 and biochemical and histopathological alterations in common carp. 8,9 Linuron is a herbicide used to control annual broad leaf weeds and grasses particularly cereals and vegetables. 10 Linuron enters surface waters through agricultural runoff. 11 Linuron concentrations were found to be, respectively, 1100 µg/L and 31.3 µg/L in the surface waters of the Holland River and in Florida Streams. 11,12 Linuron is considered to be highly toxic to non-targeted aquatic organisms such as fish. 13 Several studies have been performed relating to the effects of linuron. 14 –16 For this reason, linuron has emerged as a pollutant. 17 So, it is necessary to assess the toxicological effects of linuron on rainbow trout and this provides valuable information in toxicological risk assessments.
Many environmental pollutants, including pesticides, may lead oxidative stress resulting to reactive oxygen species (ROS) production such as OH-,
The effects of linuron are poorly understood in fish and its toxic effects are not fully known. There is a scarcity of studies about the effects of linuron on fish, and histopathological changes and oxidative stress induced by linuron have not been investigated in fish. Thus, the aim of study was to evaluate 8-OHdG activity, histopathological changes and the parameters of antioxidant defenses including CAT, SOD, GSH and LPO in liver and gill tissues of rainbow trout following 21 days of linuron treatment.
Materials and methods
Fish and experimental design
Rainbow trout (Oncorhynchus mykiss) individuals have same genetic background that had an average body mass of approximately 150 ± 6.75 g were obtained from Atatürk University Fisheries Faculty Erzurum/TURKEY. Ten fish were placed into each of the fiberglass tanks containing 400 L of dechlorinated tap water for 15 days of acclimation and fish were supplied with aerated well water (10 ± 0.5°C) with a 12 h light–12 h dark photoperiod. The pH was 7.2 and the water hardness was 181.6 mg/L, with 8.4 mg/L of dissolved oxygen. Fish were fed daily with commercial pellets. All of the experiments complied with institutional animal care guidelines and were approved by the Animal Experimentation Ethics Committee of the Atatürk University, Erzurum/TURKEY.
A commercial formulation of linuron (450 g/L linuron, (3-(3,4-dichlorophenyl)-1-methoxy-1-methylurea) was obtained from a distribution company (Turkey). A stock solution was prepared by dissolution in distilled water. The determined LC50 value was 3 mg/L. 30 Accordingly, the treatment doses were determined as 30 µg/L (1% of LC 50), 120 µg/L (4% of LC 50) and 240 µg/L Linuron (8% of LC 50). Fish were exposed to the three different doses of the linuron for 21 days. 31 Then, fish were sacrificed by cervical section, liver and gill tissues were immediately sampled. One part of these tissues was stored at −20°C for the analysis of biochemical parameters. The rest of the tissues were fixed in 10% neutral buffered formalin solution to examine 8-OHdG activity and histopathology. Three replications were performed for each group in the experiments.
Lipid peroxidation (LPO) determination
The LPO level in tissues was determined by estimating malondialdehyde (MDA) using the thiobarbituric acid test. The assay method bases on a reaction that MDA compound generates red color via reacting with two TBA molecules at high temperature and low pH. 32 The tissues were dissected, weighed and homogenized in 10 ml of 100 g/L of KCl. The homogenate (0.5 ml) was added to a solution containing 0.2 ml of 80 g/L of sodium laurylsulfate, 1.5 ml of 200 g/L acetic acid, 1.5 ml of 8 g/L of 2-thiobarbiturate and 0.3 ml of distilled water. The mixture was incubated at 98°C for 1 hour. Upon cooling, 5 ml of n-butanol:pyridine (15:l) was added. The mixture was vortexed for 1 min and centrifuged for 30 minutes at 4000 rpm. The absorbance of supernatant was measured at 532 nm. The standard curve was obtained by using 1,1,3,3-tetramethoxypropane. The recovery rate was over 99%. The results were expressed as nmol of MDA/g of tissue.
Superoxide dismutase (SOD) activity
SOD activity was measured according to Sun et al. 33 SOD estimation was based on the generation of superoxide radicals produced by xanthine and xanthine oxidase, which reacts with nitro blue tetrazolium (NBT) to form formazan. SOD activity was then measured at 560 nm by the degree of inhibition of this reaction, and was expressed as mmol/min/mg of tissue.
Catalase (CAT) activity
The decomposition of H2O2 in the presence of CAT was measured at 240 nm. 34 The CAT activity was defined as the amount of enzyme required to decompose 1 mmol of H2O2 per minute, at 25°C at a pH of 7.8. The results were expressed as mmol/min/mg of tissue.
Total GSH
The GSH level was designed according to the method described by Sedlak and Lindsay, with some modifications. 35 The tissues were homogenized in 2 ml of 50 mM of Tris–HCl buffer containing 20 mM of EDTA, at a pH of 7.5. After adding 2 ml ethanol (to precipitate the proteins), the homogenate was centrifuged at 3000 × g for 40 minutes at 4°C. The supernatant was used to determine the GSH level using 5, 5’-dithiobis (2-nitrobenzoic acid) (DTNB). The absorbance was measured at 412 nm. The GSH level of the tissues was expressed as nmol/g of tissue.
Histopathological examination
Liver and gill tissue samples were fixed in 10% buffered formalin solution. After the tissues are passed through alcohol and xylene series, they were embedded in melted paraffin. All samples were prepared microtome sections in 5 µm by using rotary microtome (Leica, Germany). The sections were stained with H&E (Hematoxylin-Eosin) and results were evaluated under light microscopy (Olympus BX51, DP72).
Immunohistochemical examination
Liver and gill tissue sections were used for immunohistochemistry staining. After deparaffinization, a 3% H2O2 (hydrogen peroxide; 18304-1L, Sigma, Missouri, ABD) solution was applied drop by drop on each slide for 10 minutes to enable endogenous peroxidase activity. Then, the slides were boiled in antigen retrieval solution (ab 96674, Abcam, Cambridge, UK) (at a pH of 6.0) in a microwave for 15 minutes to unmask the antigens. After cooling, sections were incubated for 15 minutes with a protein block solution (ab 80436, Abcam, Cambridge, UK) to prevent nonspecific binding. The 8-OHdG (sc-66036, 1/200 dilution, Santa Cruz, EU) antibody was diluted with the solution (ab 64211; Abcam, Cambridge, UK). Sections were incubated with diluted antibody at room temperature for 45 minutes. An expose mouse and rabbit specific HRP/DAB detection IHC kit was used as follows: sections were incubated with goat anti-mouse antibody for 30 minutes, then with streptavidin peroxidase for 15 minutes, and finally with 3,3′ diaminobenzidine + chromogen dropped on the slides for 2 to 3 minutes. The slides were counterstained with hematoxylin. Then 10 randomly selected areas were examined at 20× magnification.
Statistical analyses
Biochemical analyses were expressed as mean ± SEM and the differences in treated and control groups were performed by one-way analysis of variance (ANOVA) and the Duncan test. Differences were accepted to be statistically significant with of p < 0.05. Histopathological and immunohistochemical analyzes were performed by the Kruskal Wallis test and Mann–Whitney U test. Differences were accepted to be statistically significant with of p < 0.05.
Results
Effects of linuron on gill antioxidant parameters
There was an increase in the LPO levels of the gills in all groups compared to the control groups (p < 0.05). While the SOD activity decreased at 30 µg/L relative to the control, there were no significant changes at 120 µg/L and 240 µg/L. Linuron caused a significant decrease in CAT activity for gill tissue exposed to 120 µg/L and 240 µg/L of linuron (p < 0.05). On the other hand, GSH levels at 30 µg/L were significantly lower than those of the control (p < 0.05), but did not differ at 120 µg/L and 240 µg/L (Table 1).
The effects on antioxidant parameters in the gill tissue of different concentrations of linuron.

Different letters indicate statistically significant differences (p < 0.05). Each value is the mean ± SEM.
Effects of linuron on liver antioxidant parameters
There was an increase in the LPO levels of the gills in fish exposed to 240 μg/L concentration of linuron compared to the control groups (p < 0.05). While the SOD activity increased at 30 µg/L and 120 µg/L relative to the control, it decreased in liver exposed to linuron concentration of 240 μg/L (p < 0.05). CAT activity decreased at all linuron concentrations (p < 0.05). In addition, GSH levels at 30 µg/L were significantly higher than those of the control group (p < 0.05), but decreased at 120 µg/L and 240 µg/L (Table 2).
The effects on antioxidant parameters in the liver tissue of different concentrations of linuron.

Different letters indicate statistically significant differences (p < 0.05). Each value is the mean ± SEM.
Histopathology results
A statistically significant difference was found between groups in histopathological examinations (p < 0.05) (Table 3). Histopathological changes were not detected in the liver (Figure 1(a)) and gill (Figure 2(a)) tissues of the control group examined by the light microscope. Histopathological alterations in different degrees were seen in experimental group tissues. There were no histopathological changes in the gill and liver tissues exposed to 30 μg/L of linuron (Figure 1(b) and Figure 2(b)). While necrotic and degenerating hepatocytes were observed in fish liver exposed to linuron concentrations of 120 μg/L and 240 μg/L (Figure 1(c) and (d)), gill tissue showed lamellar thickening, epithelial hyperplasia, cellular infiltrations, and lamellar edema (Figure 2(c) and (d)).
Histopathological analysis results in the liver and gill tissues of fish exposed to different linuron concentrations.
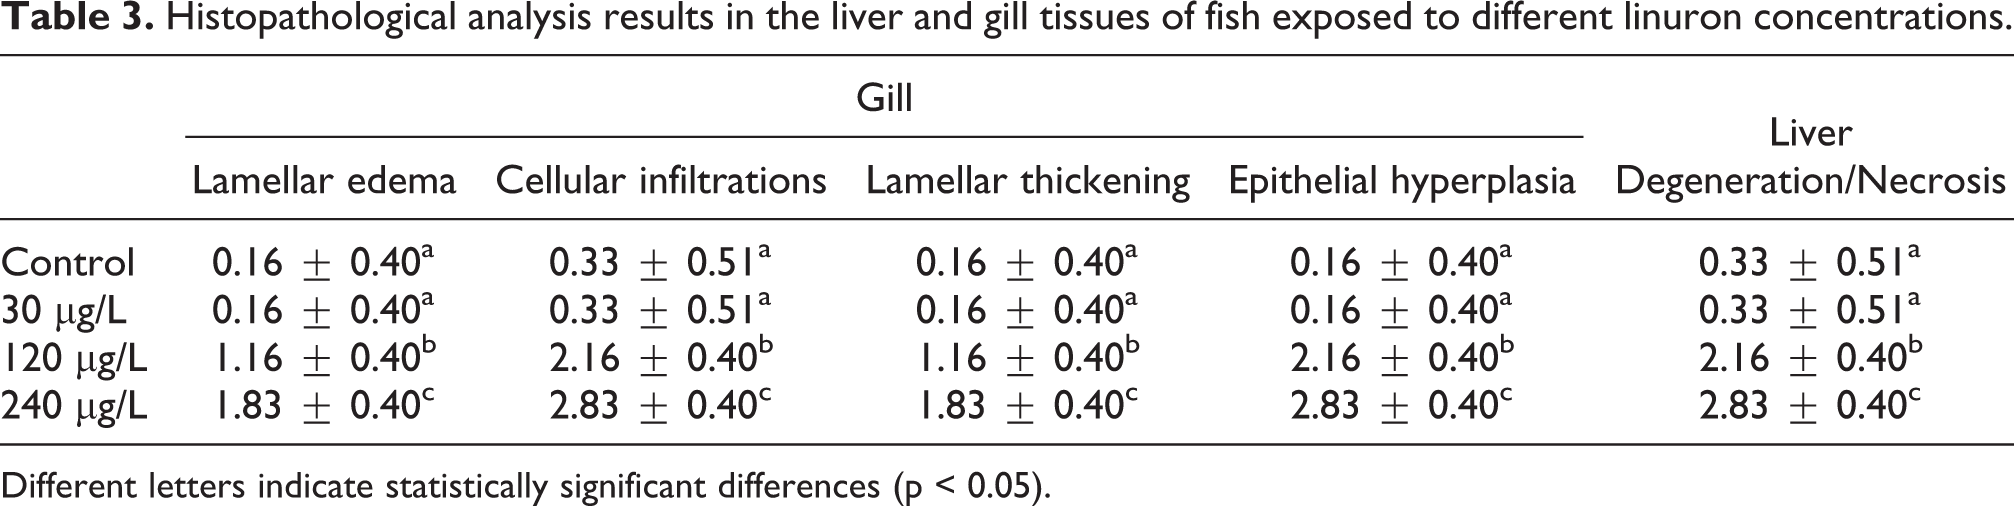
Different letters indicate statistically significant differences (p < 0.05).

Histological appearance of the liver tissue in control group (a), normal histological architecture of liver tissue in fish exposed to 30 μg/L of linuron (b), necrotic and degenerating hepatocytes at a medium level in fish liver exposed to 120 μg/L of linuron (arrows) (c), necrotic and degenerating hepatocytes at a high level in fish liver exposed to 240 μg/L of linuron (arrows) (d). HE stain, ×20.

Histological appearance of the gill tissue in control group (a), normal histological architecture of gill tissue in fish exposed to 30 μg/L of linuron (b), lamellar edema, cellular infiltrations, lamellar thickening, epithelial hyperplasia at a medium level in fish liver exposed to 120 μg/L of linuron (arrows) (c), lamellar edema, cellular infiltrations, lamellar thickening, epithelial hyperplasia at a high level in fish liver exposed to 240 μg/L of linuron (arrows) (d). HE stain, ×20.
8-OHdG immunoreactivity results
A statistically significant difference was found between the groups in immunohistochemical staining with 8-OhDG (p < 0.05) (Table 4). 8-OHdG immunopositivity was not observed in the liver and gill tissues of the control group (Figure 3(a), Figure 4(a)). Immunopositivity was observed in the cytoplasm of hepatocytes in liver tissues of fish exposed to all linuron concentrations (Figure 3(b)–(d)). In the gill tissues, 8-OHdG immunopositivity was observed in the epithelial and chloride cells of the secondary lamellas (Figure 4(b)–(d)). The immunopositivity of 8-OHdG was increased by linuron doses in direct proportion when compared with the control group.
Immunohistochemical analysis results in the liver and gill tissues of fish exposed to different linuron concentrations.

Different letters indicate statistically significant differences (p < 0.05).

Liver sections of control group (a), mild 8-OHdG positive reactions in hepatocytes of fish liver exposed to 30 μg/L of linuron (arrowhead) (b), moderate positive reactions in hepatocytes of fish liver exposed to 120 μg/L of linuron (arrowhead) (c), severe positive reactions in hepatocytes of fish liver exposed to 240 μg/L of linuron (arrowhead) (d). IHC stain, ×20.

Gill sections of control group (a), mild 8-OHdG positive reactions in the epithelial (arrowhead) and chloride cells (arrow) in the secondary lamellas of fish gill exposed to 30 μg/L of linuron (b), moderate positive reactions in the epithelial (arrowhead) and chloride cells (arrow) in the secondary lamellas of fish liver exposed to 120 μg/L of linuron (c), severe positive reactions in the epithelial and chloride cells in the secondary lamellas of fish liver exposed to 240 μg/L of linuron (d). IHC stain, ×20.
Discussion
Natural aquatic ecosystems can be contaminated by pesticides due to their indiscriminate use in agriculture, and these pesticides have negative effects on the aquatic environment including fish. 3 –5 Pesticides cause mitochondrial dysfunction, oxidative stress, and inflammation in vertebrates. 36 Linuron is one of herbicide used to control particularly cereals and vegetables. 10 .The effects of linuron on different organisms have been studied and these studies demonstrated that linuron could affect the animal health. 16,37,38 However, there are limited studies about the toxic effects on fish of linuron and its harmful effects are not fully known. Therefore, linuron may cause a serious environmental risk for non-targeted aquatic organisms including fish. 13
When antioxidant defense systems decrease or production of ROS increases, oxidative stress occurs. 39 ROS generation can cause lipid peroxidation (LPO), under oxidative stress conditions. 40,41 Environmental contaminants generate lipid peroxidation, leading to cell function loss under oxidative stress conditions. 42 In this study, linuron caused oxidative stress, with an increase in LPO levels in the tissues. This result suggests that ROS generated oxidative stress can be one of the toxic effects of linuron. Oxidative stress causes oxidative DNA damage and 8-OHdG is well known to be a product of oxidative DNA damage. 26,43 We detected 8-OHdG immunopositivity in the liver and gill tissues of the treatment groups. In one study, diuron herbicide treatment caused DNA damage and 8OHdG accumulation in the germinal cells of the Pacific oyster Crassostrea gigas. 44 There is a significant linear relationship between ROS production and 8-OHdG generation, and ROS can lead to 8-OHdG formation. 45 This shows that an increase of 8-OHdG occurring in tissues may be a consequence to oxidative stress. 46
When an organ is exposed to a chemical, enzyme activity may be either inhibited or increased. The decrease or increase in these enzymes may provide sufficient information for diagnostic value.
47
In the present study, SOD activity indicated both decreases and increases depending on the dose in the tissues. An increase in SOD activity occurring in the tissues may be explained as a response to the increased superoxide anions and H2O2 levels.
48
Therefore, this increase in the SOD activity shows an increase of
In summary, the study findings indicated that linuron can be hazardous to non-targeted organisms, and that linuron caused biochemical, physiological and histopathological changes. Hence, these results can explain one of the molecular pathways for understanding of toxicity mechanism.
Footnotes
Declaration of conflicting interests
The author(s) declared no potential conflicts of interest with respect to the research, authorship, and/or publication of this article.
Funding
The author(s) disclosed receipt of the following financial support for the research, authorship, and/or publication of this article: The authors thank Atatürk University for financial support of the research (Project No: 2015/196).