
Abstract
Oxidative stress (OS) plays an essential role in the pathogenesis of common neurodegenerative diseases. We have previously shown that Toxoplasma gondii (T. gondii) induces high nitric oxide (NO) production, glial activation, and apoptosis that altogether cause severe neuropathology in toxoplasma encephalitis (TE). The objective of this study was to investigate the cytotoxic effect of OS and to identify a correlation between the causes of T. gondii induced neuropathology. Expression levels of glutathione reductase (GR), Cu/Zn superoxide dismutase (SOD1), neuron specific enolase (NSE), and 8-hydroxy-2’-deoxyguanosine (8-OHdG) were investigated. Results of the study revealed that the levels of GR (P <0.005) and NSE (P <0.001) expression in the brain tissue markedly increased while SOD1 activity decreased (P <0.001) in the infected group compared to the non-infected group. In addition, intense staining for 8-OHdG (P <0.05) was observed both in the nucleus and the cytoplasm of neurons and glial cells that underwent OS. These results were reasonable to suggest that T. gondii-mediated OS might play a pivotal role and a different type of role in the mechanism of neurodegeneration/neuropathology in the process of TE. The results also clearly indicated that increased levels of NO and apoptosis might contribute to OS-related pathogenesis of TE. As a result, OS and expression of NSE might give an idea of the disease progress and may have a critical diagnostic significance for patients with T. gondii infection.
Introduction
Toxoplasma gondii (T. gondii) is an intracellular parasite that is capable of infecting all warm-blooded animals including humans. 1 In immunocompetent individuals T. gondii generally causes subclinical chronic infections. On the other hand, in immunocompromised patients persistent T. gondii infections may initiate fatal toxoplasmic encephalitis (TE) as a result of tissue cyst reactivation.2,3 The mechanism(s) of reactivation of the tissue cysts in the central nerve system (CNS) of the animal models and humans harbouring a persistent infection and the pathogenesis of the neuropathology that occur with TE remain to be clarified.
Oxidative stress (OS) occurs when there is an imbalance between pro-oxidant and antioxidant factors and is induced by reactive nitrogen species (RNS) and highly reactive oxygen species (ROS).4,5 All cellular molecules such as lipids, proteins, and nucleic acids are vulnerable to oxidative damage. 4 Antioxidant systems play a synergistic role in removing free radicals. These antioxidant systems are supported by enzymes such as superoxide dismutase (SOD), glutathione reductase (GR), catalase, and glutathione peroxidase.6,7
OS is well known to cause damage in nuclear/mitochondrial (n/mt) DNA. If the antioxidative systems and DNA damage repair are insufficient, cellular dysfunction and ultimately apoptosis occur. 8 ROS and RNS cause neuronal damage by inducing a negative effect on neuronal and glial cells. In fact, neuronal cells are more susceptible to oxidative damage than the cells of other tissues. 9 OS impairs respiratory chain balance by causing mtDNA damage, negatively influences Ca2+ homeostasis, membrane permeability, and defense systems of mitochondria. 10 Along with these changes, there is an increase in the development of neurodegenerative diseases or triggering of neuronal dysfunction and neurodegeneration. In many neurodegenerative disorders OS is one of the major reasons for nerve damage. 11
Although there is evidence for the roles of OS in neurodegeneration, these issues in TE have not been clarified yet. Moreover, pathogenesis of neurodegeneration that occurs along with TE (chronic phase or after reactivation) is not fully defined. The aim of this study is to investigate the relationship of Cu/Zn SOD (SOD1), GR, and 8-hydroxy-2’-deoxyguanosine (8-OHdG) expression in a mice model of TE after 10 days (transition from the acute to the chronic period) and 30 days post infection with neuropathology related to TE and to demonstrate whether there is a correlation between neuropathology seen in TE and OS. The severity of degeneration was also investigated by the analysis of neuron specific enolase (NSE) expression.
Materials and methods
Ethics statement
This study was performed in strict accordance with the recommendations of the National Centre for the Replacement, Refinement, and Reduction of Animals in Research (NC3Rs). The protocol was approved by the Committee on the Ethics of Animal Experiments of Kirikkale University.
Animal infection model and experimental procedures
All animals (Swiss albino mice; age 12–16 weeks; weight 22–25 g; all female) were obtained from Saki Yenilli Experimental Animal Production Laboratory (Ankara, Turkey) and were continually monitored for survival, clinical condition, and weight until the time of tissue collection. The low-virulence ME-49 strain of T. gondii was used for infection as previously described by Atmaca et al. 12 Tissue cysts of T. gondii were harvested from the brains of mice that had been intraperitoneally inoculated with 20 tissue cysts. For experimental infection, mice were intraperitoneally inoculated with 15–20 ME-49 tissue cysts suspended in 0.25 mL of sterile physiologic saline. Typical symptoms of acute toxoplasmosis, including lethargy, ruffled fur, or hunched posture, were not observed after infection with tissue cysts. Animals were anesthetized with 20 mg/kg of ketamine and 5 mg/kg of xylazine. No animals died before the euthanasia process. They were then perfused transcardially with saline solution followed by formalin solution using a peristaltic pump. In groups of six, Swiss albino mice were sacrificed at 10 and 30 days after inoculation. Six healthy mice, sacrificed at the beginning of the study, were used as controls in immunohistochemical analysis.
Necropsy and histopathology
Mice were anesthetized with pentobarbital (10 mg/kg) and sacrificed by cervical dislocation. The brains were quickly removed. The squash smear technique was used to identify T. gondii tissue cysts in all sacrificed animals as previously described by Dincel and Atmaca. 13 Briefly, five small pieces (all infected group brains) taken from fresh brain tissue spread were randomly selected and placed onto the poly-L-lysine-coated glass slides. Sections were fixed in 10% neutral buffered formaldehyde for 1 min, rehydrated through graded series of alcohol for 1 min. Mayer’s hematoxylin was then applied for 30 s and sections were washed with distilled water. Thereafter, sections were dehydrated through a graded alcohol series for 1 min and cleared in xylene for 2 min and mounted on glass slides. Unstained and hematoxylin and eosin (H&E)-stained tissues were analyzed. Sections were fixed in 10% neutral buffered formaldehyde for 48 h and washed under tap water overnight. Following routine tissue preparation procedures, tissue samples were dehydrated through graded series of alcohol and xylene and embedded in paraffin blocks. Paraffin serial sections were cut at a thickness of 4–5 μm and mounted on glass slides. Brains were sectioned to 5-μm thickness, stained with H&E, and examined under a light microscope (Olympus BX51 microscope equipped with a DP25 camera, Japan). Sagittal cross-sections of the brains (healthy controls and infected groups) were investigated in this study.
Antibodies
Commercial anti-mouse antibodies against 8-OHdG (Santa Cruz Biotechnology, Dallas, TX, USA), GR (Santa Cruz Biotechnology), SOD1 (Santa Cruz Biotechnology), NSE (Abcam, Cambridge, UK), were used in this study.
Immunoperoxidase examination
Immunohistochemistry was performed to investigate 8-OHdG, SOD1, GR, and NSE expression. Commercial antibodies were visualized on 4- to 5-μm-thick paraffin sections using an indirect streptavidin/biotin immunoperoxidase kit (HRP; Thermo Scientific, Waltham, MA, USA). All steps were carried out following the procedure described by Dincel and Kul. 14 Accordingly, tissue sections were placed on adhesive slides, deparaffinized for 5 min in each of three xylene series, and rehydrated in a graded alcohol serie and distilled water. Antigen retrieval was accomplished by boiling sections on glass slides in citrate buffer (pH 6.0; Thermo Scientific) for 20 min. Endogenous peroxidase activity was quenched in 3% hydrogen peroxide in absolute methanol for 7 min at room temperature. Sections were rinsed three times with phosphate-buffered saline (pH 7.4) for 5 min between each step of the test. Sections were incubated in blocking serum for 5 min to prevent non-specific binding. Thereafter, sections were incubated with the primary antibody (8-OHdG, SOD1, GR, and NSE) for 60 min in a humidified chamber at room temperature. Sections were treated with a biotin-labeled secondary antibody for 15 min and streptavidin-peroxidase enzyme for 15 min at room temperature. Finally, sections were incubated in aminoethyl carbazole chromogen (Thermo Scientific) for 5–10 min to induce the color reaction. Mayer’s hematoxylin was applied as a counterstain for 1–2 min. Thereafter, sections were mounted with water-based mounting medium (Thermo Scientific). As a control for non-specific endogenous peroxidase and biotin activities in each test, the primary antibody step was omitted. Sections were immediately analyzed. Immunostaining was evaluated using a binocular microscope (Olympus BX51 microscope equipped with a DP25 camera, Japan) and photographed under a 20× objective.
Histomorphometric analysis and statistics
The density of positive staining was measured using a computerized image system composed of a Leica CCD camera DFC420 (Leica Microsystems Imaging Solutions, Ltd., Cambridge, UK), connected to a Lecia DM4000 B microscope (Leica Microsystems Imaging Solutions, Ltd.) and was used according to the procedure described by Dincel and Atmaca. 13 Five representative fields were selected under high-power view and consequtive pictures were captured by the Leica QWin Plus v3 software by a 20× objective (Leica Microsystems Imaging Solutions) at a setting identical to the image system for analysing. For examining the staining of each antibody, we used the same setting for all slides. Integrated optical density of all positive stainings of 8-OHdG, SOD1, GR, and NSE in each photograph were measured. For the quantification of the mean 8-OHdG-, SOD1-, GR-, and NSE-positive area/total area were measured and calculated by Leica Qwin Plus on the pictures. All images were collected under the same lighting conditions. To avoid observer bias, a blinded investigator quantified all of the sections. Data were statistically described in terms of mean and standard deviation (mean±SD) for area %. After calculating the proportion (% pixels) of stained area to the whole field, the mean (in % pixels) staining area for each slide was determined. Statistical analysis of 8-OHdG, SOD1, GR, and NSE immunohistochemical results were compared between groups using a one-way analysis of variance (ANOVA) and Tukey’s multiple comparison test. The data were presented as mean±SD. All statistical analyses and graphs were prepared using GraphPad Prism version 6.0 (GraphPad Software, La Jolla, CA, USA). P <0.05 was considered statistically significant.
Results
Histopathological findings
H&E-stained brain sections from control group animals exhibited normal architecture. Tissue cysts were observed in the 30 days post infection groups (Figure 1). The main neurohistopathological changes were characterized by non-suppurative and/or necrotizing non-purulent meningitis, neuronal degeneration (Figure 1a), focal gliosis (Figure 1b), hyperemia, perivascular mononuclear cell infiltration, and Purkinje cells/neurons that were shrunken and had a denser eosinophilic and necrotic appearance (Figure 1a). Glial proliferation was observed throughout the brain.

Histopathology of TE. (a) Toxoplasma gondii tissue cysts (arrow) and necrotic neuronal cells (arrowheads). H&E bar, 100 μm. (b) Toxoplasma gondii tissue cysts (arrowhead) and severe gliosis focus (arrow). H&E bar, 100 μm.
Immunoperoxidase findings
In this study, GR, 8-OHdG (nuclear and cytoplasmic), and NSE expressions were higher in the brain of T. gondii-infected animals at 10 and 30 days post infection than in healthy control animals (P <0.05). In contrast, SOD1 expression was markedly lower in T. gondii-infected animals at 10 and 30 days post infection than in healthy control animals (P <0.005). Statistical analysis of the data on GR, 8-OHdG, NSE, and SOD1 expression in the brain, measured by immunostaining in all the groups, are listed in Table 1.
Immunoperoxidase test results and statistical data.

DAI, days after inoculation.
8-hydroxy-2’ -deoxyguanosine (8-OHdG) expression
Fairly weak immunoreactivity for 8-hydroxy-2’-deoxyguanosine (8-OHdG) was observed in some glial/neuronal cells in healthy control animals (Figure 2a). 8-OHdG expression was observed in the nucleus as well as in the cytoplasm of neurons (Figure 2b), endothelial (Figure 2c), glial cells, and microglia/macrophages (Figure 2c, d), being more intense in the nucleus. Cytoplasmic immunoreaction was observed weaker with respect to nuclear staining. 8-OHdG expression in the CNS was statistically higher in T. gondii-infected animals at 10 and 30 days post infection than in healthy control animals (P <0.05). Some degenerative/necrotic neuronal and glial cells were not stained with 8-OHdG (Figure 2c).
8-OHdG immunohistochemistry. Healthy control group: (a) low expression of 8-OHdG in neuronal and microglia/macrophage cells. ABC technique (anti-8-OHdG), Mayer’s hematoxylin counterstain, bar, 100 μm. (b) Increased cytoplasmic and nuclear expression of 8-OHdG in neuronal cells (arrows) and nuclear expression of 8-OHdG in neuronal cells (arrowheads). ABC technique (anti-8-OHdG), Mayer’s hematoxylin counterstain, bar, 100 μm. (c) Increased cytoplasmic expression of 8-OHdG in endothelial cells (arrowhead) and no immunoreactivity in degenerative/necrotic neuronal cells (arrows). ABC technique (anti-8-OHdG), Mayer’s hematoxylin counterstain, bar, 100 μm. (d) Increased cytoplasmic and nuclear expression of 8-OHdG in neuronal cells (arrowheads). ABC technique (anti-8-OHdG), Mayer’s hematoxylin counterstain, bar, 100 μm.
The most conspicuous finding of the present study was that 8-OHdG expression markedly increased in neurons, glial cells, and microglia/macrophages (nuclear and cytoplasmic or just nuclear). In addition, 8-OHdG expression was only present in the cytoplasm of the endothelial cells.
8-OHdG expression at 10 days post infection was higher when compared with the 30 days post infection groups. However; the difference was not statistically significant between 10 and 30 days post infection (Figure 3).

Comparison of 8-OHdG immunopositivity. Statistical difference is indicated as letters. “a” represents values statistically higher than control group. However, the difference was not statistically significant between 10 and 30 days post infection groups. Statistical analysis was performed according to one-way analysis of variance and Tukey’s multiple comparison test. The values represent means ± SD. P <0.05 was considered statistically significant. DAI, days after inoculation.
This study showed that 8-OHdG, a pivotal marker for measuring the effect of endogenous oxidative damage to DNA, is a good biomarker for risk assessment of this disease. In addition, this biomarker might be used to estimate the DNA damage in humans/animals after exposure to T. gondii.
Glutathione reductase expression
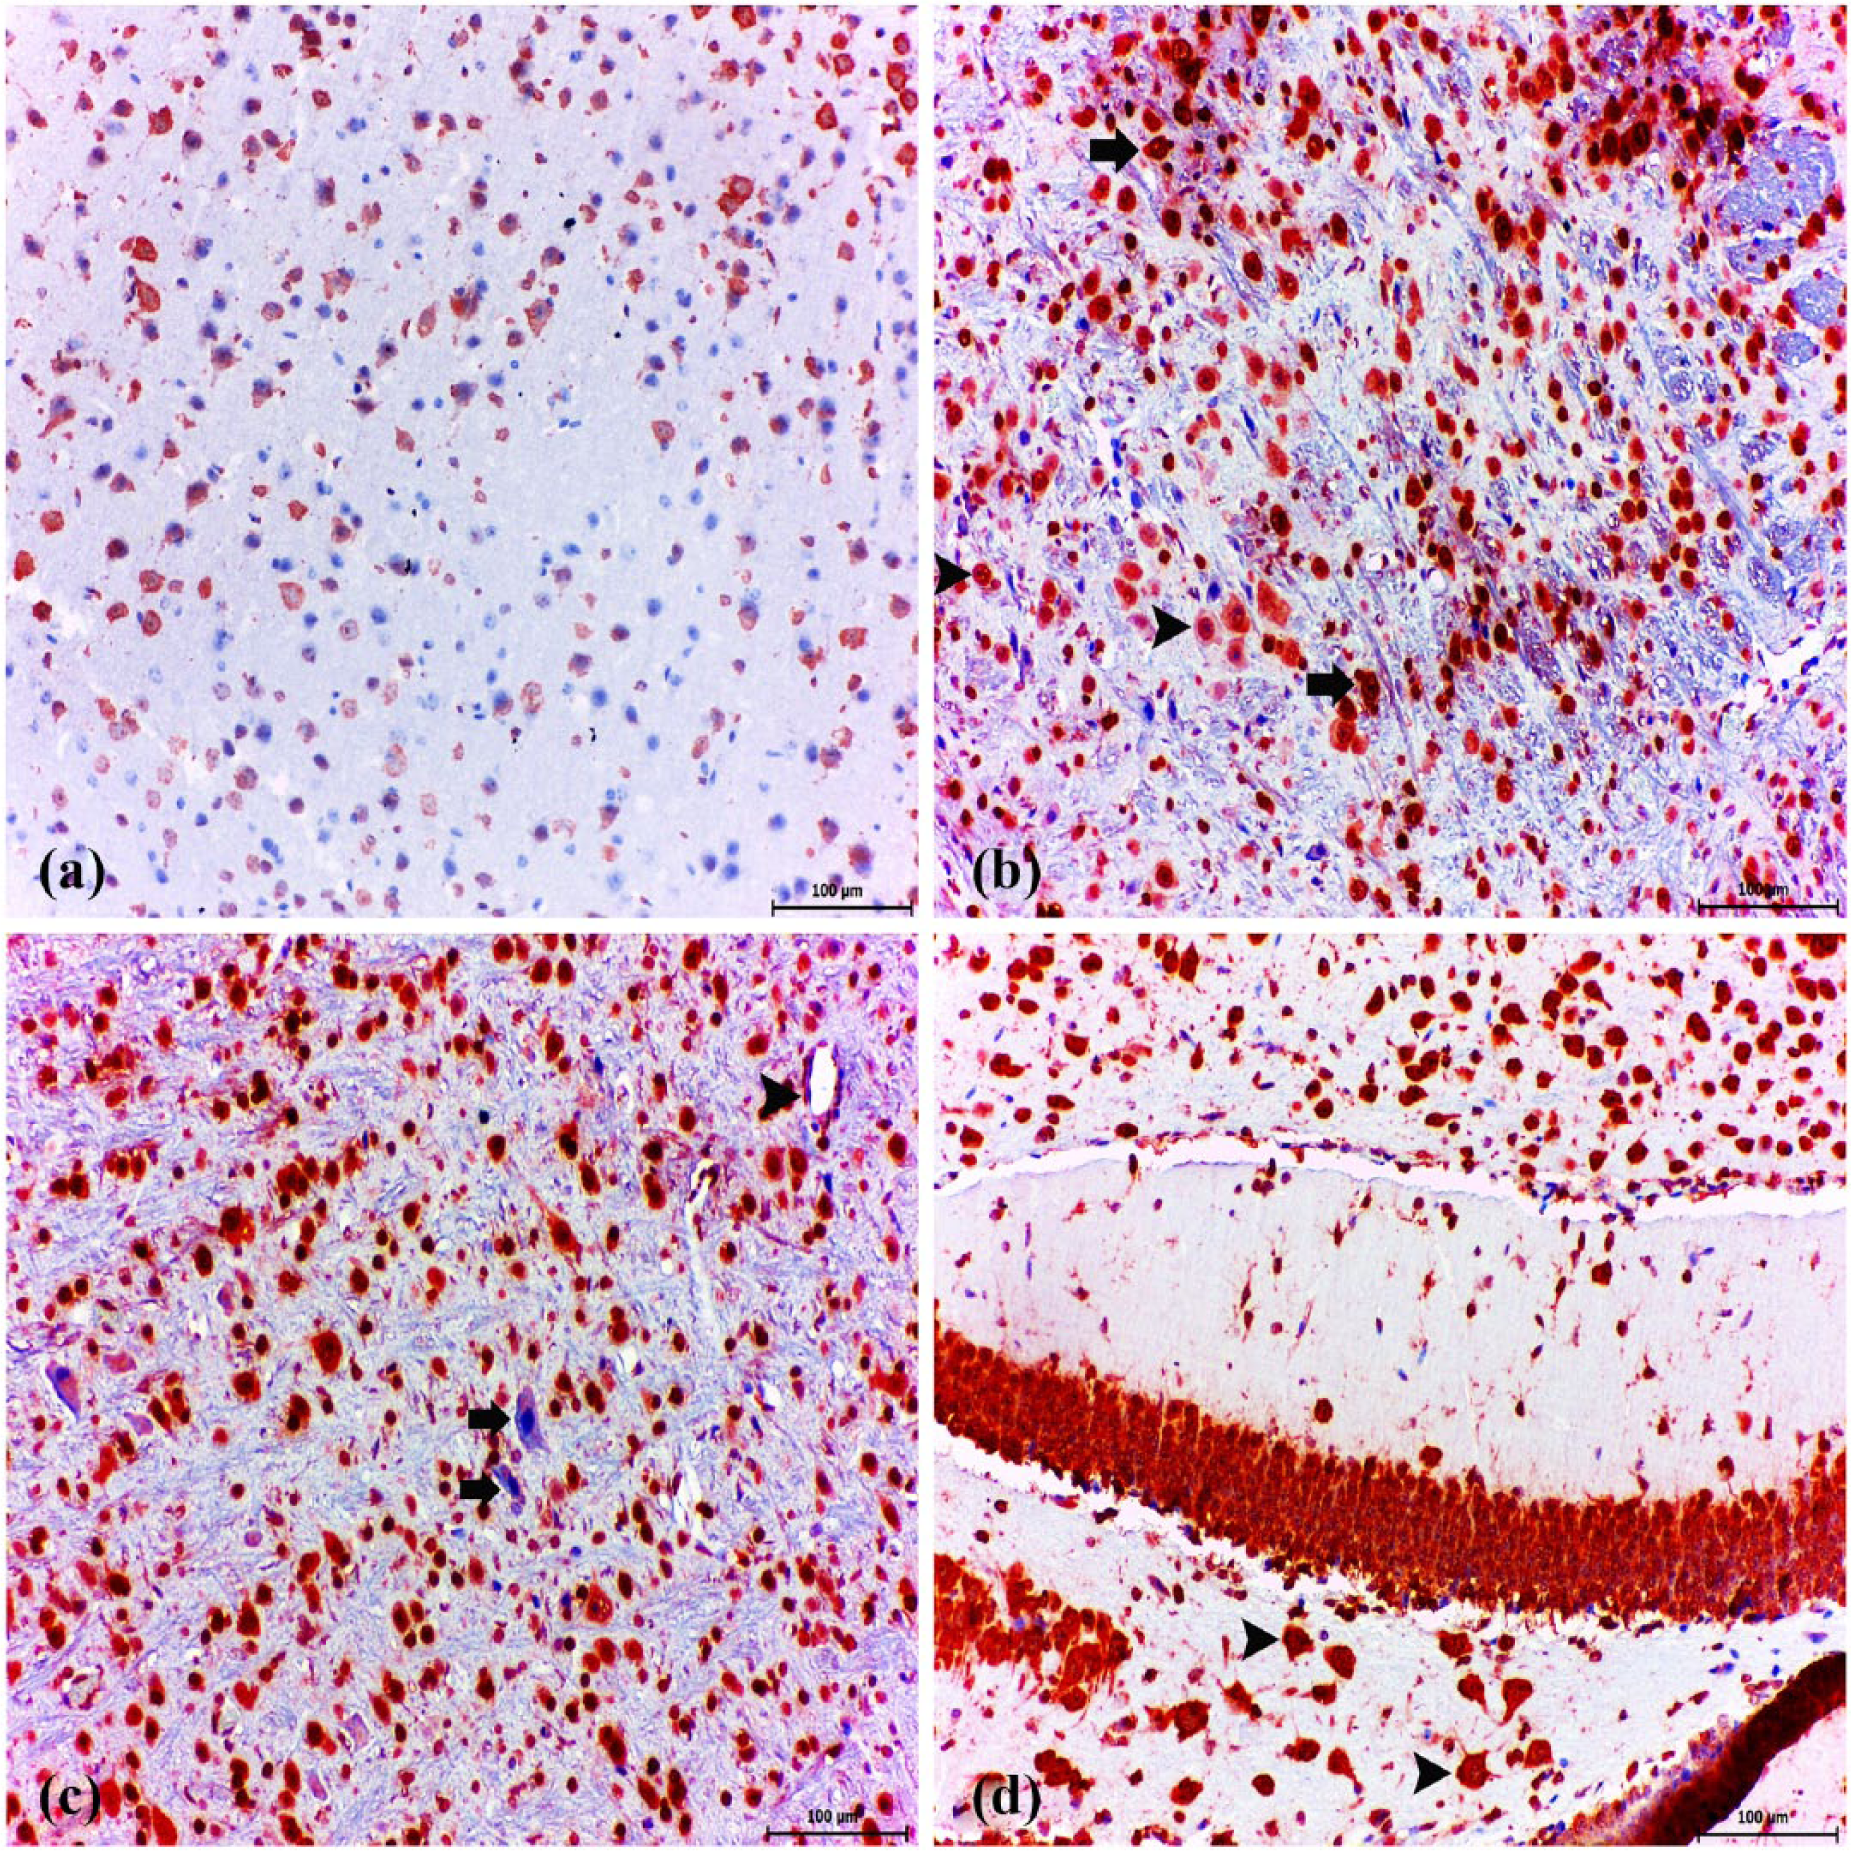
Fairly weak immunoreactivity for glutathione reductase (GR) was observed in some glial cells/neurons in healthy control animals (Figure 4a). GR expression increased significantly in the vascular endothelial, glial cells, and some necrotic/healthy neurons (Figure 4b, f), which was also significantly higher than the levels in the healthy control group (P <0.005).
GR immunohistochemistry. Healthy control group: (a) very slight expression of GR in brain. ABC technique (anti-GR), Mayer’s hematoxylin counterstain, bar, 100 μm. (b) Strong expression of GR in endothelial cells and perivascular infiltrating macrophages. ABC technique (anti-GR), Mayer’s hematoxylin counterstain, bar, 100 μm. (c) Dense reactive bands were highly accumulated around the neuronal cells (arrowheads) and within the space. ABC technique (anti-GR), Mayer’s hematoxylin counterstain, bar, 50 μm. (d) Strong expression of GR in neuronal (arrowheads) and glial cells (arrows). ABC technique (anti-GR), Mayer’s hematoxylin counterstain, bar, 100 μm. (e) Strong GR immunopositive infiltrating macrophages were observed in meningitis area and soluble antigen in blood vessels. ABC technique (anti-GR), Mayer’s hematoxylin counterstain, bar, 100 μm. (f) Strong expression of GR in neuronal (arrowheads) and glial cells (arrow). ABC technique (anti-GR), Mayer’s hematoxylin counterstain, bar, 50 μm.
Another conspicuous finding of the present study was that strong GR expression markedly increased in the infiltrating mononuclear cells and infiltrating microglia/macrophages in the meninges at 10 and 30 days post infection (Figure 4b, e).
Immunoreactivite stainning areas were also scattered in the intercellular matrix between the neurons (Figure 4c). In addition, GR expression was noticed in a form of dense bands at the periphery of the neurons. Importantly, dense reactive bands were highly accumulated around the neurons (Figure 4c, d). Soluble GR antigen staining was observed in the lumen of vessels (Figure 4b, e).
GR expression at 10 days post infection was statistically higher when compared with the 30 days post infection groups. GR expression at 30 days post infection was statistically lower when compared with the 10 days post infection groups (Figure 5).

Comparison of GR immunopositivity. Statistical difference is indicated as letters. “a” represents values statistically higher than the control group; “b” represents values statistically lower than 10 DAI; “c” represent values statistically higher than 30 DAI. Statistical analysis was performed according to one-way analysis of variance and Tukey’s multiple comparison test. The values represent means ± SD. P <0.05 was considered statistically significant. DAI, days after inoculation.
Cu/Zn superoxide dismutase (SOD1) expression
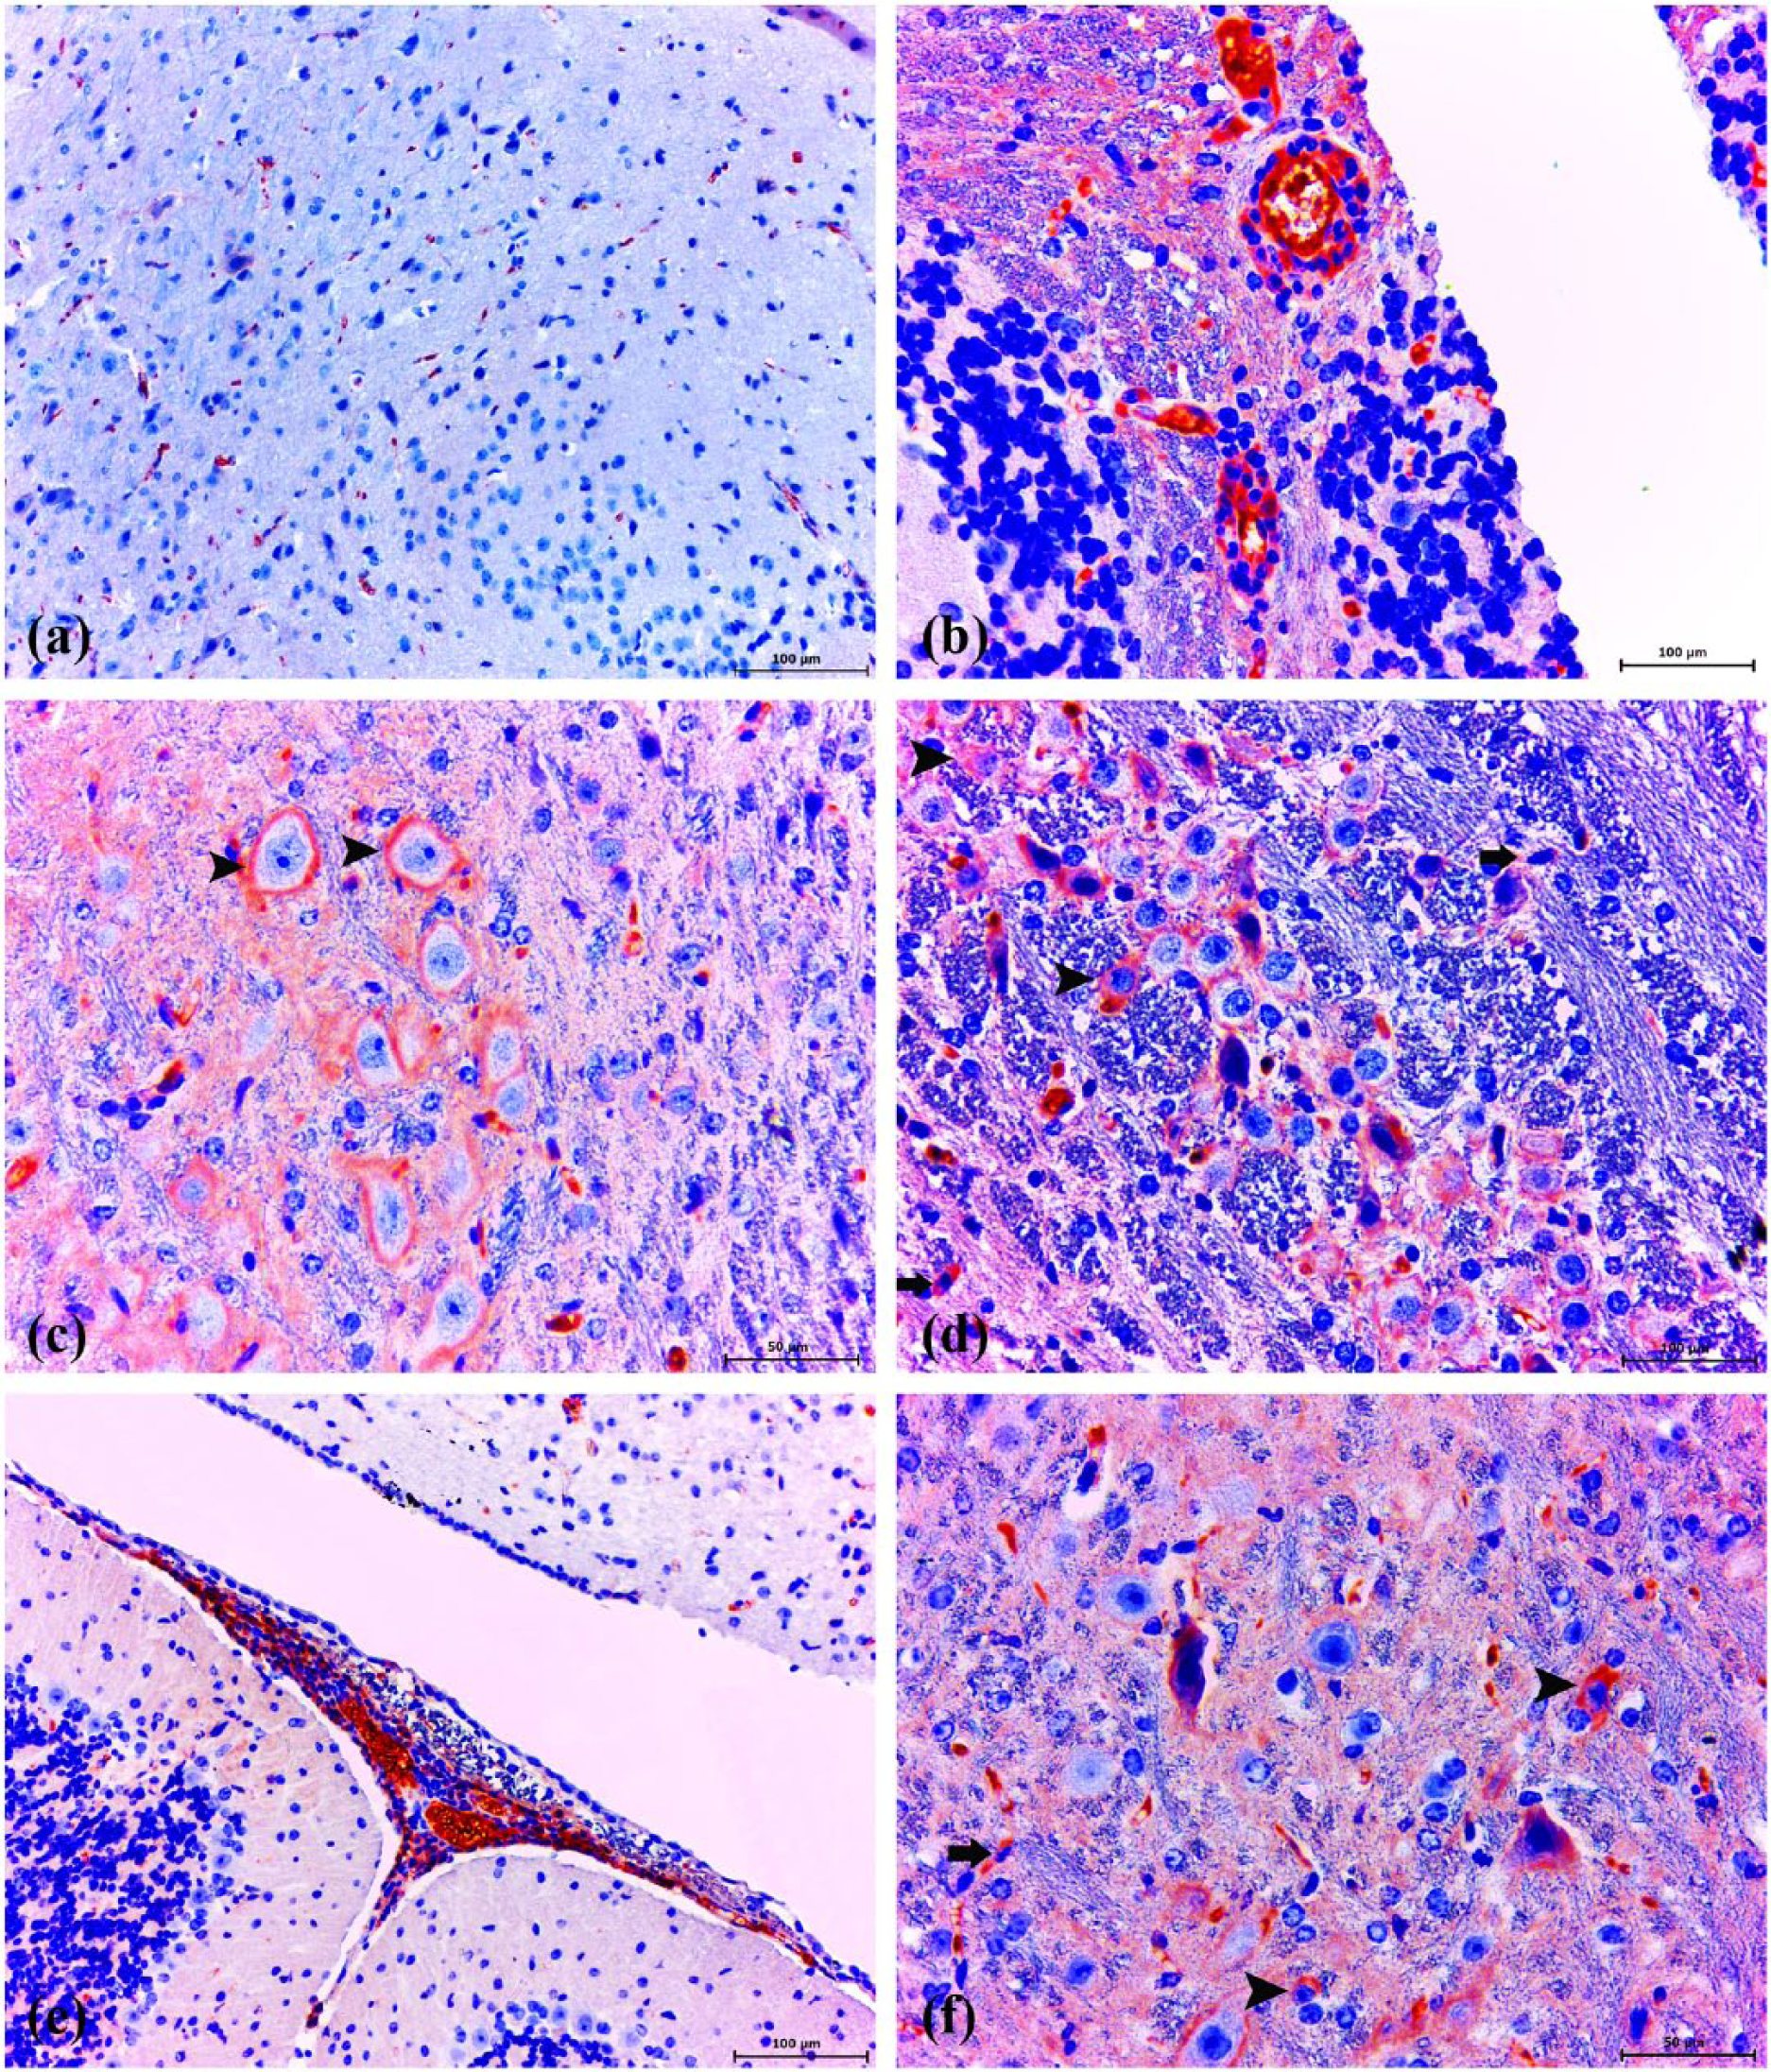
Strong/moderate Cu/Zn Superoxide dismutase (SOD1) expression was observed in neuronal and glial cells in healthy control animals (Figure 6a). Another conspicuous finding of the present study was that SOD1 expression was markedly decreased in the neurons, glial cells, and microglia/macrophages (Figure 6b, c, d), which was also significantly lower at 10 and 30 days post infection than the levels in the control group (P <0.005). We detected that a very essential antioxidant marker, SOD1, was significantly downregulated at 10 and 30 days post infection with T. gondii in CNS.

SOD1 immunohistochemistry. Healthy control group: (a) strong/moderate expression of SOD1 in neuronal and glial cells. ABC technique (anti-SOD1), Mayer’s hematoxylin counterstain, bar, 100 μm. (b) Very slight expression of SOD1 in neuronal and glial cells. ABC technique (anti-SOD1), Mayer’s hematoxylin counterstain, bar, 100 μm. (c) Very slight expression of SOD1 in neuronal/glial cells and Toxoplasma gondii tissue cysts (arrowheads). ABC technique (anti-SOD1), Mayer’s hematoxylin counterstain, bar, 100 μm. (d) Very slight expression of SOD1 in neuronal and glial cells. ABC technique (anti-SOD1), Mayer’s hematoxylin counterstain, bar, 100 μm.
SOD1 expression at 10 days post infection was statistically lower compared with the 30 days post infection groups. SOD1 expression at 30 days post infection was statistically higher when compared with the 10 days post infection groups (Figure 7).

Comparison of SOD1 immunopositivity. Statistical difference is indicated as letters. “a” represents values statistically lower than control group; “b” represents values statistically higher than 10 DAI; “c” represents values statistically lower than 30 DAI. Statistical analysis was performed according to one-way analysis of variance and Tukey’s multiple comparison test. The values represent means ± SD. P <0.05 was considered statistically significant. DAI, days after inoculation.
Neuron-specific enolase expression
Fairly weak immunoreactivity for neuron-specific enolase (NSE) was observed in neurons in healthy control animals (Figure 8a). Intense immunoreactivity for NSE expression was observed in cerebral sections and cerebral cortex. There was a statistically significantly higher incidence of positive NSE immunoreactivity in neurons (Figure 8b, c, d) than the levels in the healthy control group (P < 0.005).

NSE immunohistochemistry. Healthy control group: (a) very slight expression of NSE in neuronal cells. ABC technique (anti-NSE), Mayer’s hematoxylin counterstain, bar, 50 μm. (b) Strong expression of NSE in neuronal cells. ABC technique (anti-NSE), Mayer’s hematoxylin counterstain, bar, 100 μm. (c) Strong expression of NSE in neuronal cells (arrowheads). ABC technique (anti-NSE), Mayer’s hematoxylin counterstain, bar, 50 μm. (d) Toxoplasma gondii tissue cysts (arrow) and strong expression of NSE in neuronal cells (arrowheads). ABC technique (anti-NSE), Mayer’s hematoxylin counterstain, bar, 50 μm.
NSE expression at 10 days post infection was statistically higher when compared with the 30 days post infection groups. NSE expression at 30 days post infection was statistically lower when compared with the 10 days post infection groups (Figure 9).
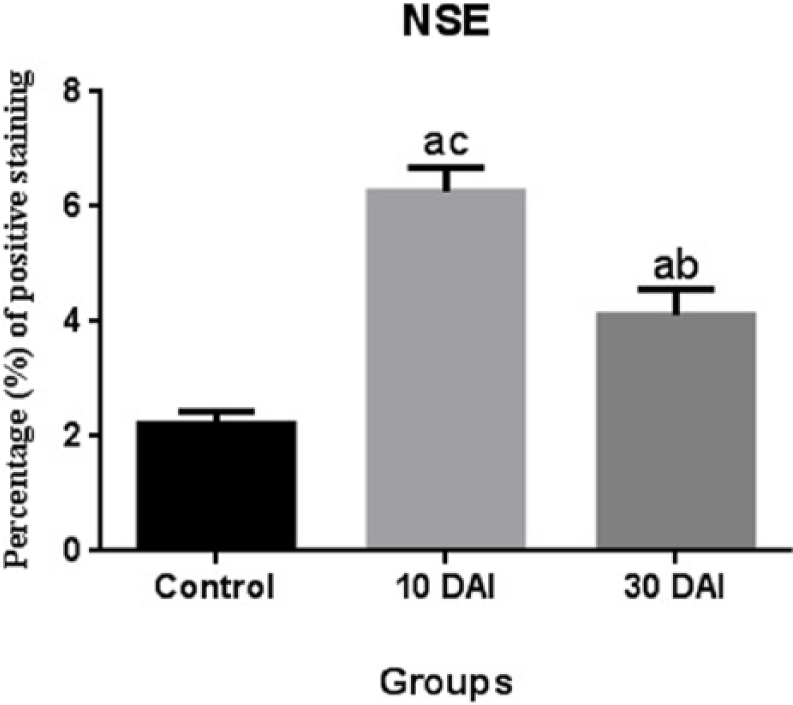
Comparison of NSE immunopositivity. Statistical difference is indicated as letters. “a” represents values statistically higher than control group; “b” represents values statistically lower than 10 DAI; “c” represents values statistically higher than 30 DAI. Statistical analysis was performed according to one-way analysis of variance and Tukey’s multiple comparison test. The values represent means ± SD. P <0.05 was considered statistically significant. DAI, days after inoculation.
This may provide a potential cerebrospinal fluid (CSF) biomarker for TE. An increase of CSF NSE as an indicator of T. gondii-related neuropathy. NSE expression might be used for diagnosis, to determine the severity of acute TE and for the treatment of TE.
Discussion
In immunocompromised patients with chronic toxoplasmosis as a result of reactivation of tissue cysts severe and fatal TE occurs.2,3 Ten days post infection is an infection period, an acute phase, or the very beginning of the chronic phase where significant level of TE is observed. Although there have been studies on the pathogenesis of TE-related neuropathology, there are still many unresolved questions. In this study, we show that OS resulting from T. gondii infections plays an important role in the TE mediated neuropathology. In addition, the severity of these degenerations was indicated with NSE expression analysis.
The relationship between OS and apoptosis of neuronal as well as other cells has been a long-studied issue and OS is considered to be one of the most important factors that causes apoptosis. 15 In apoptosis seen in diseases caused by gram-negative bacteria and Fasciola hepatica, OS was shown to play an important role.16,17 ROS generation, DNA damage, and OS induce apoptosis and there are studies showing that it is through TNF- and Fas-mediated extrinsic apoptotic pathways.18,19 These three factors were also shown to induce an intrinsic apoptotic pathway. 20 Mitochondria have important cellular functions such as calcium regulation, ATP production, control of apoptosis, and free radical scavenging. 21 In neuronal cells mitochondrial dysfunction that occurs due to the production of ROS substantially triggers OS and increases cytosolic calcium, cytochrome c release, and activation of caspase 9 and caspase 3 through mitochondrial permeability transition pore openings and eventually internal apoptosis occurs.22,23 OS causes DNA damage in the mitochondria and impairs the mitochondrial respiratory chain balance, influences Ca2+ homeostasis, and affects mitochondrias defense systems. Along with these changes, there is a subsequent increase in the triggering of neurodegenerative diseases or neuronal dysfunctions and neurodegeneration.10,24 ROS production and mitochondrial dysfunction related apoptosis play a role in the pathogenesis of common neurodegenerative diseases such as Parkinson’s disease, 25 Alzheimer’s disease, 26 and epileptic seizures. 27 According to our previous reports, in the pathogenic process of TE, high levels of nitric oxide (NO) are produced and there is an imbalance of apoptosis regulation.13,28 Apart from severe NO production in glial and neuronal cells, and apoptosis that is triggered by intrinsic or extrinsic pathways, here we show that OS also plays a significant role in the induction of neurodegeneration/neuropathology. In addition, we observed that OS might also induce both internal and external apoptotic pathways. However, the key events and the exact mechanisms underlying this disease remain unclear.
SOD is an important endogenous enzymatic antioxidant that protects cells from OS-related apoptosis. 29 Superoxide radicals are effectively detoxified by both sides of mitochondrial inner membranes: by Cu/Zn SOD (SOD1, localized in the intermembrane space) and Mn-SOD (SOD2, localized in the matrix).30,31 Troy et al. have reported that apoptosis is triggered in neuronal cells as a result of downregulation of SOD. 32 Nevertheless, Greenlund et al. indicated that upregulation of SOD in neurons causes a delay in apoptosis. 33 There are studies showing that NO inactivates some of the antioxidant enzymes such as catalase, glutathione peroxidase, and SOD.34,35 In the study by Karaman et al., high levels of malondialdehyde were detected in the serum of T. gondii seropositive patients and the chronic toxoplasmosis tissues showed a significant decline in the activity of antioxidant defense system that protects cells from free radical damage. 36 In this study, we found that the expression of SOD1 was seriously downregulated in the 10 and 30 days post-infected mice brain in comparison to the healthy control group. In addition to this, both cytoplasmic and nuclear staining of 8-OHdG (an important OS marker that is induced by DNA damage) was induced, indicating that there is n/mt DNA damage in CNS. GR plays essential roles in the antioxidant defense mechanism by ensuring the continuation of enzymatic activity of the metabolism and protein functions. 37 Its activity was found to be severely increased which shows that it intervenes as a powerful defense mechanism upon the T. gondii-related oxidative damage. It is quite clear that downregulation of the antioxidant enzyme SOD plays an important role in the cause and effect relationship with a high level of NO production and apoptosis (intrinsic and extrinsic). In the light of these findings, it is quite clear that in the CNS of TE mice brain, downregulation of SOD1 through OS that is induced by severe levels of NO, or directly T. gondii itself plays a key role in the induction of apoptosis.
The blood–brain barrier (BBB) is a physical and metabolic barrier between the peripheral circulation and CNS and is very essential for the stability of the existing regulation and protection of the CNS microenvironment. 38 In the inflammation of CNS and neuropathology that may occur subsequently, a damaged BBB and migration of activated leukocytes to the parenchymal perivascular spaces play a critical role. 39 OS induces breakdown of the BBB via disruption of tight junction proteins and increasing BBB permeability, along with alteration of the blood flow.40,41 Thus, OS and damaged BBB cause subsequent neurotoxicity and eventually cognitive impairment occurs. 40 Moreover, NO was shown to increase BBB permeability in in vitro and in vivo studies.42,43 In our studies we found perivascular mononuclear cell infiltration, antigens of T. gondii in neuronal and glial cells, multifocal gliosis, and severe neurodegeneration, together showing a serious increase in BBB permeability. As a result of this increase in BBB permeability, it is thought that neurons, endothelial, and glial cells may be infected faster with the agent and a more severe inflammatory process is triggered. At this point, expression of glial fibrillary acidic protein (GFAP) plays a vital role in maintaining the structural integrity of the white matter and BBB. 44 In our previous study in TE mice, pathological levels of GFAP, endothelial nitric oxide synthase (eNOS), inducible nitric oxide synthase (iNOS), and neuronal nitric oxide synthase (nNOS) were only found in the first 30-day period after infection. Physiological levels of GFAP and NO production were found at 60 days post infection. 13 In our latter study, we have shown that the expression of a disintegrin and metalloprotease with thrombospondin type I repeats-13 (ADAMTS-13) is an indication of increased BBB permeability and existing damage in the BBB in TE. 28 We have even discussed that ADAMTS-13 may present protective effects on the BBB. In this work, it is quite clear that severely triggered OS causes damage to the BBB. In summary, in TE, NO that is produced at very high levels is thought to cause an increase in BBB permeability along with OS.
NO increases fluid shear stress and the largest contribution to this is provided by eNOS. 45 We have recently showed that in experimental TE mice brain: (1) eNOS is severely expressed in glial cells, neurons, and particularly in endothelial cells; (2) nNOS is expressed in neurons at severe levels; (3) iNOS is severely expressed in focal gliosis, microglia/macrophages, and in particular glial cells in the surrounding vasculature; and (4) ADAMTS-13 is highly expressed in neurons, endothelial, and glial cells.13,28 Altogether, these altered expressions indicate that there is an increase in the fluid shear stress in the TE brain. There are studies showing that fluid shear stress increases due to the OS. 46 We believe that severe OS and downregulation of SOD1 have an important contribution to the occurrence of fluid shear stress in TE. Therefore, in the pathogenesis of fluid shear stress, the key role is perhaps played by the synergistic effect of OS and NO. Thus, in order to prevent the fluid shear stress, antioxidants and inhibition of NO production may be therapeutically used.
It was mentioned that NSE may be used as a marker to identify the severity of the neuronal damage after cerebral ischemia. 47 In this study we show a statistically significant increase in the expression of NSE, confirming the severity of degeneration in the CNS in TE. Therefore, NSE expression may be used to comment about the severity of neuronal degeneration that occurs in TE. We have previously showed increased expression of GFAP and feurofilament (NF) in the TE brain. 13 In this study, along with NSE expression we contribute more to the interpretation of TE-related neuropathology. To sum up, along with these studies we believe that the positive correlation between NSE-GFAP-NF suggests that it may be a powerful marker for commenting on the severity of the pathology and neurodegeneration seen in CNS and may be used in clinic for determination of the disease course.
Leukocytes and other phagocytes destroy bacteria, parasites, and virus-infected cells by producing very strong oxidants such as NO, O2, and H2O2 and thus protect the organisms from infection. However, they cause oxidative damage and mutation to DNA.48,49 Studies show that NO plays a significant role both as pro-oxidant and antioxidant in mitochondrial ROS-related pathology. 50 Low NO concentrations play a very important antioxidative role by protecting cells from OS. 51 But during the chronic inflammatory processes, high levels of NO are produced and this draws attention as a very important pro-oxidant and toxic factor.52,53 Hence the severely expressed NO that originates from nNOS, eNOS, and iNOS 13 is considered to be the first major source of OS. Therefore, it is clear that NO at pathological levels and OS are important in the pathogenesis of this disease.
A noteworthy point is that there are studies revealing a close relationship between TE and schizophrenia, suggesting that T. gondii may cause schizophrenia.54,55 The pathogenesis of schizophrenia shows great similarities with the pathogenesis of TE that was shown in this and earlier studies made with the TE model. In schizophrenia: (1) NO also plays an important role in the pathophysiology of schizophrenia, acting as a neurotoxin by interacting with thiol groups of the proteins and decomposing into the highly reactive hydroxyl radicals;56,57 (2) significant levels of OS is also present in the schizophrenia patients; 58 and (3) SOD activities are also significantly lower than those in healthy control groups. 59 We believe that all these similarities cannot be a pure coincidence. In our previous studies, we showed that severely produced NO mediates TE. Findings of this study are considered to be very similar to pathogenesis of schizophrenia, showing significantly lower levels of that SOD activity than those in healthy subjects and severe OS. Considering all, it is a strong hypothesis that T. gondii may cause schizophrenia by inducing OS and NO production at pathological levels. Therefore, this may be the answer for why there are analogies in the pathogenesis of these two diseases.
To conclude, our research shows that apoptosis and neuropathology occurring in the CNS of the TE brain are extremely complex processes. OS has been defined as the principle pathological cause of neurodegeneration. This study reasonably suggests that the role of OS might be a key mechanism implicated in the pathogenesis of TE. We think that OS and apoptosis are results of ROS and RNS generated from activated microglia/macrophages and other glial cells and NO production at pathological levels that is induced by increased expression of eNOS, iNOS, and nNOS in neuron, endothelial, and glial cells. Oxidative damage plays a role in worsening the disease course and may cause poor outcome of TE even though it may not be the main or only reason for them. Subsequent to these findings, NSE expression gives information about the severity of the disease and disease course during the follow-up, and we think that NSE-NF-GFAP expression can be used in clinics.
Footnotes
Authors’ note
This study was presented as an oral presentation in the combined 33rd Annual Meeting of The European Society of Veterinary Pathology, the 26th Annual Meeting of The European College of Veterinary Pathologists, and the 39th Annual Meeting of Nordic Society for Veterinary Pathology Annual Meeting, 2–5 September 2015, Helsinki, Finland.
Declaration of conflicting interests
The author(s) declared no potential conflicts of interest with respect to the research, authorship, and/or publication of this article.
Funding
This work was funded and supported by the Scientific Research Projects Commission of the Gümüşhane Univesity, Gümüşhane, Turkey (Project Code: 13.B0421.02.02).