
Abstract
Exogenous and endogenous formaldehyde (FA) both play an important role in cell growth and migration; however, their potential role in osteoblasts remains largely unclear. Cell counting kit-8 (CCK-8) and wound-healing assays revealed that FA exposure at naturally occurring concentrations inhibited the proliferation and migration of mouse preosteoblast MC3T3-E1 cells. Moreover, RNA sequencing (RNA-seq) analysis revealed that FoxO1 signaling pathway components displayed distinct expression patterns upon FA exposure, reflected through significant enrichment of cell migration. In particular, FoxO1-, Sirt1-, and FA-induced protein expression, which was closely associated with cell proliferation and migration, was confirmed by western blotting. The results obtained indicated that the FoxO1 pathway is involved in FA-induced inhibition of cell growth and migration.
Introduction
Osteoblast growth and migration are essential for bone metabolism, including bone remodeling and responses to mechanical loading, as well as bone pathological processes, including bone repair after fractures and during osteoporosis. 1 –3
Formaldehyde (FA) is one of the primary factors implicated in sick building syndrome. FA enters the body through inhalation from construction material, furniture, tobacco smoke, e-cigarettes, and the sweetener aspartame; however, the most direct entrance mechanism is the accidental consumption of methanol and insulation materials. 4,5 The WHO-recommended limit for indoor FA is 0.1 mg/m3. However, indoor FA concentrations often exceed this recommended threshold. The average concentration of occupational FA exposure in Chinese factories is 1.37 mg/m3, which also exceeds the recommended threshold. 6 Simultaneously, FA is present in the natural environment, thus making it difficult to prevent FA exposure. 7
Furthermore, FA is produced endogenously, being found ubiquitously in cells, owing to enzymatic oxidative demethylation by-products. Histones of the KDM1/JMJC or ABH enzyme family and the RNA and DNA demethylation machinery produce FA in the nucleus. 8,9 Moreover, FA can be endogenously produced by the action of neutrophil enzyme myeloperoxidase and N-demethylation, a common biochemical phenomenon. Endogenous FA is present in the blood at 50–100 μM. 10 –12
Therefore, because of its abundance and chemical properties, FA poses a significant risk to genomic integrity. However, limited information is available regarding the mechanisms underlying protection against FA at the cellular and organismal levels. It is unclear whether FA affects bone cells, especially osteoblasts and their proliferation and migration, which play essential roles in bone-associated diseases, e.g. bone repair during fracture and osteoporosis.
The present study aimed to characterize the effect of FA on osteoblast growth and migration. First, we investigated the effect of FA on mouse preosteoblast MC3T3-E1 cells; thereafter, we attempted to determine the key signaling pathways affected in osteoblasts upon FA exposure via genome-wide transcriptional profiling analysis using RNA-seq.
Materials and methods
Cell culture
MC3T3-E1 cells were purchased from the ATCC (Manassas, VA, USA). Cells were cultured in a humidified atmosphere of 5% CO2 and 95% air at 37°C in an alpha modification of Eagle’s medium (Invitrogen Life Technologies, Carlsbad, CA, USA) supplemented with 10% FBS, 100 U/mL penicillin, and 0.1 mg/mL streptomycin. 13
Cell proliferation
Cell proliferation was assessed via a colorimetric tetrazolium salt-based assay, i.e. CCK8 assay. MC3T3-E1 cells were seeded at a density of 5000 cells/well into a 96-well plate and cultured in the presence/absence of FA at different concentrations (100 μM–500 μM). Thereafter, the CCK-8 solution (Dojindo, Rockville) was added to each well, and the plate was incubated at 37°C in a CO2 incubator for 3 h. The absorbance was then determined at 450 nm, using a microplate reader (Bio-Rad, Hercules, CA, USA).
Wound-healing assay
Cells were seeded in a six-well plate the day before the assay, and cells were pretreated with FA for 2 h, 6 h, or 12 h before wounds were inflicted on the cell monolayer. The wound was generated by scratching the cell monolayer with a pipette tip. The cells were washed with PBS three times to remove the floating cells, and were cultured in serum-free medium, and images were acquired at 0 h, 12 h, and 24 h after wounding. The degree of cell migration required to close the wound was analyzed using ImageJ software (National Institutes of Health, Bethesda, MD, USA).
RNA preparation
Total RNA was extracted using TRIzol reagent (Invitrogen, CA, USA, 15596026) on dry ice and processed in accordance with the manufacturer’s instructions. To eliminate DNA, an aliquot of total RNA was treated with RQ1 RNase-Free DNase (Promega, WI, USA, M6101), followed by phenol/chloroform/isoamyl alcohol extraction and chloroform/isoamyl alcohol extraction, using Phase Lock Gel Light tubes (5 PRIME 2302800), followed by ethanol precipitation. Precipitated RNA was stored at −20°C until use.
Illumina RNA-Seq library construction
Total RNA (20 μg) was used for poly(A)t selection using oligo(dT) magnetic beads (Invitrogen, CA, USA, 610-02), eluted in water, and used to generate an RNA-seq library, using the ScriptSeq kit (Epicentre, CA, USA SS10906). Libraries were amplified via polymerase chain reaction for 12–15 cycles and sequenced in two lanes on the HiSeq 2000 platform at BGI Genome Center (Shenzhen, China).
RNA sequencing
High-throughput sequencing was performed as paired-end 100 sequencing, using a HiSeq 2000 system (Illumina, San Diego, CA, USA). RNA-Seq reads were mapped using TopHat software (http://tophat.cbcb.umd.edu) to generate the alignment file, which was then used to assemble transcripts, estimate abundance, and detect differential expression of genes/isoforms, using cufflinks. Gene classification was based on searches in the DAVID (david.abcc.ncifcrf.gov) and MEDLINE (www.ncbi.nlm.nih.gov) databases. All RNA-seq data are available on https://www.ncbi.nlm.nih.gov/geo/query/acc.cgi?acc=GSE151037.
Illumina data analysis
Raw reads were aligned to the B73 reference genome (RefGen v3), using TopHat 2.0.8 and STAR, with the minimum intron length set at 20 bp and the maximum intron length set at 50 kb, with default settings for other parameters. Genes and isoforms were quantified using cufflinks version 2.2.1, using the GTF annotation file generated by PacBio sequencing. To reduce transcriptional noise, only isoforms/genes with FPKM values of ≥0.01 (based on gene coverage saturation analysis) were included.
Reverse transcription quantitative PCR (RT-qPCR)
Cells were seeded in a six-well plate the day before total RNA extraction, and cells were pretreated with FA for 6 h before the assay on the cell monolayer. cDNA was prepared using the MMLV Reverse Transcriptase (Fermentas). Relative quantitation was performed according to the manufacturer’s instructions of SYBR Green PCR Master Mix kit (Roche, Switzerland). ACTB (β-actin) was used as the internal control. The cycling conditions were all as follows: incubation at 95°C for 10 min, 40 cycles of denaturation at 95°C for 15 s, annealing at 60°C for 20 s, and extension at 72°C for 20 s. The expression level of targeted gene was analyzed by 2−ΔΔCt method. RT-qPCR was repeated three times. The primer sequences for each gene are listed below.

In silico analysis
To identify the pathways of intersecting genes, pathway enrichment analysis was performed using the Kyoto Encyclopedia of Genes and Genomes (KEGG, http://www.genome.ad.jp/kegg/). This analysis provides a better understanding of gene expression as a complete network. The Fisher’s exact test and Chi-square test were performed, and the threshold for statistical significance was defined by a P-value of <0.05 and the false discovery rate. Furthermore, we performed gene set enrichment analysis, using GSEA v2.2.2 software and a c5.all. v5.1. symbols.gmt (gene ontology)-gene set matrix.
Western blot analysis
MC3T3-E1 cells were cultured in a 10-cm culture dish at a density of 5 × 10⁵ cells/mL at 37°C under 5% CO2 in medium supplemented with FA at different concentrations. Thereafter, cells were harvested, and the sediment/debris in the cell extracts were separated via centrifugation (Thermo Scientific, CA, USA). Protein concentrations were determined using the BCA protein assay kit (Thermo Scientific). Protein samples (50 µg each) were separated via SDS-PAGE (12% resolving gel) and then transferred to polyvinylidene difluoride membranes. The membranes were blocked with blocking solution containing 3% BSA and 0.1% Tween-20 for 30 min and probed overnight at 4°C with the following primary antibodies: anti-FoxO1, anti-Sirt1, anti-Prmt6, anti-Suz12, anti-Ezh2 (1:500 each) (Merck Millipore, Darmstadt, Germany), and anti-GAPDH (1:5000) (Bioworld Technology, Saint Louis Park, MN, USA). The membrane was then probed with HRP-labeled goat anti-rabbit IgG (H + L) secondary antibody (1:1000; KPL, Milford, MA, USA) for 1 h. Finally, protein bands were detected using DAB reagent. Relative protein expression levels were determined using Quantity One (Bio-Rad).
Statistical analysis
Unless indicated otherwise, data are presented as mean values ± standard deviation (SD) values and analyzed using one-way ANOVA, followed by the Dunnett multiple comparison test for post hoc analysis. A p value <0.05 was considered statistically significant. Data were analyzed using SPSS11 (Chicago, IL, USA) statistical software.
Results
Effect of FA on osteoblast proliferation
The effect of FA on the proliferation of MC3T3-E1 osteoblasts was determined using the CCK-8 assay. As shown in Figure 1, cell proliferation was observed upon treatment with FA at different concentrations for 2 h (Figure 1a) and 6 h (Figure 1b). Typically, each group treated with 100 μM, 150 μM, 200 μM, 300 μM, and 500 μM FA displayed markedly inhibited proliferation in comparison with untreated cells; it was observed that the duration of FA treatment was directly proportional to the inhibition of cell proliferation. These results notably indicate the strong inhibitory effect of FA on MC3T3-E1 cells through reduced viability in a dose-dependent manner within 0–96 h.

Effects of formaldehyde (FA) on the viability of MC3T3-E1 cells. MC3T3-E1 cells were treated for 2 h (a) and 6 h (b) with the control or with FA at different concentrations, and cell viability was examined using the cell counting kit-8 assay at 0 h, 24 h, 48 h, 72 h, and 96 h. The results are expressed as the mean ± SD values of at least three independent experiments. *p < 0.05, **p < 0.01.
Effect of FA on osteoblast migration
We investigated the effect of FA on the migration of MC3T3-E1 cells, using a wound-healing assay. Upon treatment of cells for 2 h, 6 h, and 12 h with 100 μM, 150 μM, 200 μM, 300 μM, and 500 μM FA, respectively, wounds were inflicted on the surface of the confluent cellular monolayer surface, and cells were allowed to migrate for 12 h and 24 h.
The wound-healing assays showed that 200 μM to 500 μM FA significantly decreased the rate of wound closure by MC3T3-E1 cells compared to that in the control at 12 h and 24 h of treatment (p < 0.05, Dunnett comparison test) (Figure 2, Figure 3). In addition, whether the cells were treated for 2 h, 6 h, or 12 h, the wound closure rate of MC3T3-E1 cells decreased with the increase in FA dose, showing a dose-dependent inhibition of cell migration (Figure 4).

Effects of formaldehyde (FA) pretreatment for 2 h on the migration of MC3T3-E1 cells. (a) Cells were treated for 2 h with the control or with FA at different concentrations, and cell migration was examined via a wound-healing assay. Statistical analysis of the migration rate in each group at 12 h and 24 h is shown in the (b) and (c) panel. The results are expressed as mean ± SD values of at least three independent experiments. *p < 0.05, **p < 0.01.
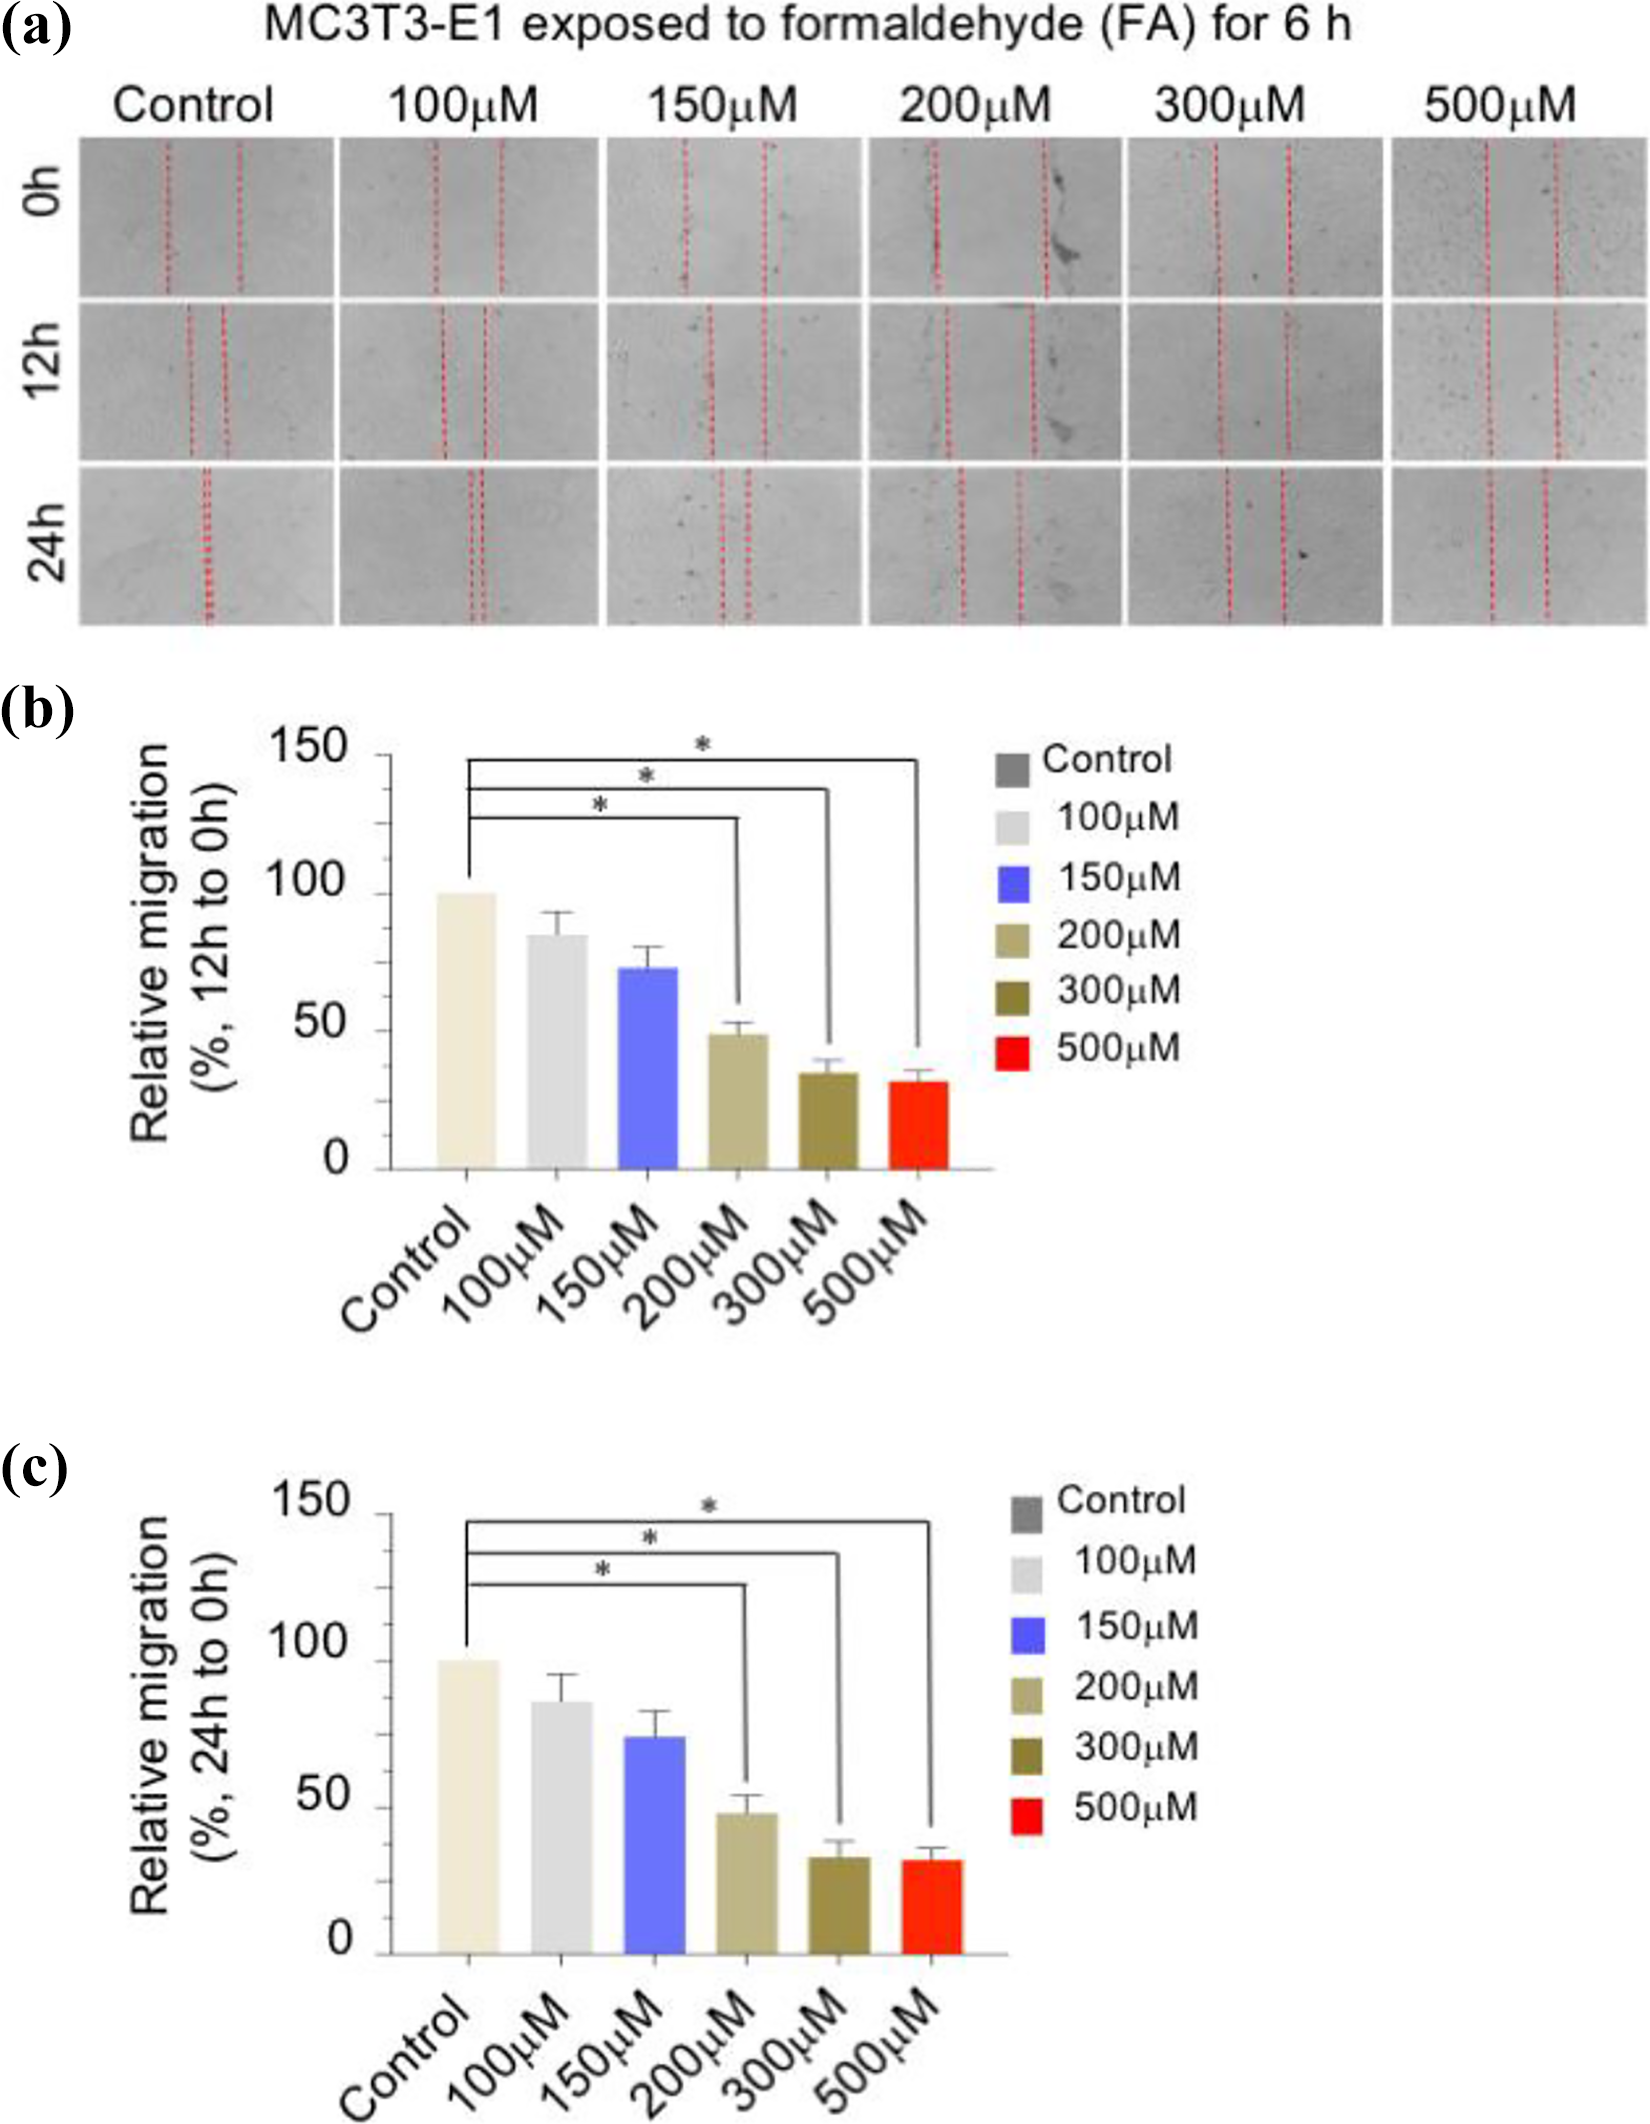
Effects of formaldehyde (FA) pretreatment for 6 h on the migration of MC3T3-E1 cells. (a) Cells were treated for 6 h with the control or with FA at different concentrations, and cell migration was examined via a wound-healing assay. Statistical analysis of the migration rate in each group at 12 h and 24 h is shown in the (b) and (c) panel. The results are expressed as mean ± SD values of at least three independent experiments. *p < 0.05, **p < 0.01.

Effects of formaldehyde (FA) pretreatment for 12 h on the migration of MC3T3-E1 cells. (a) Cells were treated for 12 h with the control or with FA at different concentrations, and cell migration was examined via a wound-healing assay. Statistical analysis of the migration rate in each group at 12 h and 24 h is shown in the (b) and (c) panel. The results are expressed as mean ± SD values of at least three independent experiments. *p < 0.05, **p < 0.01.
Identification of the candidate signaling pathway involved in cell proliferation and migration after FA treatment
To explore the potential mechanism underlying osteoblast proliferation and migration after FA treatment at the whole-genome level, we performed a genome-wide transcriptional analysis via RNA-seq. For cells treated with each FA concentration, whole-genome transcriptomes were determined. In brief, after treatment of MC3T3-E1 cells with 100 μM and 300 μM FA for 6 h, cells were harvested for RNA extraction and subjected to RNA-seq. Preliminary results indicated that 100 µM and 300 µM FA caused differential up-/downregulation of numerous genes (Figure 5a); the differentially expressed genes were enriched upon KEGG pathway analysis, indicating that these genes are involved in cell adhesion. Signaling pathways such as those involving Forkhead box O (FoxO), Wingless/Integrated (Wnt), autophagy-related proteins, mitogen-activated protein kinase (MAPK), mammalian target of rapamycin (mTOR), Hippo, and p53 (Figure 5b) modulate cell growth, proliferation, migration, and invasion. The 972 differentially upregulated genes and the 3968 differentially downregulated genes were separately enriched in the KEGG pathway. These upregulated genes were found to be primarily involved in DNA damage repair, cell metabolism, and other signaling pathways, while the downregulated genes were primarily involved in p53, Hippo, autophagy, FoxO, Wnt, TGF-beta, and other signaling pathways (Figure 5c). A total of 14 different key driver genes have been identified as shown in Figure 5d.
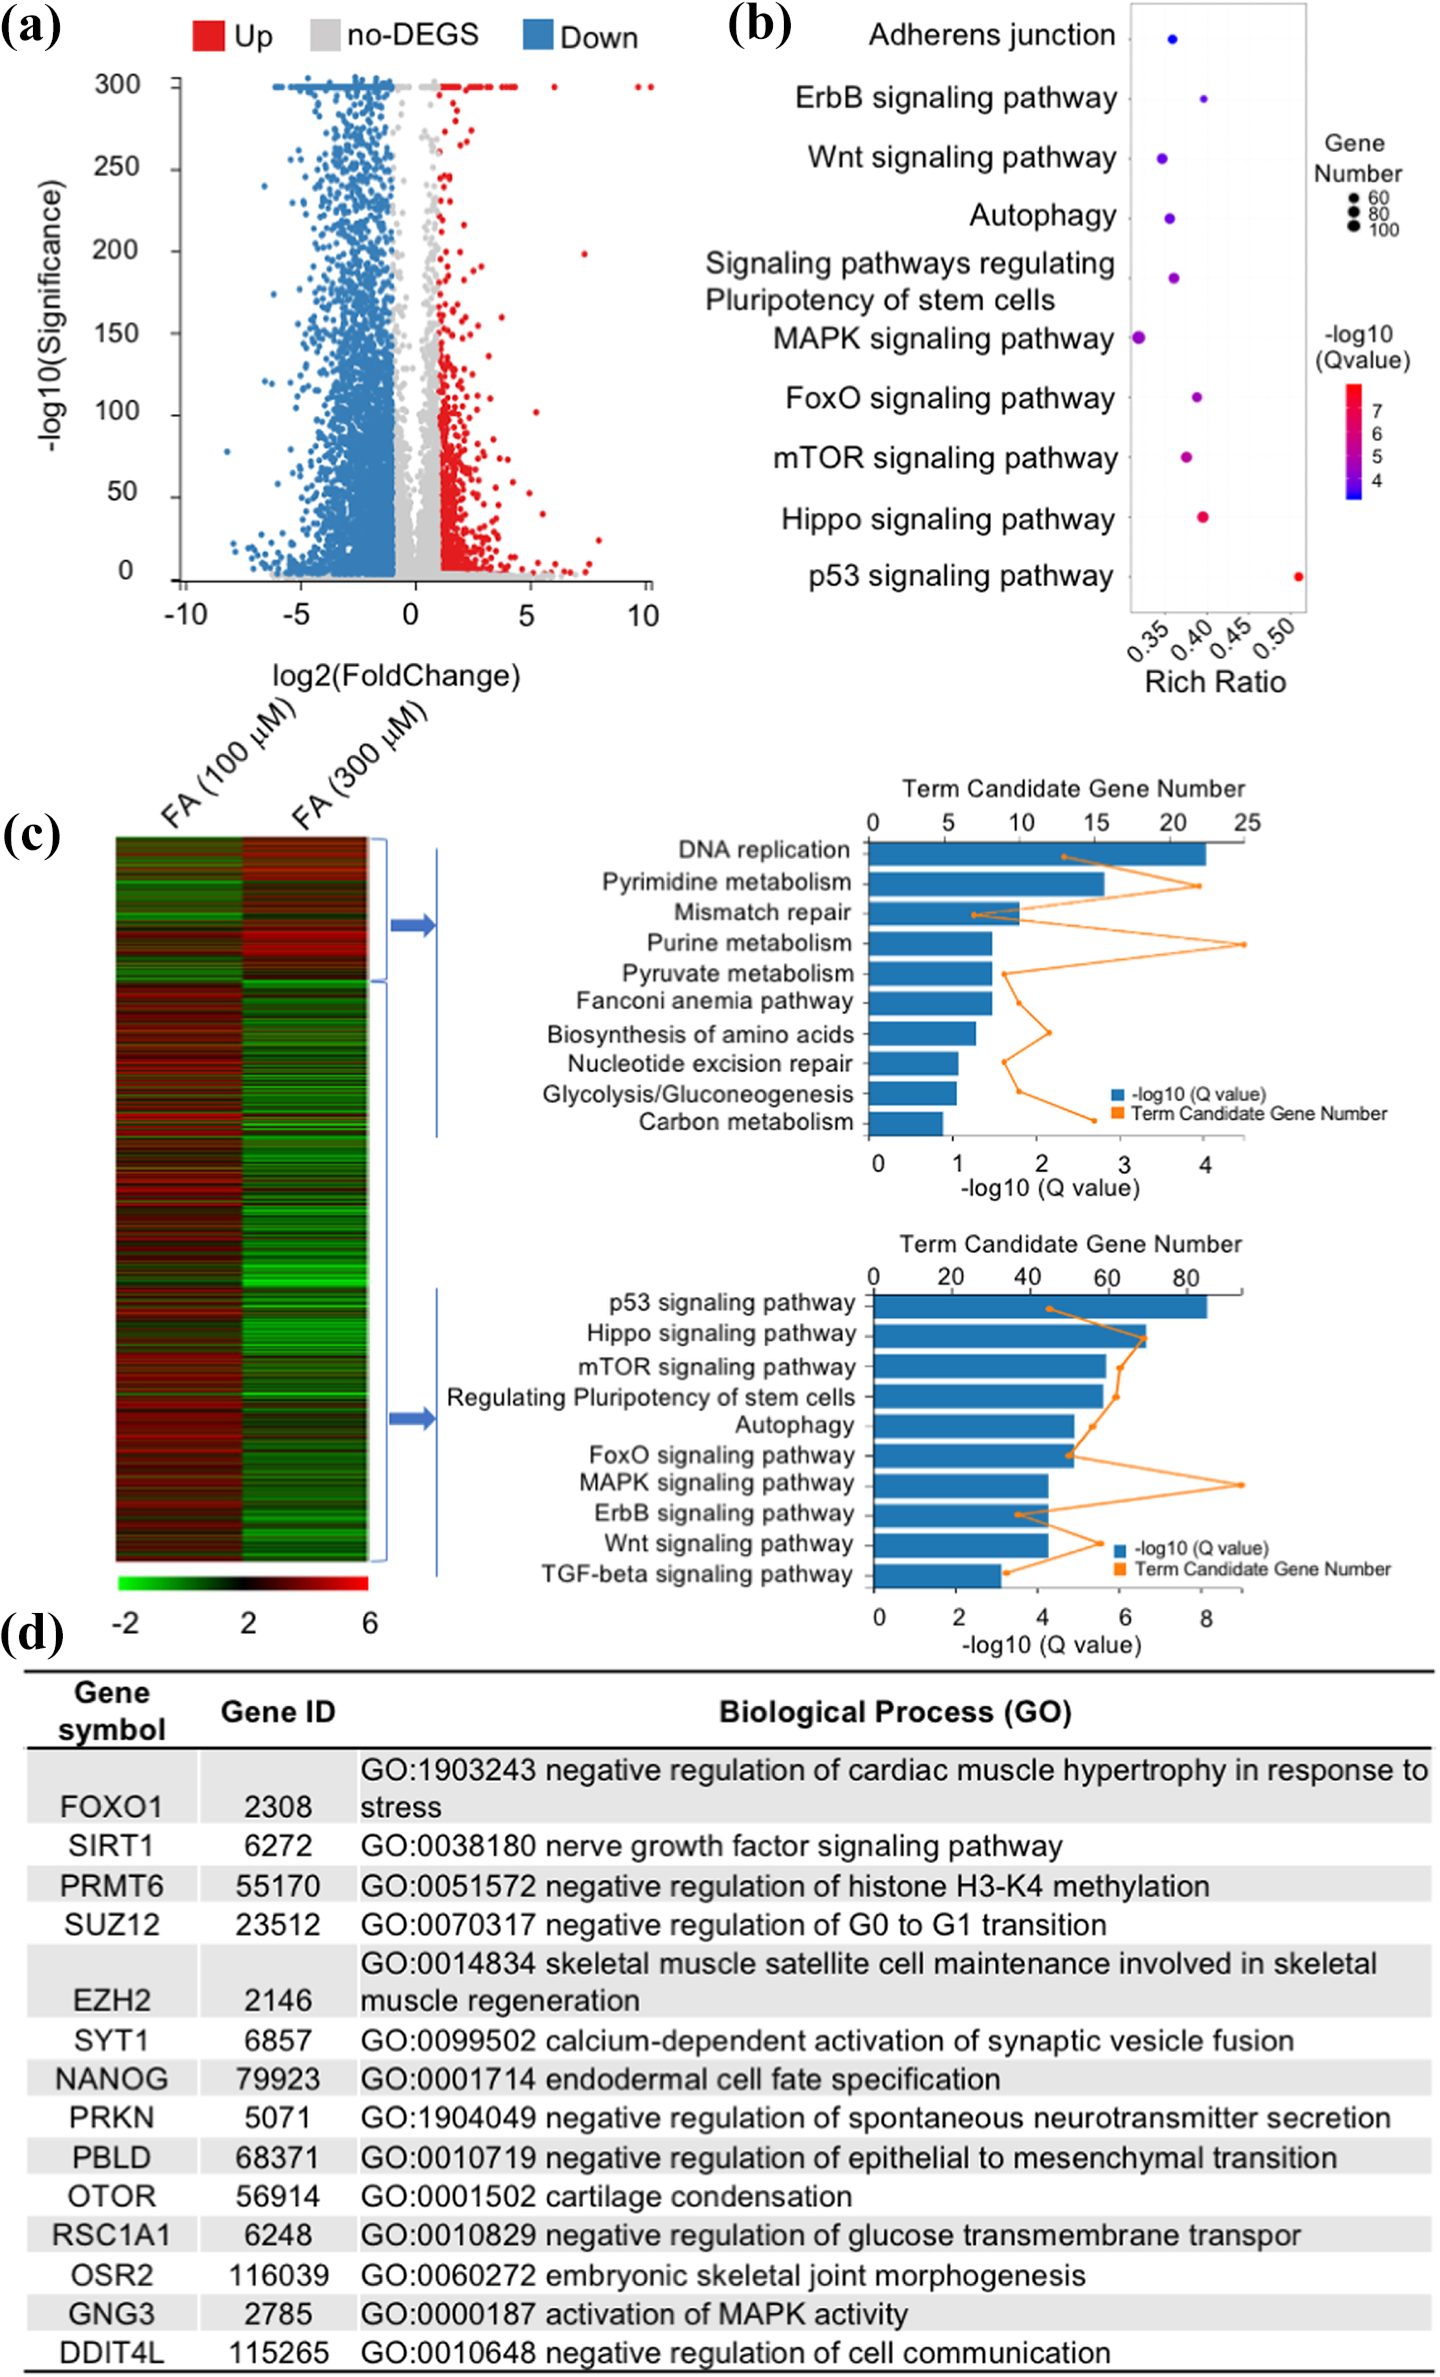
MC3T3-E1 cells treated with 100 μM and 300 μM formaldehyde (FA) for RNA-seq and analysis. (a) RNA-seq revealed that 972 genes were upregulated, and 3968 genes were downregulated (fold-change >2) upon treatment with 100 µM and 300 µM FA. (b) Differential gene enrichment in the KEGG pathway upon treatment with 100 µM and 300 µM FA, showing that these genes are involved in cell adhesion, Wnt, autophagy, MAPK, FoxO, mTOR, Hippo, and p53 signaling pathways. (c) The 972 differentially upregulated genes and the 3968 differentially downregulated genes were separately enriched in the KEGG pathway. (d) The GO annotation of key driver genes.
In order to further explore the aspects of related genes after FA treatment, we analyzed the expression of 14 genes including Prkn, Pbld, Otor, Syt1, Nanog, Prmt6, Ezh2, Sirt1, Suz12, Foxo1, Ddit4 L, Gng3, Osr2 and Rsc1A1(Figure 6a). To validate the gene expression in the RNA-seq analysis, we performed RT-qPCR for a subset of these 14 genes. FA treatment resulted in significant upregulation in the expression of Prkn, Pbld, Otor, Syt1 and Nanog, whereas the mRNA levels of Prmt6, Ezh2, Sirt1, Suz12, Foxo1, Ddit4 L, Gng3, Osr2 and Rsc1A1 were inhibited (Figure 6b).The results of RT-qPCR and RNA-seq were consistent, provided in Figure 6a and 6b. The Human Protein Atlas, an extensive database, was used to explore the protein levels of key genes, including FoxO1, silent information regulator 1 (Sirt1), protein arginine N-methyltransferase 6 (Prmt6), SUZ12 polycomb repressive complex 2 subunit (Suz12), enhancer of zeste 2 polycomb repressive complex 2 subunit (Ezh2), and Synaptotagmin-1 (Syt1) in the bone marrow (Figure 6c).

MC3T3-E1 cells treated with 100 μM and 300 μM formaldehyde (FA) for RNA-seq and analysis of upregulated and downregulated genes. (a) Analysis of the expression of key driver genes in the RNA-seq analysis. (b) RT-qPCR analyses for the expression of regulated transcription targets of FA in cells. Bars represent the mean ± SD of triplicate cell cultures. *p < 0.05, **p < 0.01, ***p < 0.001 by Student’s t-test. (c) Validation of FOXO1, SIRT1, PRMT6, SUZ12, EZH2, and SYT1 expression in the bone marrow by immunohistochemistry (IHC).
Furthermore, analysis of the RNA-seq results via Gene Set Enrichment Analysis (GSEA) revealed that the FA-300 group significantly inhibited signaling pathways such as FoxO, p53, Wnt, and mTOR (p < 0.05, Dunnett multiple comparison test) (Figure 7a). These results preliminarily indicated that the in vitro MC3T3-E1 osteoblast model of FA treatment is indeed reliable.

MC3T3-E1 cells treated with 100 μM and 300 μM formaldehyde (FA) for RNA-seq and analysis by Gene set enrichment analysis (GSEA). GSEA analysis of RNA-seq results. (a) RNA-seq revealed that the FoxO, p53, Wnt, and mTOR pathways were activated upon treatment with 100 µM and 300 µM FA. (b) MC3T3-E1 cells were seeded in six-well plates and treated with FA. FoxO1 expression levels and FA-induced related protein expression levels were determined via western blot analysis. (c) The quantification the western blots. Bars represent the mean ± SD. *p < 0.05, **p < 0.01 by Student’s t-test. (d) Schematic model of the effect of FA on FoxO1 and other target molecules mediating FA-induced inhibition of cell migration and proliferation.
Effect of FA on FOXO1/SIRT1 protein expression
To evaluate the effect of FA on FoxO1, 14 Sirt1, Prmt6, Suz12, 15 and Ezh2 16 protein expression levels, which are closely associated with the proliferation and migration of MC3T3-E1 cells, we treated cells with FA at increasing concentrations from 100 μM to 300 μM. Western blot analysis revealed that FoxO1, Sirt1, Prmt6, Suz12, and Ezh2 were significantly downregulated upon FA treatment (Figure 7b and 7c).
Discussion
To the best of our knowledge, the present study is the first to report that FA, a product of cellular metabolism and a ubiquitous environmental toxin, suppressed osteoblast proliferation and decreased their migration at naturally occurring concentrations. Furthermore, a genome-wide transcriptional analysis via RNA-seq performed to explore the potential mechanism underlying FA stimulation revealed distinct expression patterns of components of the FoxO1 signaling pathway upon FA treatment, reflected through significantly decreased cell migration and proliferation.
FoxO1, also known as the forkhead rhabdomyosarcoma transcription factor (FKHR), belongs to the FoxO family and is a key transcriptional regulator in cell proliferation, differentiation, and migration via a receptor tyrosine kinase signaling pathway. 17,18 Recent studies have reported that osteoblast growth and migration are regulated by FoxO factors. 19,20 FoxO1 is the primary regulator of redox balance and function in osteoblasts among three key members of the FoxO family, namely FoxO1, FoxO3a, and FoxO4. FoxO1 depletion in osteoblasts reportedly resulted in decreased proliferation and bone volume in FoxO1Ob -/- mice. 21,22 In the present study, genome-wide expression profiling revealed that FOXO1 was downregulated upon FA exposure. Furthermore, using protein semi-quantification techniques, it was determined that FoxO1 was downregulated at higher FA concentrations.
Transcription-related factors can be integrated into specific DNA sites, and this molecular process is regulated by changes in the chromatin configuration. However, highly condensed chromatin is uncoiled through chromatin remodeling, with the alternating of covalence power between histone and DNA chain; this mechanism may control gene expression and silencing. Recently, several studies have demonstrated the critical role played by Prmt6, Suz12, and Ezh2 in regulating cell proliferation and differentiation via chromatin remodeling; this process is also related to the FoxO signaling pathway. Prmt6, Ezh2 and Sirt1 all belong to the key enzymes of epigenetic regulation and participate in epigenetic modulation while playing an active role in epigenetic abnormalities. As two different type of histone methyltransferase, Prmt6 is a histone arginine methyltransferase, while Ezh2 is a histone lysine methyltransferase. 23,24 Both Prmt6 and Ezh2 can be involved in histone methylation to repress or activate key gene transcription. 25,26 Sirt1 is highly conserved, histone deacetylases can play a key role in regulating gene expression, and interact with key proteins of the Wnt pathway, FoxO1 pathway and p53 pathway to participate in processes such as cell senescence, apoptosis, metabolism and oxidative stress. 27,28 Besides, as a protein-coding gene, Suz12 is related with PKMTs methylate histone lysines. 29 For example, oxidative stress in cells, which in turn activates the SIRT/FOXO/SOD2 signaling pathway, results in the recruitment of chromatin remodeling complexes (Prmt6, Suz12, Ezh2) to modulate related gene expression. 30 In addition, the FoxO1, Ezh2, Wnt pathway is also involved in neuroendocrine differentiation regulation in prostate cancer. miR-708 inhibit FoxO1 phosphorylation to induce apoptosis in neuroendocrine prostate cancer cells via targeting Sirt3. Meanwhile, inhibition of Ezh2 expression by regulating the Wnt pathway can prevent prostate cancer from differentiating into neuroendocrine. 31 This regulatory pattern is similar to our results, it was determined in the genome-wide analysis that FozO1 and Sirt1 expression was reduced; the expression of key chromatin remodeling proteins, including PRMT6, SUZ12, and EZH2, was downregulated, and further confirmed by western blot.
These data indicate that FoxO1 plays an important role in FA-induced inhibition of proliferation and migration of MC3T3-E1 cells. FA regulates cell fate by affecting the normal cellular physiological function. It has been reported that FA can not only cause intracellular DNA damage but also inhibit the H2AX phosphorylation pathway to interfere with the DNA damage repair process and mutilate cell survival. 32 Further studies are required to elucidate its upstream and downstream interacting partners to gain greater insight into the detailed mechanism of action of FA on cell proliferation and migration. In the present study, the transcriptomic analysis of cellular responses elucidated the potential underlying mechanism and the dose-dependent response pattern.
Although the present results cannot be extrapolated directly to the in vivo setting, further studies are required to identify potentially sensitive target genes, since dysregulated expression of these genes can affect osteogenesis and cause bone disease.
In conclusion, the results of the present study showed that FA suppresses the expression of FoxO1and Sirt1 and key chromatin remodeling proteins to inhibits the migration and proliferation of MC3T3-E1 cells. Furthermore, this newly identified effect of FA on cell migration can be harnessed not only to prevent air pollution but also for novel therapeutic applications, such as the acceleration of wound healing by the accumulation of preosteoblasts at the bone fracture site. However, there are some regrets in this study that we did not explore the effect of formaldehyde on osteogenic differentiation in vivo. Therefore, further studies are required to clarify the effect of FA on FoxO1 and other target molecules mediating FA-induced inhibition of cell migration and proliferation.
Abbreviations
CCK8: Cell counting kit-8; RNA-seq: RNA sequencing; FA: Formaldehyde; FoxO: Forkhead box O; Wnt: Wingless / Integrated; MAPK: mitogen-activated protein kinase; mTOR: mammalian target of rapamycin; Sirt1: silent information regulator 1; Prmt6: protein arginine N-methyltransferase 6; Suz12: SUZ12 polycomb repressive complex 2 subunit; EZH2: enhancer of zeste 2 polycomb repressive complex 2 subunit; Syt1: Synaptotagmin-1; GSEA: Gene Set Enrichment Analysis; FKHR: forkhead rhabdomyosarcoma transcription factor
Highlights
Exogenous and endogenous formaldehyde inhibited osteoblast proliferation and migration
Transcriptomic analysis of osteoblast responses elucidated the underlying mechanism and dose-dependent response pattern
Formaldehyde-induced inhibition of proliferation and migration acts via the FoxO1 signaling pathway
Cellular or environmental formaldehyde may inhibit bone healing and aggravate osteoporosis
Footnotes
Declaration of conflicting interests
The author(s) declared no potential conflicts of interest with respect to the research, authorship, and/or publication of this article.
Funding
The author(s) disclosed receipt of the following financial support for the research, authorship, and/or publication of this article: This work was supported by grants from National Natural Science Foundation of China (81672726; 30801156); National Key Research and Development Program of China (2017YFC0113001); Program for Training Capital Science and Technology Leading Talents (Z181100006318003); and Fostering Young Scholars of Peking University Health Science Center (BMU2017PY015).