
Abstract
Introduction
Prostate cancer (PCa) is the one of the most common malignant tumors of the genitourinary system in men, with an estimated 1,414,259 new cancer cases in 2020, second only to lung cancer. 1 PCa cells easily spread to other parts of the body such as bones and lymph nodes, leading to androgen-independent PCa, which is also the main reason for the low 5-year survival rate of PCa. 2 At present, chemotherapy is the main method for the treatment of PCa, 3 and paclitaxel is a chemotherapeutic drug used to treat cancers including PCa. 4 Paclitaxel is a natural anti-tumor drug found in Taxus genus, and widely used for the therapy of various solid tumors. 5 In the clinical therapy of PCa, paclitaxel has been used a first-line chemotherapeutic agent, but most patients acquired resistance to paclitaxel after short-term treatment, 6 thus resulting in the failure of chemotherapy. Therefore, deep investigation of the resistance mechanism in PCa is an urgent problem to be resolved.
The establishment of resistant cell line is the footstone for the researches of resistant mechanism and target development. However, most of the investigators carry out these studies with the non-resistant cells through gene gain-and-loss and drug-sensitivity assays.7,8 The acquired resistance is a process involved in the alterations of a serious of genes and pathways. The exploration of the potential targets through the above methods is far from enough.7,8 Next generation sequencing (NGS) technology is able to detect known and unknown genes, superior to microarray analysis in the identification of unknown genes. Besides, NGS analysis is non-biased, and can reveal new splice junctions, small RNAs, and new genes missed by the chip. Currently, RNA-seq technology has been widely used in transcriptome analysis, resistance mechanism study as well as the development of new targets.9,10
Toll-like receptors (TLRs) are a group of well-known transmembrane receptors in innate immunity through recognition of pathogen- and damage-associated molecular patterns. 11 Studies indicates that, TLRs are also present and functional on non-immune cells including tumor cells, apart from the immune cells. Activation of TLRs in tumor cells leads to the inflammation in the tumor microenvironment, thus playing tumor-promoting or antitumor effects. 12 Notably, regulation of the activation level of TLRs/MyD88 signaling pathway or the expression level of TLRs (e.g. TLR3, TLR4) also results in the changes in proliferation and migration abilities of colon cancer and PCa cells.13–15 Therefore, development of TLR-targeting agonists and antagonists has become an important and promising approach in cancer immunotherapy. 16 However, the potent of targeting TLRs in reversing chemoresistance is less investigated.
In the present study, we intended to establish two paclitaxel-resistant PCa cells lines, different from previous studies, only one resistant cell line was established.17,18 The gene expression profile of the resistant cells was then analyzed using RNA-seq, and GO and KEGG enrichment was performed to annotate the biological roles of the abnormally expressed genes (AEGs). In addition, a number of AEGs involved in cancer- and resistant phenotype-related biological processes were also screened out, and one of the candidates, TLR-4, was proved to be a potential target for sensitizing the resistant cells.
Materials and method
Cells and cell culture
PCa cells (PC-3 and LNcap cells) purchased from the ATCC (Manassas, VA, USA) were cultured in Roswell Park Memorial Institute 1640 (RPMI-1640) medium (Invitrogen, Carlsbad, CA, USA) with 10% fetal bovine serum (HyClone, Logan, UT, USA), 100 U/mL penicillin and 100 μg/mL streptomycin. The cells were incubated under constant temperature and humidity conditions at 37°C and CO2.
Establishment of paclitaxel resistant PCa cells
Paclitaxel-resistant PC-3 and LNcap cells were established through gradually increasing the concentration of paclitaxel. The initial paclitaxel concentration was 1 mg/L. When the cells were adapted to grow and normally passaged at the concentration of 1 mg/L, the drug concentration was gradually increased with a gradient of 1–2 mg/L. Finally, the cells were able to grow and passaged normally at 10 mg/L of paclitaxel. After the induction for 4 months, the stable paclitaxel-resistant cell lines were obtained and named as PC-3/PR and LNcap/PR, respectively.
Drug-sensitivity analysis
Cells were seeded and cultured in 96-well plates at 5×10³ cells/well. Then, different concentrations of paclitaxel (0, 0.1, 0.5, 1, 5, 10, 25 mg/L) were added to each well. After 72 h of incubation, the 3-(4,5-dimethylthiazol-2-yl)-2,5-diphenyl-2H-tetrazolium bromide (MTT) assay was used to measure the cell survival rate, according to a previous study with some modifications. 19 The cell survival rate was calculated according to the following formula: Cell survival rate (%) = OD450 value of experimental group/control group OD450 value × 100%. SPSS was used to calculate IC50, resistance index (RI): RI = IC50 of the paclitaxel-resistant cell line/IC50 of the sensitive cell line.
Cell proliferation assay
Cells were seeded in 96-well plates at 4×10³ cells/well. Then, cell activity was measured by MTT assay 19 at 1, 2, 3, 4, 5, 6 and 7 days, respectively. Then the value-added curve was drawn. The calculation formula of multiplication rate was as follows: proliferation rate = An/A1 (n = days).
Transwell assay
The Transwell assay was used to detect cell migration of different groups. Cells were collected, and washed with PBS, then re-suspended in serum-free medium. Next, 100 μL of 4×10⁴ cells were seeded in the upper chamber of each insert (24-well insert; 8-mum pore size; BD Biosciences) with an uncoated membrane. 600 μL of serum-containing medium was then added in the lower chamber as a chemotactic agent. After 48 h of culture, cells remaining in the upper surface of the membrane were removed, while the cells on the bottom surface were fixed with methanol for 10 min, followed by staining with 0.5% crystal violet for another 20 min. Finally, the stained cells were counted under an optical microscope.
RNA sequencing and data analysis
The RNeasy mini kit (Qiagen, Germany) was used to extract total RNA from paclitaxel-resistant and sensitive PCa cell lines following the manufacturer’s instructions. The integrity of the extracted RNA was evaluated using formaldehyde-denatured gel electrophoresis. Then the TruSeq Stranded mRNA LTSample Prep Kit (Illumina, USA) was used to prepare paired-end libraries following the manufacturer’s instructions. Next, the poly-A containing mRNA molecules were purified using poly-T oligo-attached magnetic beads. The first strand cDNA was synthesized by using the fragmented mRNA, reverse transcriptase and random primers, followed by the synthesis of second strand cDNA by using DNA Polymerase I and RNase H. Purified libraries were quantified by Qubit®2.0 Fluorometer (Life Technologies, USA) and validated by Agilent 2100 bioanalyzer (Agilent Technologies, USA). Finally, the library was diluted to 10 p.m. and sequenced on HiSeq-2500 platform (Illumina, USA). AEGs were identified by using the DESeq package, and Log2fold change (absolute) [log2FC(abs)] > 1 was set as the threshold.
Bioinformatic analysis
The databases of gene ontology (GO) and Kyoto Encyclopedia of Genes and Genomes (KEGG) were used to annotate the functions of AEGs. The GO enrichment analysis of AEGs was implemented using the GOseq R package based on Wallenius’s non-central hypergeometric distribution. WEGO software was used for GO classification. KEGG analysis classifies AEGs as a functional pathway. The KEGG automatic annotation server was used for KEGG channel annotation.
RNA isolation and quantitative real-time polymerase chain reaction
To measure the mRNA levels of CREB3L3, TLR4 and CYP1B1, TRIzol reagent (Invirogen, USA) was used to isolate total RNA. cDNA was synthesized by All-in-Onet First-Strand cDNA Synthesis Kit (FulenGen, China) following the manufacturer’s instructions. For quantification, 0.5 μL of cDNA was added to a reaction system containing 1 mL of primer, 5 μL of SYBR Green (Applied Biosystems, Inc.), and 3.5 μL of deionized water. The reaction conditions were as follows: denaturation at 95°C for 10 s, annealing at 58°C for 10 s, and extension at 72°C for 40 s; the number of cycles was set to 40. β-actin was used as an internal reference, and the 2−ΔΔCt method was used to analyze the results. The relative expression of CREB3L3, TLR4 and CYP1B1 was normalized to β-actin. The primer sequence is as follows: CREB3L3 (forward 5ʹ-CCTGTTTGATCGGCAGGAC-3ʹ, reverse 5ʹ-CGGGGGACCATAATGGAGA-3ʹ); CYP1B1 (forward 5ʹ-TAGTAAGGCTGGGACGGTGA -3ʹ, reverse 5ʹ- CATCCGGGTCTGGTTGGTTT -3ʹ); TLR4 (forward 5ʹ-CCATGGCCTTTCTCTCCTG-3ʹ, reverse 5ʹ- TCAGCTCCATGCATTGGTAA-3ʹ); β-actin (forward 5ʹ- CCAAGGCCAACCGTGAGAAGAT-3ʹ, reverse 5ʹ-CCACGTTCCGTGAGGATCTTCA-3ʹ).
Cell transfection
Cells were seeded into 6-well plate at a density of 2×10⁵ cells/well. After the confluence of cells reached 80–90%, siRNAs were transfected into cells using Lipofectamine3000 (Invitrogen, Carlsbad, CA, USA) following the manufacturer’s instructions. Next, the transfection efficacy was validated by qPCR. siRNA targeting TLR4 (si-TLR4, s14194), and negative control siRNA (si-NC, 4,390,843) were purchased from Thermo Fisher Scientific (Waltham, USA).
Statistical analysis
Statistical analysis was performed using SPSS 11.0 software (SPSS, Inc, Chicago, USA). The measured data were expressed as standard deviation (SD). Statistical comparison between two groups was performed by the Student’s T-test, and p<0.05 was considered statistically significant.
Results
Establishment of paclitaxel-resistant PCa cell lines
First, as described in the materials and methods section, PC-3/PR and LNcap/PR were established by treatment with paclitaxel. After the cell line was treated with paclitaxel for 72 h, the cell viability was measured. We calculated IC50 values for paclitaxel. The IC50 values of PC-3 and PC-3/PR were 16.29 mg/L and 43.51 mg/L, respectively, indicating that RI was 2.67. The IC50 values of LNcap and LNcap/PR were 12.75 mg/L and 38.39 mg/L, respectively, and the corresponding RI was 3.01. Subsequently, the cell morphology was observed with an electron microscope (Figure 1(b)), and the results showed that the cell size increased significantly after PC-3 cells resistant to paclitaxel. LNcap cells were easy to grow in aggregates, the outer edge cells were short-spindle cells, and the inner cells had no obvious morphology, but LNcap/PR was not easy to aggregate and grow scattered. These alterations indicated that the growth behavior of the cells underwent significant changes after resistant to paclitaxel. Establishment of paclitaxel-resistant PCa cells. (a) MTT assay was used to detect the drug-sensitivity of PCa cells on paclitaxel. (b) Electron microscopy was used to observe the morphology of PCa cells.
Paclitaxel-resistant PCa cells showed decreased proliferation and enhanced migration ability
Next, we used MTT assay to detect the viability of paclitaxel-resistant cell lines (PC-3/PR and LNcap/PR) and found that compared with sensitive cells, the viability of PC-3/PR and LNcap/PR was significantly decreased (Figure 2(a)). Subsequently, the Transwell assay was used to detect the migration ability and found that the migration ability was significantly improved after resistance (Figure 2(b)), indicating that the proliferation ability of paclitaxel-resistant PCa cells was weakened and the migration ability was enhanced. Resistant PCa cells showed decreased proliferation and enhanced migration ability. (a) The proliferation of PCa cells was detected by MTT assay. (b) Transwell assay was used to detect cell migration ability.
RNA-seq of AEGs in resistant cells
In order to determine the potential targets of PC-3/PR and LNcap/PR, RNA-seq analysis was performed on sensitive and paclitaxel-resistant PCa cells. Under the criterion of log2FC (abs) > 1 (without considering the p value), 4741 AEGs were screened in the resistant cells (supplementary material, Table S1), including 1934 protein coding RNA (mRNA) and 1672 lncRNA, accounting for 40.7% and 35.2%, respectively. The expression profile of each cell sample was presented in heat-map (Figure 3(a)). As we could see that, the expression profiles between the two resistant cells or the sensitive cells were both not very consistent, which was predominantly caused by the differences between the two different sensitive cells. Therefore, the p-value was not taken into consideration as the filter criterion. The scatter plot presented 3115 of up-regulated (red dot) and 1626 of down-regulated (blue dot) genes (Figure 3(b)). Table 1 listed the top 30 AEGs. We found that SLC1A6 (FC (abs) = 115.73) was the most significantly down-regulated gene, and TTPA (FC (abs) = 112.85) was the most significantly up-regulated gene. RNA-seq analysis of AEGs in resistant cells. (a) Heat map showed the expression of AEGs. Each line indicates a gene and each column indicates a cell sample. (b) Scatter plot of all AEGs. Each point represents a gene, blue indicates down-regulated genes, red indicates up-regulated genes. g2 and g1 represents the resistant and sensitive group, respectively. (c) GO functional enrichment analysis of AEGs (terms of top 30 counts). The sizes of circles, triangles, and squares indicated the number of genes involved in biological processes, cell components, and molecular function terms, respectively. The color and size of circle/triangle/square indicated the q value and gene number, respectively. Expression alteration of top 30 AEGs in resistant group. FC: fold change; abs: absolute; AEGs: abnormally expressed genes.

Bioinformatic analysis of AEGs
In order to reveal the potential molecular mechanism of PC-3/PR and LNcap/PR, the function of AEGs was annotated with GO and KEGG analyses to uncover the biological roles. GO enrichment analysis showed AEGs were involved in the activity regulation of various enzymes, e.g. 2′-5′-oligoadenylate synthetase, and galactosylceramide sulfotransferase (Figure 3(c)). Four AEGs, OAS1, OAS2, OAS3 and OASL, were enriched in GO term of 2′-5′-oligoadenylate synthetase activity (supplementary material, Table S2). In addition, some AEGs were enriched in proliferation-related process, e.g. cell proliferation involved in metanephros development (Figure 3(c)), and four AEGs were included: GPC3, SHH, EGR1, and STAT1 (supplementary material, Table S2).
As shown in Figure 4(a), many AEGs were classified into cancer-related human diseases, including cancer: overview, drug resistance: antineoplastic, and cancer: specific types. Over 200 AEGs were involved in signal transduction, suggesting an extensive dysregulation of signaling pathways. Besides, some AEGs were classified into cell growth and death, as well as cell motility (Figure 4(a)). KEGG enrichment analysis indicated that, AEGs were mainly enriched in ether lipid metabolism, chemical carcinogenesis and PI3K-Akt signaling pathway (Figure 4(b)). GSTM1 and UGT2B15 were included in pathway of chemical carcinogenesis (supplementary material, Table S3). KEGG classification and enrichment analyses of AEGs. (a) KEGG classification of AEGs. Blue, red, green, yellow, purple, and orange indicate cellular processes, environmental information processing, genetic information processing, human disease, metabolism, and organismal systems, respectively. (b) Top 30 significant KEGG pathway. The Y-axis label represented the channel name, and the rich factor was displayed on the X-axis. The size and color of the bubbles represented the number of genes enriched in each pathway and their enrichment significance. The size of the bubble indicated the number of genes enriched in, and the color of the bubble indicates the q value.
qPCR validation of the candidate AEGs involved in cancer- and resistant phenotype-related biological processes
AEGs enriched in cancer- and resistant phenotype-related biological processes.

AEGs: abnormally expressed genes. Three genes (CREB3L3, TLR4, CYP1B1), overlapped with AEGs in Table 1, were marked in red.
All these dysregulated genes in the Table 2 might be involved in the acquired resistance of PCa cells, thus we checked the log2FC (abs) values of them, but the values of most AEGs were less satisfying. Next, we focused on the top 30 AEGs, and found that, 3 (CYP1B1, CREB3L3, and TLR4) of them were included in the Table 2, marked in red. qPCR validation indicated that, CREB3L3 and TLR4 were both significantly increased in the resistant cells, while the expression alteration of CYP1B1 was inconsistent in the two resistant cells (Figure 5(a)). The expression increase of CREB3L3 and TLR4 in PC-3/PR were both higher, and the increase of them in LNcap/PR was relative lower. Notably, TLR4 showed a higher increase than CREB3L3 in LNcap/PR, thus TLR was selected for further investigation. Knockdown of TLR4 sensitized resistant cells to paclitaxel. (a) qPCR detection of the expression of three candidate AGEs in two resistant cells. (b) qPCR validation the expression level of TLR-4 after cells transfected with si-TLR4. (c) MTT assay was performed to detect the drug-sensitivity of resistant cells after knockdown of TLR-4.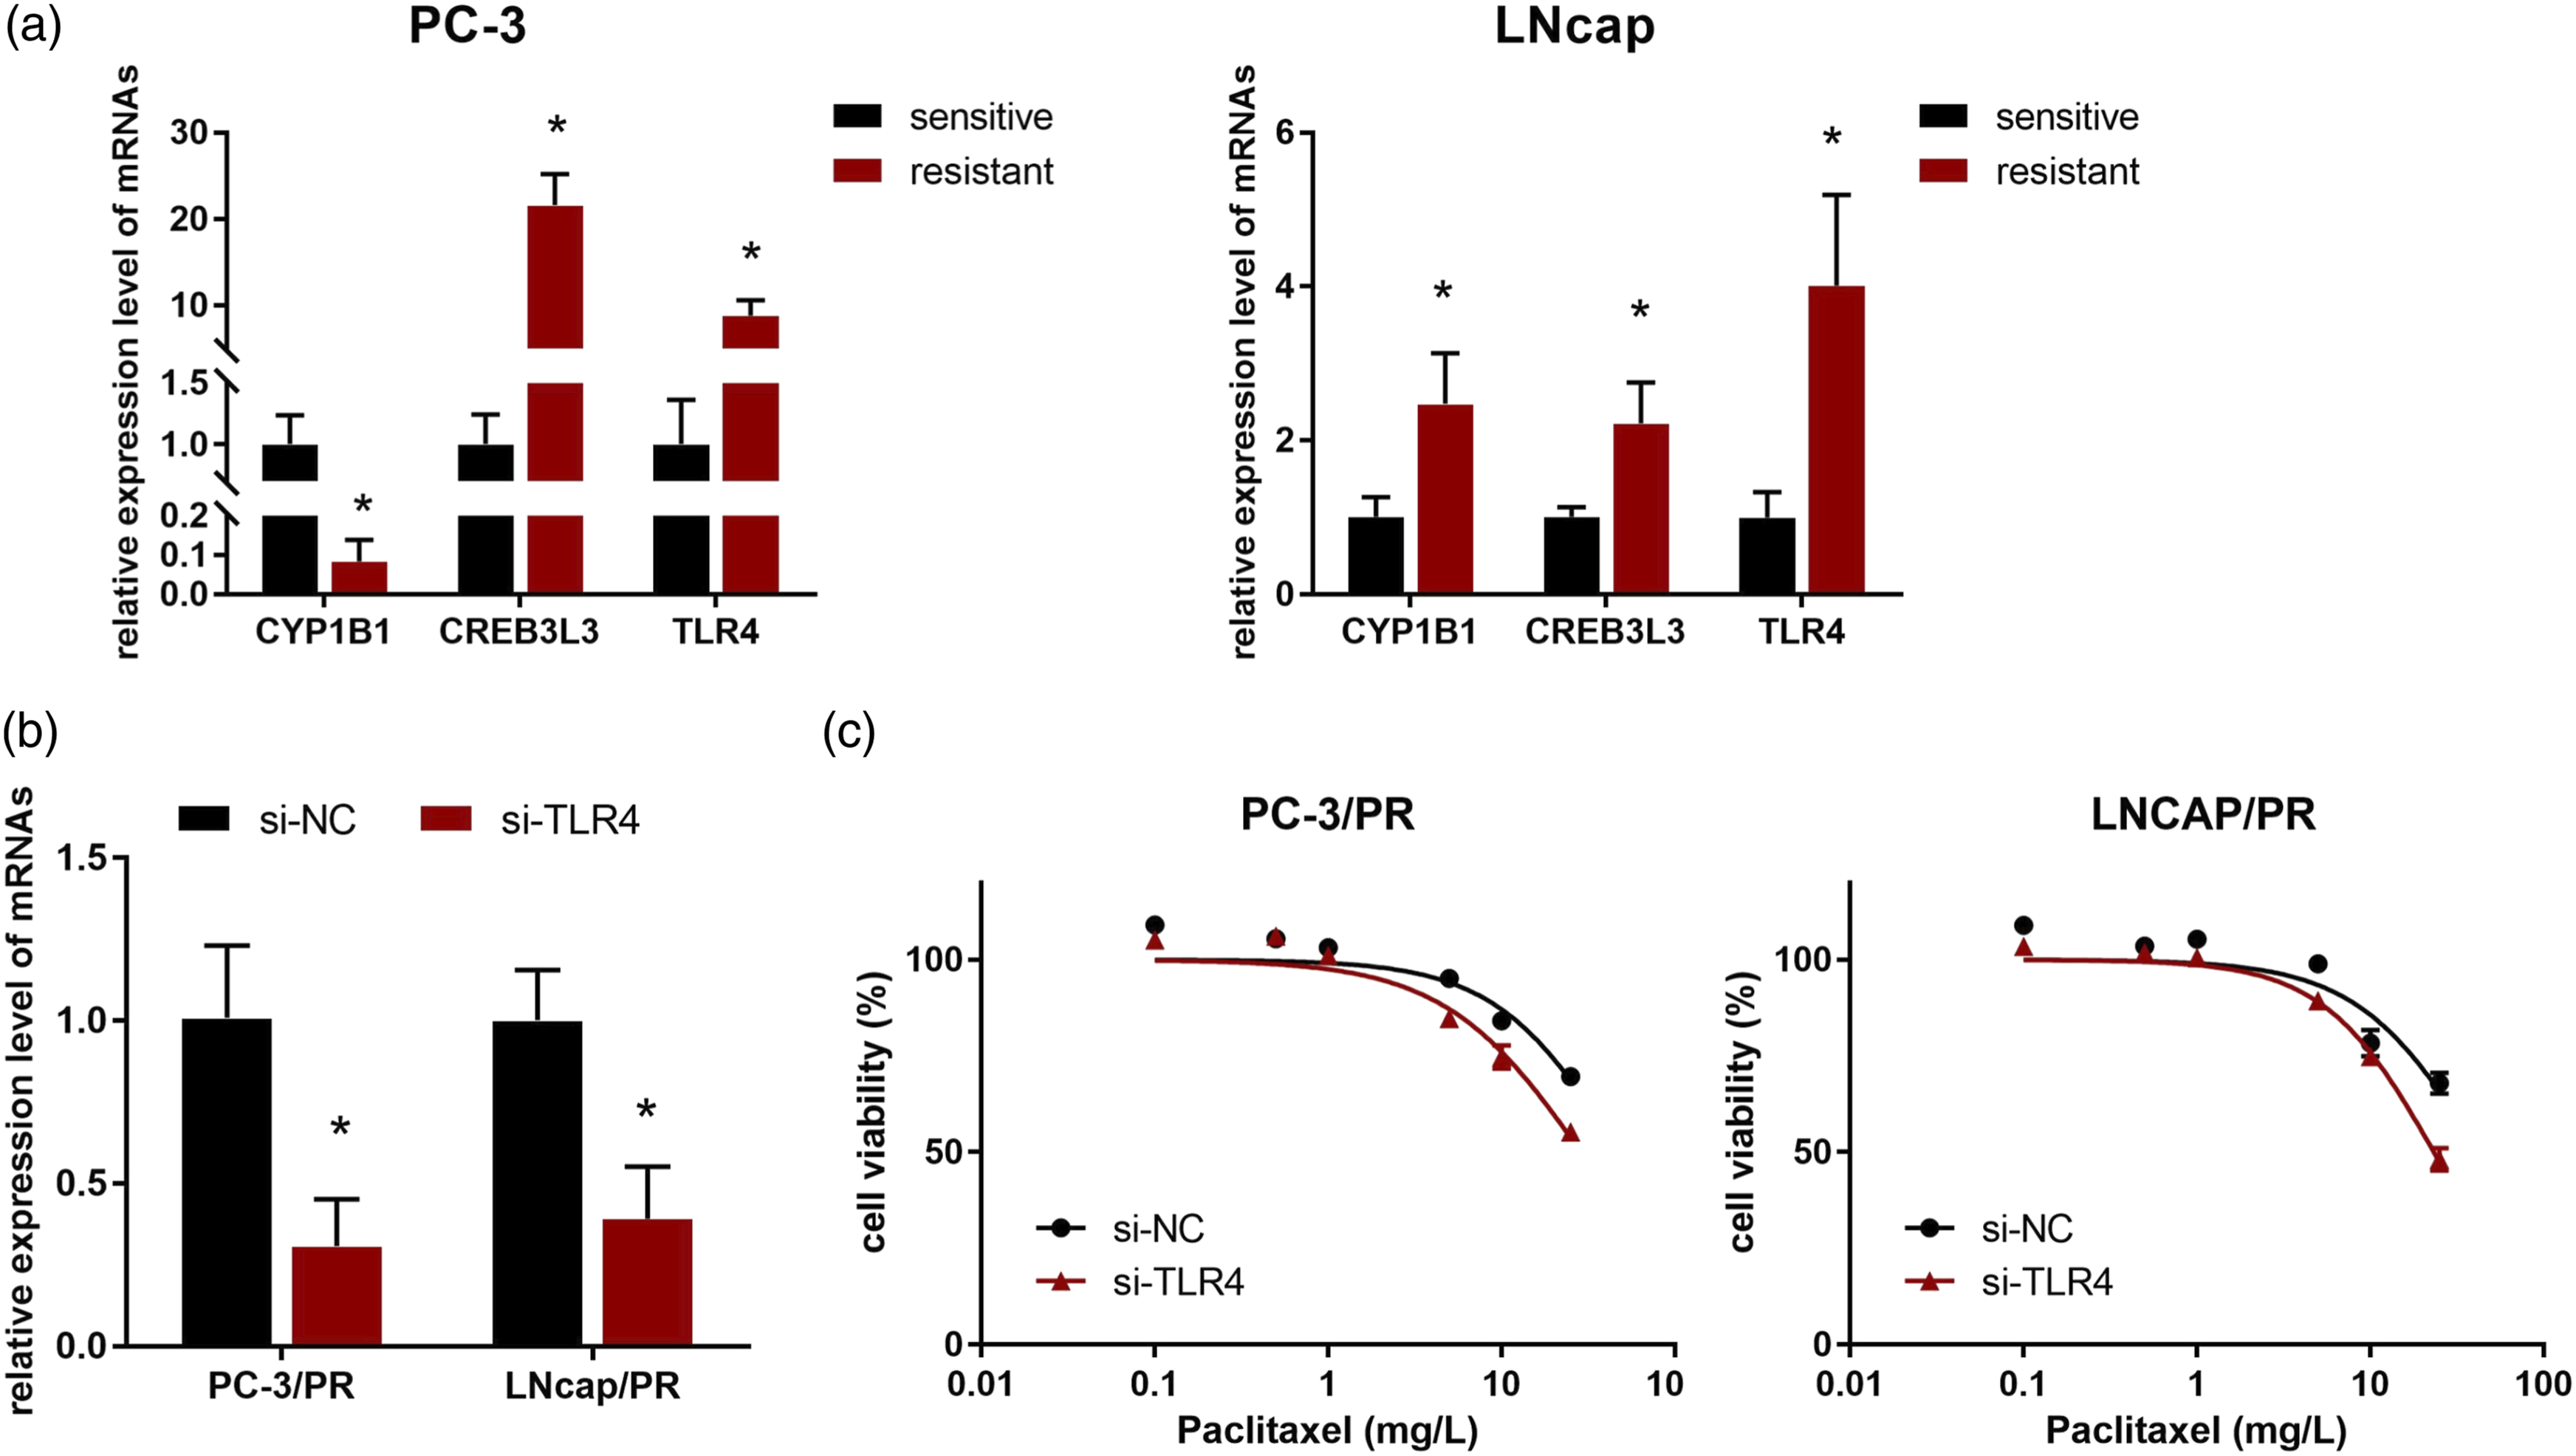
Knockdown of TLR4 increased the drug-sensitivity and inhibited the resistant phenotypes
QPCR detection indicated that, TLR4 was significantly suppressed in the resistant cells after transfection of siRNA (Figure 5(b)). Drug-sensitivity analysis showed that, the IC50 of PC-3/PR was reduced from 47.19 mg/L to 28.79 mg/L, after knockdown of TLR4, and the resistance to PTX decreased by 40% (Figure 5(c)). Similarly, the paclitaxel-sensitivity of LNcap/PR was increased by ∼1 fold, and the IC50 in si-NC and si-TLR4 groups were 42.34 mg/L and 23.32 mg/L, respectively (Figure 5(c)). In addition, knockdown of TLR4 caused the significant inhibition of proliferation and migration abilities of the two resistant cells (Figure 6(a) and (b)). These results indicated that TLR4 was a potent target to increase the drug-sensitivity and suppress the resistant phenotypes. Knockdown of TLR4 inhibited the proliferation and migration ability of resistant cells. (a) MTT assay was performed to detect the proliferation of resistant cells silencing with TLR4. (b) Transwell assay was used to detect the migration ability of resistant cells after knockdown of TLR-4.
Discussion
PCa is one the major threats to men’s health, and paclitaxel is a clinically effective chemotherapy drug. However, the acquired resistance always leads to the great weakness of paclitaxel’s clinical effect. The establishment of resistant cell lines is the fundamental for the investigation of resistant mechanism as well as the exploration the potential targets. The present study established two paclitaxel-resistant cell lines, analyzed expression profile of AEGs in resistant cells, and also provided a potent target for reversing resistant.
Drug-sensitivity results indicated that, the RI of the two resistant cells, PC-3/PR and LNcap/PR, were 2–3, much lower than those of paclitaxel-resistant DU145 (DU145-TxR) and PC-3 (PC-3-TxR) cells. 20 However, the highest FC (abs) in our study was 115.73, nearly 10-fold of that in PC-3-TxR, of which genes were identified using microarray analysis. 20 Generally, a higher RI indicates a more significant gene expression alteration. The lower RI of our resistant cells with much higher FC of genes might be the differences of the sensitive cells themselves and the methods of identification. In addition, it is not appropriate to evaluate the resistance of resistant cells by single RI or the FC value, and combination of the two indexes as well as the phenotype detection would be much more reasonable. The two resistant cells both showed a slower proliferation ability and a stronger migration ability, and these alterations in proliferation and migration was also consistent to the previous studies.21,22
RNA-seq identified 4741 AEGs in the resistant cells, and only 40.7% of them was mRNA. Notably, a substantial part (35.2%) of lncRNAs was also identified, close to that of mRNA. The lncRNAs have been proved to play important roles in tumorigenesis and drug resistance in the recent years,7,23 and these dysregulated lncRNAs might also be involved in the acquired resistance to paclitaxel, waiting for further investigations. Since the GO and KEGG analyses were both focused on the mRNAs, lncRNA was not received further concern in the present study.
GO enrichment analysis indicated that, OAS1, OAS2, OAS3 and OASL were involved in the term of 2′-5′-oligoadenylate synthetase activity. It is reported that, OAS1 and OAS3 were highly expressed in trastuzumab resistance GC, 24 and OASL1-deficient mice were more resistant to implanted tumor growth than wild-type mice. 25 Therefore, these AEGs might also be involved in the acquired resistance of PCa cells to paclitaxel. KEGG pathway enrichment analysis was mainly enriched in pathways such as ether lipid metabolism, chemical carcinogenesis and PI3K-Akt signaling pathway. Lipid metabolism was an important driving force for tumor occurrence and development, and it was also the reason why PCa was resistant to chemotherapy drugs. 26 It showed that AEGs were involved in lipid metabolism to achieve the regulation of resistance to PCa.
Compared to normal cells, reactive oxygen species (ROS) production is significantly increased in cancer cells, because of mitochondrial dysfunction and altered metabolism. Therefore, as an adaptive response, cancer cells often possess higher antioxidant capacity, especially in chemoresistant cancer cells, through elevating levels of ROS-scavenging molecules. 27 Glutathione is the most abundant antioxidant, and generally functions as the substrate for glutathione-s-transferase (GST) to exert its detoxification reactions in cancer cells. 28 Notably, GSTM1, one of the GSTs, was upregulated in resistant group and also enriched in the “chemical carcinogenesis” term. Since the role of GSTM1 in chemoresistance has been validated in several cancers,29,30 and it may be a promising target to overcome the chemoresistance in PCa. At the same time, the study found that the AKT pathway in PC-3/docetaxel cells was activated, and we found through enrichment analysis of the KEGG signaling pathway that 47 AEGs were enriched in the PI3K-Ak signaling pathway, suggesting that this pathway may also be activated in the drug-resistant cells screened in this study.
Cancer- and resistant phenotype-related biological processes uncovered a number of AEGs involved in tumorigenesis and tumor resistance. For instance, CCND2, IGFBP3, FOS, SHH, and ZEB2 are all the well-known oncogenes, and silencing of them could increase the drug-sensitivity of cancer cells.31–33 Some members of FGF, FGFR and WNT families were also screened out in cancer-related pathways. FGFR engagement results in the activation of various downstream pathways including MAPK, PI3K-AKT and JAK-STAT, thus inhibiting apoptosis, promoting proliferation and migration. 34 Inhibition of FGF/FGFR signaling pathway has become an important strategy in tumor therapy as well as the reversion of drug-resistance. 35 Wnt signaling plays key roles in embryonic development, and it is often hyperactivated in tumorgenesis. 36 WNT proteins secreted by PCa cells promote the resistance to therapy, and the activation of WNT signaling pathway causes the significant elevation of self-renew and expansion of PCa stem cells. 37 Blockage of WNT pathway is beneficial to prevent the progression of PCa. 37 In addition, MMP9 has been shown to be involved in ETS1-mediated paclitaxel resistance in PCa, 38 and IGF1 is also involved in mediating PCa resistance through insulin receptor signaling. 39
TLR4 is a well-known innate immune receptor responsible for the recognition of lipopolysaccharide (LPS) of Gram-negative bacteria. TLR is expressed on various normal and malignant epithelial cells, and its expression level is increased in many cancers including PCa.15Activation of TLR4 is found to drive tumor-associated inflammation, 40 and tumor metastasis. 41 Recent studies indicate that, blockage/knockdown of TLR4 leads to the increase of drug-sensitivity of breast and ovarian cancers to paclitaxel,42,43 but the role of TLR4 on paclitaxel-resistant PCa cells is less investigated. The preset study found the TLR4 was significantly enhanced in both of PC-3/PR and LNcap/PR, and knockdown of sensitized the two resistant cells to paclitaxel, and also resulted in the significant inhibition of proliferation and migration abilities. It is reported that, treatment of paclitaxel induces a pro-inflammatory phenotype of tumor cell, and these inflammatory mediators could promote tumor cell survival. 44 What’s more, paclitaxel could be as a functional mimetic of LPS, 45 and it induces the upregulation of numerous inflammatory, migratory, and prosurvival proteins through activation of TLR4-mediated NF-κB pathway. 44 Therefore, NF-κB pathway might be the key downstream of TLR4 in the acquired resistant process of PCa cells to paclitaxel.
The qPCR validation found that CREB3L3 was also significantly enhanced in the two resistant cells. Studies indicate that, CREB3L3 is closely associated with the prognosis of gastric cancer, 46 and EWSR1-CREB3L3 gene fusion is related to a mesenteric sclerosing epithelioid fibrosarcoma. 47 CREB3L3 might be another candidate target to reverse the paclitaxel resistance, still waiting for further investigations.
Conclusion
In summary, we successfully established two paclitaxel-resistant cell lines, and provided a comprehensive gene expression profile analysis of the resistant cells. A number of AEGs, CCND2, IGFBP3, FOS, SHH, ZEB2, and members of FGF, FGFR and WNT families were identified in the resistant cells, which might be involved in the process of acquired resistance. Additionally, we also proved that knockdown of TLR-4 reversed the resistance and inhibited resistant phenotype, and provided a potential target for reversing paclitaxel resistance.
Supplemental Material
Supplemental Material - A comprehensive gene expression profile analysis of prostate cancer cells resistant to paclitaxel and the potent target to reverse resistance
Supplemental Material for A comprehensive gene expression profile analysis of prostate cancer cells resistant to paclitaxel and the potent target to reverse resistance by P Che, S Jiang, W Zhang, H Zhu, D Hu and D Wang in Human & Experimental Toxicology
Footnotes
Acknowledgements
We are grateful for the technical support provided by Ma’anshan Institute of Rehabilitation, Shanghai University of Traditional Chinese Medicine in the establishment of resistant cell lines.
Author contributions
DW and DH designed the study. PC, and SJ performed the experiments. PC, SJ and WZ collected the data. PC and HZ analyzed the data. All authors contributed to preparation of the manuscript and approved the final version.
Declaration of conflicting interests
The author(s) declared no potential conflicts of interest with respect to the research, authorship, and/or publication of this article.
Funding
The author(s) disclosed receipt of the following financial support for the research, authorship, and/or publication of this article: This work was supported by the Chongqing Natural Science Foundation (key) (no. cstc2015jcyjBX0045).
Data availability
The data supporting the conclusions of the study are available from the corresponding author upon request.
Supplemental Material
Supplemental material for this article is available online.
References
Supplementary Material
Please find the following supplemental material available below.
For Open Access articles published under a Creative Commons License, all supplemental material carries the same license as the article it is associated with.
For non-Open Access articles published, all supplemental material carries a non-exclusive license, and permission requests for re-use of supplemental material or any part of supplemental material shall be sent directly to the copyright owner as specified in the copyright notice associated with the article.