
Abstract
Quercetin and crocin are the main active constituents of Eucommia and Gardenia species, respectively. This study was conducted to explore the effects of quercetin and crocin on fat reduction and renal fibrosis and the relationship of these compounds with autophagy. First, a model of high-fat diet- and streptozotocin-induced type 2 diabetes was established and then subjected model animals to 8 weeks of metformin, quercetin and crocin gavage. Then, a high glucose-induced rat mesangial cells (RMCs) model was established, and these cells were cocultured with quercetin and crocin. The results showed that quercetin and crocin can decrease fasting blood glucose levels, reduce fat accumulation in the liver, alleviate renal fibrosis, and reduce blood lipid levels. Quercetin and crocin increased autophagy-related protein (LC3, Atg5, Beclin-1 and p-AMPK) levels in the liver and decreased autophagy-related protein (LC3, Atg5, Beclin-1 and p-AMPK) levels in the kidneys. Moreover, quercetin and crocin inhibited the excessive proliferation of RMCs induced by high-glucose (HG) conditions, decreased autophagy-related protein (LC3, Atg5, Beclin-1 and p-AMPK) levels, and decreased TGF-β1 expression. Importantly, cotreatment with quercetin and crocin had a more significant effect than treatment with either compound alone. These results suggest that combined administration of quercetin and crocin can more significantly reduce blood glucose/lipid levels and improve renal fibrosis than administration of either compound alone and that AMPK-dependent autophagy might be involved in this process. Eucommia ulmoides Oliv. and Gardenia could be developed as drugs for Type 2 diabetes treatment.
Key points
Quercetin and crocin, the main active constituents of Eucommia and Gardenia species, can ameliorate type 2 diabetes, induce autophagy in the liver and reduce autophagy in the kidney.
Combined administration of quercetin and crocin can more significantly ameliorate type 2 diabetes than administration of either compound alone.
Eucommia ulmoides Oliv. and Gardenia could be developed as drugs for Type 2 diabetes treatment.
Introduction
Diabetes mellitus (DM) is a metabolic disease with high morbidity and mortality, and the incidence rate is increasing annually worldwide. 1 Type 2 diabetes, the non-insulin-dependent form of DM, accounts for more than 80% of the total number of diabetes cases and is often accompanied by obesity, and its rapid progression can lead to a variety of diabetic complications. 2 Studies have shown that the prominent feature of type 2 diabetes is the presence of varying degrees of high blood glucose and insulin resistance (IR), which is not only the direct cause of diabetes but also the basis for the formation of cardiovascular complications in patients with diabetes. 3 Diabetic nephropathy (DN) is one of the most common complications in diabetic patients and is the most common cause of end-stage renal failure. 4,5 The search for drugs and methods that can reverse high blood glucose levels/IR and improve renal function has become an urgent requirement in modern medicine.
Recent studies have reported new functions of autophagy in the regulation of lipid metabolism and insulin sensitivity. 6 In a long-term (42 weeks) study of HFD-induced cardiomyopathy, HFD feeding resulted in increased blood glucose, total cholesterol and triglyceride levels and decreased autophagy and mitophagy levels. 7 In cardiomyocytes infused with a peptide that enhanced autophagy, autophagy was restored and lipid metabolism was enhanced. 8 The effects of autophagy on type 2 diabetes have attracted the attention of researchers, but the underlying mechanism is still not fully known.
Eucommia ulmoides and Gardenia, important Chinese medicinal materials, are widely cultivated and used in China, Japan and other Asian countries. Eucommia ulmoides contains five major active constituents—phenylpropanoids, iridoids, lignans, polysaccharides and flavonoids—and has antibacterial, antiphlogistic, antipyretic, antihypertensive, antimutagenic, antioxidant, hypolipidemic and other biological activities. 9,10 Gardenia contains three major active constituents—iridoids, flavonoids and crocin—and is known to be effective in inhibiting body weight gain as well as improving abnormal lipid levels, high insulin levels, impaired glucose intolerance, and lipid peroxidation. 11 In the clinic, Eucommia ulmoides and Gardenia have been widely used in the treatment of obesity, hyperlipidemia and diabetes. 11,12 Quercetin and crocin (Supplemental Figure 1) are the main active constituents of Eucommia and Gardenia, respectively, and their therapeutic effects on obesity and diabetes have received the attention of researchers. 13,14
Despite the increase in the clinical usage of Eucommia and Gardenia, the mechanisms underlying the therapeutic effects of quercetin and crocin on obesity and Type 2 diabetes are still not clearly understood. A high-fat diet (HFD) combined with a single intraperitoneal injection of streptozotocin is a widely used method for the induction of obese type 2 diabetes. 15 This model mimics obese type 2 diabetes by increasing blood glucose/lipid levels and inducing DN. In this study, a model of HFD- and streptozotocin-induced type 2 diabetes in rats and a high glucose-induced RMCs model were established. Rats were then gavaged and cells were cocultured with quercetin and crocin to ultimately reveal the roles of autophagy and the underlying protective mechanisms of Eucommia ulmoides and Gardenia against type 2 diabetes.
Materials and methods
Animals and reagents
Adult Sprague-Dawley (SD) rats (male: female 1:1, age, 5 weeks; weight, 100–120 g) were purchased from the Medical Laboratory Animal Center of Guangdong Province. The experimental studies were approved by the Institutional Animal Care and Use Committee of Zunyi Medical College (Approval No: ZYM2018062). The study was conducted in accordance with the basic & clinical pharmacology & toxicology policy for experimental and clinical studies. 16 The rats were housed in a temperature-controlled environment (25°C ± 2°C) on a 12-hour light/dark cycle and with free access to food and water. All efforts were made to minimize animal suffering and decreased the number of animals used. Quercetin and crocin were extracted (via methanol extraction) and purified (via crystallization) from Eucommia ulmoides Oliv. and Gardenia (purity ≥96% (via HPLC)). Rat mesangial cells (RMCs, #CRL-2573, USA) were purchased from the American Type Culture Collection and were cultured in Dulbecco’s modified Eagle’s medium (DMEM, Gibco, USA) supplemented with 10% fetal bovine serum (FBS, Gibco, USA) at 37°C in a humidified atmosphere containing 5% CO2.
Modeling and treatment
Eight rats were fed a normal diet, and 40 rats were fed a high-fat diet (HFD). After 5 weeks of feeding, diabetes was induced in each rat via a single intraperitoneal injection of streptozotocin (Sigma, USA) diluted in citrate buffer (0.1 mol/L, pH 4.0) at a dose of 35 mg/kg. 15,17 Rats in the control group were intraperitoneally injected with the same volume of citrate buffer without streptozotocin and fed a normal diet. One week after STZ injection, fasting blood glucose (FBG) was maintained at >16.7 mmol/L, and the 24 h urine output was greater than 150% of normal, indicating successful establishment of the Type 2 diabetes model. 18 There were a total of 32 model rats. After model establishment, the model rats were randomly divided into five groups of eight rats each: the model group (gavaged with 1 mL of phosphate-buffered saline (PBS)), metformin group (gavaged with 500 mg/kg metformin in 1 mL of PBS), quercetin group (gavaged with 300 mg/kg quercetin in 1 mL of PBS), crocin group (gavaged with 300 mg/kg quercetin in 1 mL of PBS) and quercetin + crocin group (gavaged with 150 mg/kg quercetin + 150 mg/kg crocin in 1 mL of PBS). Gavage was performed with the solutions described above once a day for a total of 8 weeks. All rats were provided free access to drinking water. The doses and duration of quercetin and crocin gavage were determined based on preliminary experiments and previous publications. 19,20
Sampling methods
After 8 weeks, the rats were weighed and were then anesthetized using 1% sodium pentobarbital (35 mg/kg per SD rat) and carefully necropsied. Blood was obtained from the abdominal aorta, and 0.5 mL of blood was immediately transferred to a heparinized microtube and preserved at 4°C for subsequent analysis of glycated hemoglobin (HbA1c). The remaining blood was centrifuged at 5000 rpm for 20 min, and the serum was stored at −80°C until further analysis. The livers and kidneys were rapidly isolated and then stored in liquid nitrogen for oil red O staining, HE staining, Masson staining, Western blotting and qRT-PCR analysis.
Detection of FBG and HbA1c
FBG levels were measured using a portable glucometer (Sinocare; #GA-3, Changsha, China). HbA1c levels were measured using a glycated hemoglobin analyzer (Bayer, #DCA2000, Germany). HbA1c is a reliable marker of blood glucose control in type 2 diabetes patients.
Detection of TCHO, TG, HDL-C and LDL-C
Total cholesterol (TCHO, the total amount of cholesterol contained in lipoproteins in the blood), triglyceride (TG), high-density lipoprotein cholesterol (HDL-C) and low-density lipoprotein cholesterol (LDL-C, a low-density lipoprotein that binds to cholesterol and transports it out of liver tissue) were measured in the blood using biochemical detection kits (Jiancheng, Nanjing, China) according to the manufacturer’s instructions.
Oil Red O staining
Liver tissue was fixed with 4% paraformaldehyde in PBS for 30 min and sliced into 5-µm sections. The sections were dewaxed, dehydrated, and washed with distilled water. The slides were then placed in filtered 0.5% oil red O in dextrin for 20 min, briefly rinsed with running water, and counterstained with hematoxylin for 30 s. Finally, the slides were rinsed with water, and a cover slip was mounted with aqueous mounting medium. Finally, the slides were observed with an inverted microscope (Nikon, USA) at a fixed magnification of 400×. The median optical density (MOD) was analyzed by Image-Pro Plus software (Media Cybernetics, USA). 21
Western blotting
Tissue was ground in liquid nitrogen, and cells were then lysed using lysis buffer. The total protein concentration in the lysates was measured using a micro BCA protein assay kit (Pierce, Rockford, IL, USA). Proteins were separated on 10% SDS-polyacrylamide gels and were then electrophoretically transferred to polyvinylidene difluoride membranes. After incubation in blocking solution (5% nonfat milk) for 1 h, membranes were incubated with anti-LC3 (CST, #3868, USA), anti-P62 (CST, #23214, USA), anti-Beclin-1 (CST, #3495, USA), anti-Atg5 (CST, #12994, USA), anti-p-AMPKser182 (CST, #4186, USA), anti-t-AMPK (CST, #4150, USA), or anti-GAPDH (CST, #5174, USA) antibodies diluted in blocking solution for 2 h at room temperature. Then, membranes were washed with 1× TBST solution and incubated with horseradish peroxidase-conjugated secondary antibodies for 1 h. Next, membranes were incubated with ECL solution (Millipore, Darmstadt, Germany) and imaged. Densitometric analysis of the Western blots was with ImageJ 2x software (Rawak Software, Inc., Germany). The relative band intensities were calculated as the ratios of the gray value of the band corresponding to the protein of interest to that of the band corresponding to GAPDH. 22
Renal histological examination
Kidney tissues were fixed with 4% (w/v) paraformaldehyde in phosphate-buffered saline (PBS) for 20 min and were then sliced into 3-µm sections after paraffin embedding. Paraffin sections were deparaffinized and rehydrated prior to staining with hematoxylin and eosin for examination of the kidney cellular structure and with Masson’s trichrome for the detection of collagen deposition in the renal interstitium. Finally, visual analysis was performed with an Olympus inverted microscope (Olympus, CX71, Japan). 23
Immunohistochemistry
Tissue sections (3 μm) were incubated for 2 h at 56°C and deparaffinized. After hydration and blocking, slides were treated with peroxide and incubated with the target primary antibody against TGF-β1 (Abcam, ab92486, USA) overnight. After washing with PBS and incubating with the secondary antibody at 37°C for 30 min, slides were treated with 3,3’-diaminobenzidine (DAB) solution. Finally, slides were lightly counterstained with hematoxylin and dehydrated. Visual analysis was performed with an Olympus fluorescence microscope (Olympus, CX71, Japan) at 400× magnification. The MOD was analyzed with Image-Pro Plus software (Media Cybernetics, USA). 24
In vitro cell proliferation experiment
Near-confluent RMCs were incubated in DMEM supplemented with 2% FBS for 24 h to arrest and synchronize cell growth. The synchronized RMCs were cultured in standard DMEM supplemented with 5.5 nM glucose (low-glucose, LG) or 30 nM glucose (high-glucose, HG) for 72 h. The synchronized RMCs were cultured in the presence of metformin (500 μg/mL), quercetin (100 μg/mL), crocin (100 μg/mL) and quercetin + crocin (50 μg/mL + 50 μg/mL) and were subsequently used for cell proliferation assays and Western blotting.
The synchronized RMCs were seeded in triplicate in 96-well plates (1 × 10³ cells/well) and cultured for 24, 48 and 72 h. After culture, 10 µl of CCK-8 working reagent (Beyotime, China) was added to the medium, and the cells were incubated for 1 h. Cell proliferation was assessed at 24, 48 and 72 h by measuring the absorbance at 450 nm using a microplate reader (680 Microplate Reader; Bio-Rad Laboratories, Hercules, CA, USA). The assays were repeated three times. 23
Statistical analysis
Data were statistically analyzed and graphed using GraphPad Prism 5 (GraphPad Software, San Diego, CA, USA), and are presented as the mean ± standard deviations (SDs). Multiple comparisons were made among ≥ three groups using one-way ANOVA followed by the Bonferroni post hoc test. P < 0.05 was considered to denote statistical significance.
Results
Quercetin and crocin reduced the fasting blood glucose level
After quercetin and crocin treatment, the levels of FBG and HbA1c in blood were measured. The results (Table 1) showed that the levels of FBG and HbA1c in rats with type 2 diabetes were markedly increased compared with those in control group rats. After metformin, quercetin and/or crocin treatment, the levels of FBG and HbA1c were significantly decreased (P < 0.05). In addition, the levels of FBG and HbA1c were significantly decreased in quercetin + crocin group compared with quercetin group and crocin group (P < 0.05). These data showed that quercetin and crocin reduced blood glucose level and that cotreatment with quercetin and crocin had a more significant effect on decreasing blood glucose level than treatment with either compound alone.
Levels of FBG and HbA1c in each group.

Data are presented as mean ± SDs (n = 8). *P < 0.05 compared to the control group, #P < 0.05 compared to the model group, @P < 0.05 compared to the quercetin group, &P < 0.05 compared to the crocin group, ▾P < 0.05 compared to the quercetin + crocin group.
Quercetin and crocin reduced blood lipid levels
Biochemical detection kits were used to evaluate the effects of quercetin and crocin on the levels of TCHO, TG, HDL-C and LDL-C in blood. The results (Table 2) showed that the levels of TCHO, TG, and LDL-C were significantly increased and that of HDL-C was decreased in the model group compared to the control group (P < 0.05). Furthermore, metformin, quercetin, crocin and quercetin + crocin markedly decreased the levels of TCHO, TG, and LDL-C in the blood and increased the HDL-C level (P < 0.05) compared to the corresponding levels in the model group. In addition, cotreatment with quercetin and crocin had a more significant effect on reducing blood lipid levels than treatment with either compound alone.
Levels of TCHO, TG, HDL-C and LDL-C in each group.

Data are presented as mean ± SDs (n = 8). *P < 0.05 compared to the control group, #P < 0.05 compared to the model group, @P < 0.05 compared to the quercetin group, &P < 0.05 compared to the crocin group, ▾P < 0.05 compared to the quercetin + crocin group.
Quercetin and crocin reduced fat accumulation in the livers of rats with Type 2 diabetes
Oil red O staining of liver tissue (Figure 1) showed very few orange-red lipid droplets in the cytoplasm in the control group and indicated that the boundaries of the liver cells were clear. The model group showed a large number of lipid droplets, accompanied by an increase in the hepatocyte volume and vacuolization. After metformin, quercetin, crocin and quercetin + crocin treatment, the numbers of lipid droplets decreased markedly (P < 0.05), and vacuolization improved. These findings showed that quercetin and crocin reduced fat accumulation in the livers of rats with Type 2 diabetes and that cotreatment with quercetin and crocin had a more significant effect on decreasing fat accumulation than treatment with either compound alone.

Oil red O staining of liver tissue in each group. The MOD of the red-stained area was calculated using Image-Pro Plus 6.0 software. Magnification, 400×. The data are presented as the means ± SDs (n = 5). *P < 0.05 compared to the control group, #P < 0.05 compared to the model group, @P < 0.05 compared to the quercetin group, &P < 0.05 compared to the crocin group.
Quercetin and crocin alleviated HG-induced fibrosis in the kidneys of rats with Type 2 diabetes
HE staining for renal histological examination revealed basement membrane thinning, glomerular atrophy, and proximal convoluted tubule damage in the model group, and these pathological abnormalities were improved after quercetin and crocin treatment. Masson staining revealed interstitial fibrosis and glomerular sclerosis (blue areas) in the model group and a reduction in interstitial fibrosis after quercetin and crocin treatment (Figure 2A). Immunohistochemical staining of transforming growth factor-β1 (TGF-β1, a profibrotic factor that drives kidney fibrosis) showed that the expression levels of TGF-β1 were increased in the model group compared with the control group and that treatment with either quercetin or crocin decreased TGF-β1 expression. Additionally, crocin had stronger effects on renal fibrosis (as evaluated by Masson staining and TGF-β1 expression) than quercetin, and cotreatment with quercetin and crocin had stronger positive effects on renal fibrosis than treatment with either compound alone (Figure 2A and 2B). These comparisons showed that quercetin and crocin alleviated HG-induced fibrosis in the kidneys of rats with Type 2 diabetes.
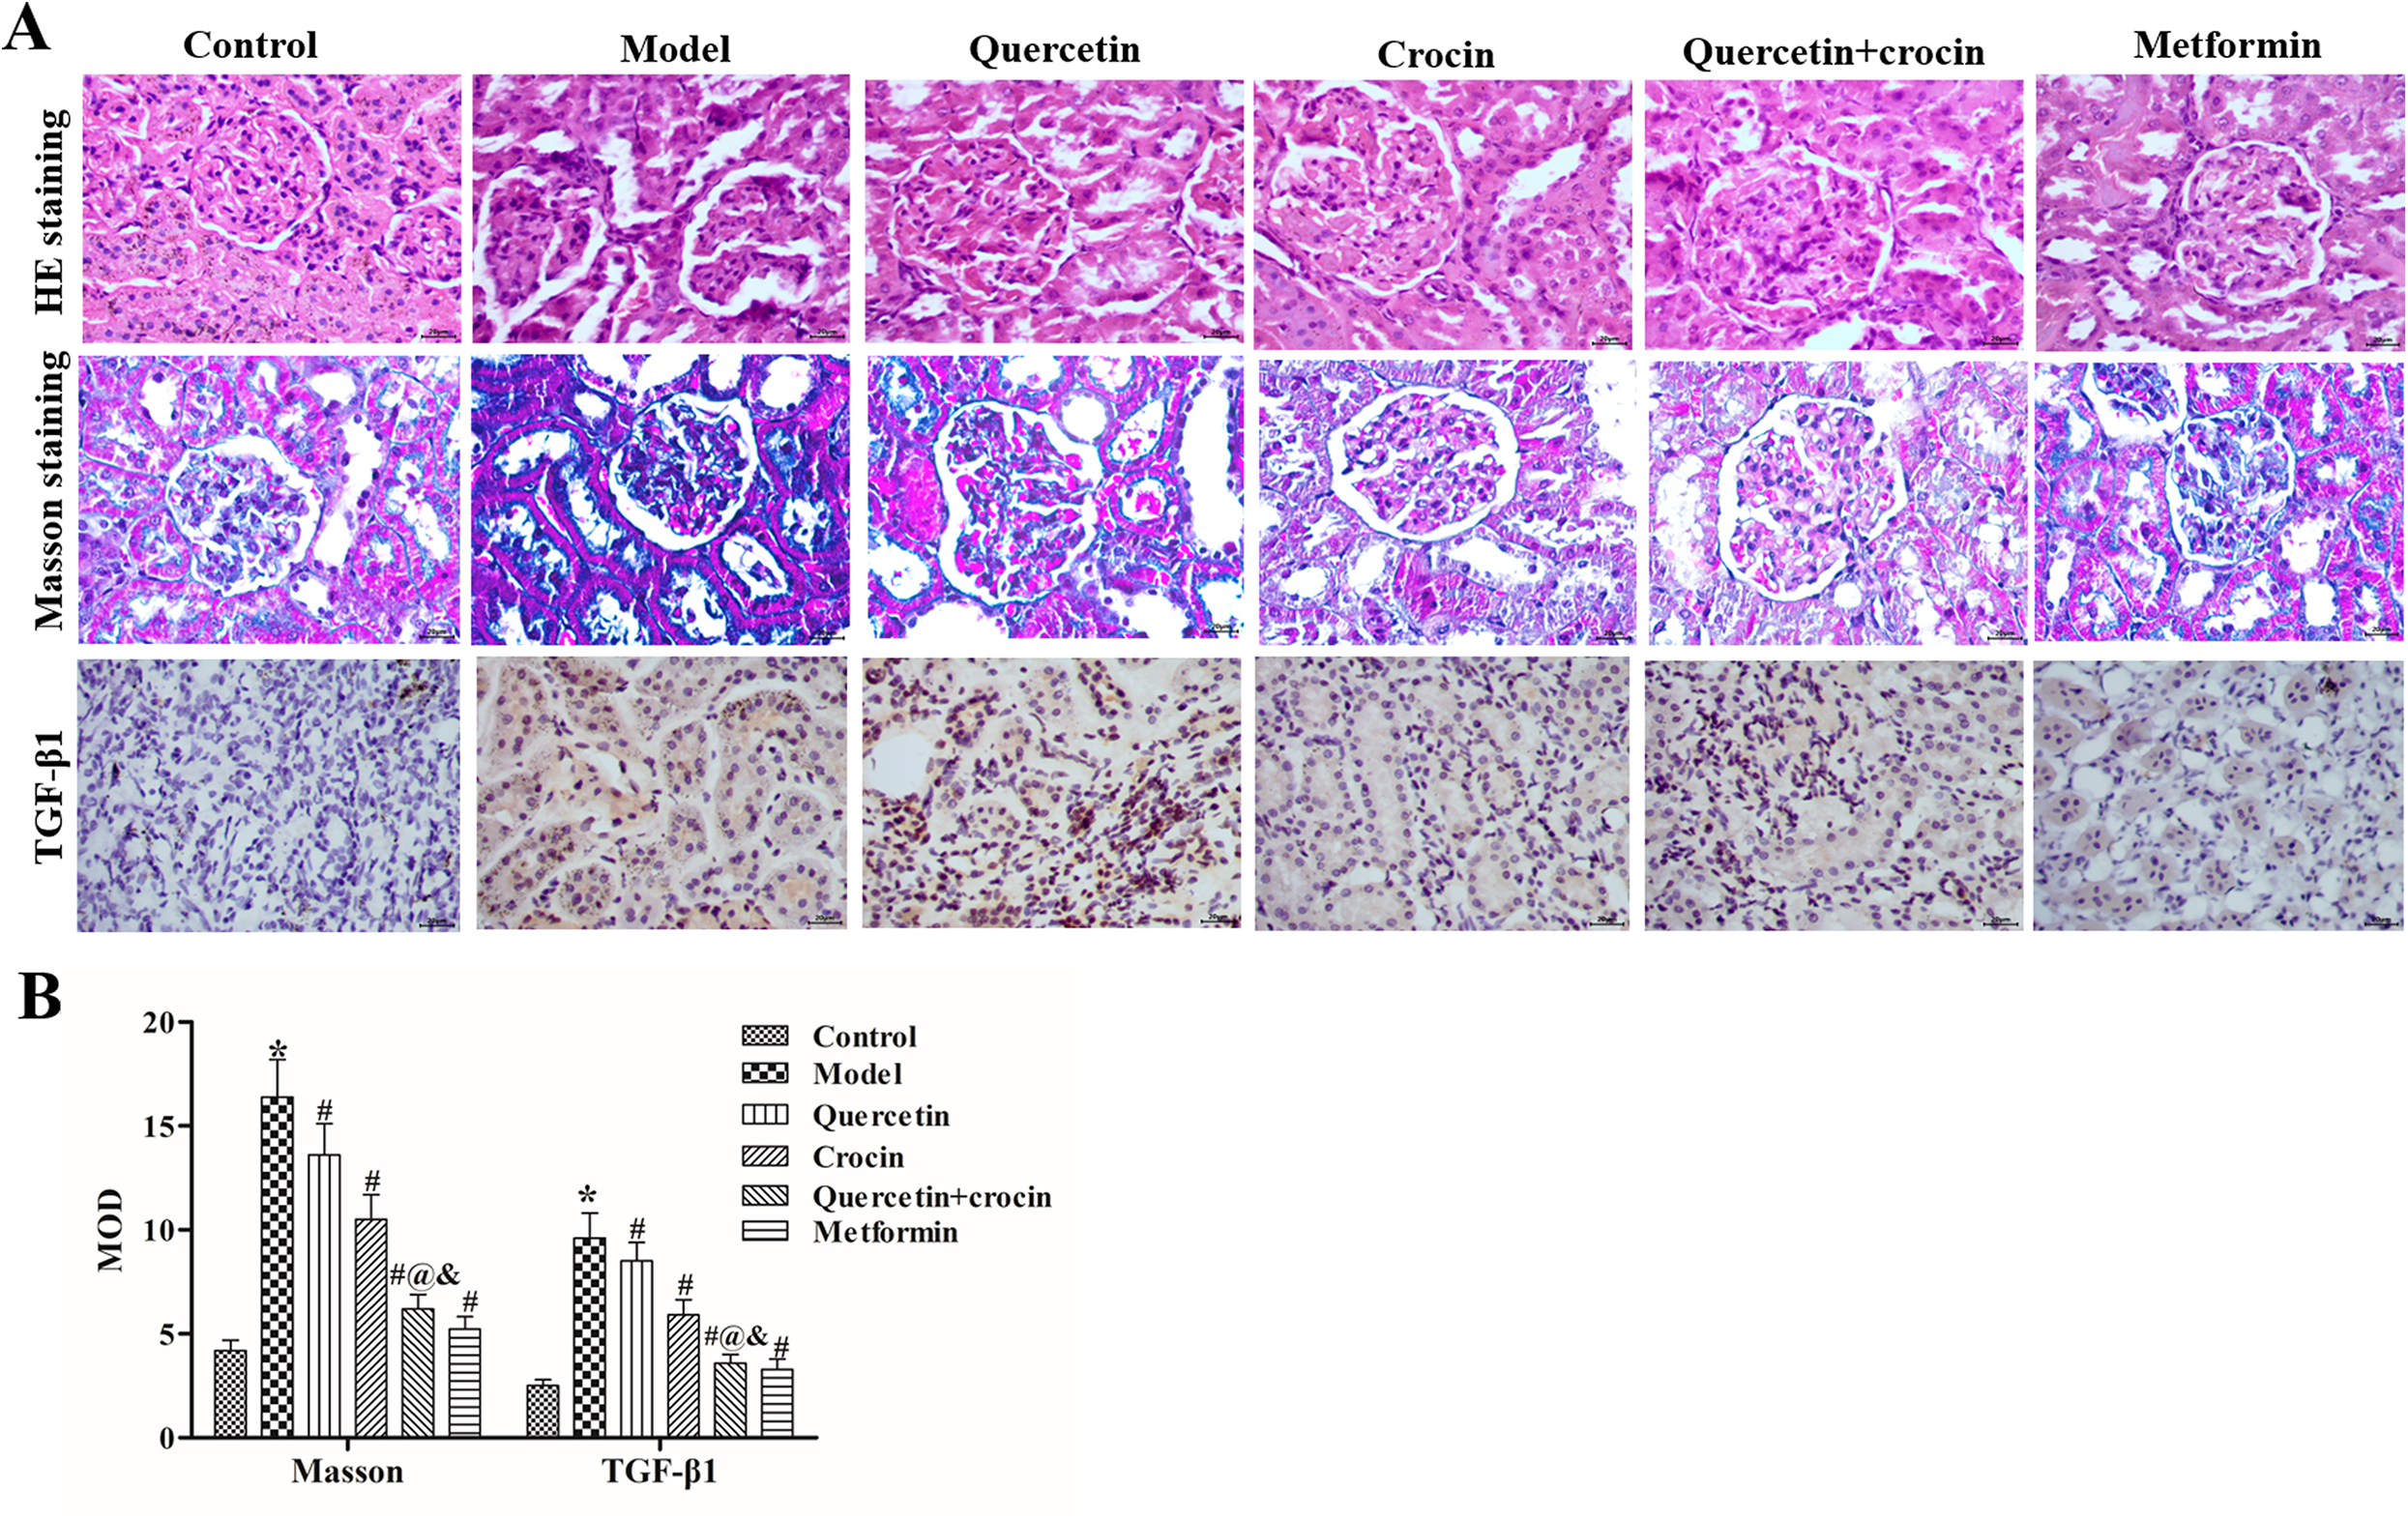
Effects of quercetin and crocin on morphologic changes in the kidneys. (A) Images of HE, Masson and immunofluorescence of kidney tissues in each group. Magnification, 400×. (B) The MOD values of Masson staining (blue area) and TGF-β1 staining were calculated using Image-Pro Plus 6.0 software. The data are presented as the means ± SDs (n = 8). *P < 0.05 compared to the control group, #P < 0.05 compared to the model group, @P < 0.05 compared to the quercetin group, &P < 0.05 compared to the crocin group.
Quercetin and crocin induced autophagy in the livers of rats with Type 2 diabetes
In the liver (Figure 3A and 3B), the LC3II/I ratio and Beclin-1 and Atg5 expression levels were decreased in the model group in contrast to the control group, and treatment with either metformin, quercetin or crocin significantly increased the LC3II/I ratio and Beclin-1 and Atg5 expression levels (Figure 3A and 3B, P < 0.05). In contrast, treatment with either quercetin or crocin decreased P62 expression. Moreover, the effects of cotreatment with quercetin and crocin were significantly stronger than the effect of either quercetin or crocin treatment alone (P < 0.01). Furthermore, AMPK phosphorylation was downregulated in the model group compared with the control group, and treatment with either quercetin or crocin induced upregulation of AMPK phosphorylation. Additionally, the total (t-)AMPK expression level remained unchanged in the five groups. These results revealed that quercetin and crocin regulated AMPK-dependent autophagy-related protein expression in the liver and that cotreatment with quercetin and crocin had a more significant effect on autophagy than treatment with either compound alone.

Western blot analyses of autophagy-related proteins in the liver and kidneys. 1: Control group, 2: model group, 3: quercetin group, 4: crocin group, 5: quercetin + crocin group, 6: metformin group. (A) Image of a Western blot of liver tissues. (B) Grayscale analyses of the relative LC3II/I, Beclin-1/GAPDH, P62/GAPDH, Atg5/GAPDH and p-AMPK/t-AMPK levels in the liver. (C) Image of a Western blot of kidney tissues. (D) Grayscale analyses of the relative LC3II/I, Beclin-1/GAPDH, P62/GAPDH, Atg5/GAPDH and p-AMPK/t-AMPK levels in the kidneys. The data are presented as the means ± SDs (n = 8). *P < 0.05 compared to the control group, #P < 0.05 compared to the model group, @P < 0.05 compared to the quercetin group, &P < 0.05 compared to the crocin group, ▾P < 0.05 compared to the Quercetin + crocin group.
Quercetin and crocin inhibited autophagy in the kidneys of rats with Type 2 diabetes
In kidney tissues (Figure 3C and 3D), the LC3II/I ratio and Beclin-1 and Atg5 expression levels were increased in the model group in contrast to the control group, and treatment with either quercetin or crocin significantly decreased the LC3II/I ratio and Beclin-1 and Atg5 expression levels (Figure 3C and 3D, P < 0.05). In contrast, treatment with either quercetin or crocin increased P62 expression. Moreover, the effects of cotreatment with quercetin and crocin were significantly stronger than the effects of quercetin or crocin treatment alone (P < 0.01). Furthermore, AMPK phosphorylation was upregulated in the model group compared with the control group, and treatment with either quercetin or crocin induced downregulation of AMPK phosphorylation. These results revealed that quercetin and crocin regulated AMPK-dependent autophagy-related protein expression in the kidneys and that cotreatment with quercetin and crocin had a more significant effect on autophagy than treatment with either compound alone.
Quercetin and crocin inhibits excessive proliferation of RMCs induced by HC conditions
The results of the cell proliferation assay showed that the OD values in the high-glucose (HG) group were significantly higher than those in the low-glucose (LG) group (Figure 4A) (P < 0.05), which indicated that HG induced excessive proliferation of RMCs. However, after treatment with either metformin, quercetin or crocin, the OD values were decreased significantly (Figure 4B, P < 0.05). Additionally, quercetin and crocin decreased the LC3II/I ratio and the expression levels of Beclin-1, Atg5 and TGF-β1 and increased P62 expression. These results indicated that quercetin and crocin inhibited HG-induced excessive proliferation and regulated RMCs autophagy and fibrosis, and cotreatment with quercetin and crocin had a more significant effect on RMCs proliferation/autophagy/fibrosis than treatment with either compound alone.

Effects of quercetin and crocin on RMCs proliferation and autophagy-related protein expression. Synchronized RMCs were cultured in standard DMEM supplemented with 5.5 nM glucose (LG) or 30 nM glucose (HG) and quercetin or crocin prior to cell proliferation assays. (A) High glucose levels induced RMCs proliferation. (B) Quercetin and crocin inhibited RMCs proliferation. (C) Image of a Western blot for each group. 1: Control group, 2: model group, 3: quercetin group, 4: crocin group, 5: quercetin + crocin group, 6: metformin group. (D) Grayscale analyses of the relative LC3II/I, Beclin-1/GAPDH, P62/GAPDH, Atg5/GAPDH, p-AMPK/t-AMPK and TGF-β1/GAPDH levels. The data are presented as the means ± SDs (n = 3). *P < 0.05 compared to the control group, #P < 0.05 compared to the model group, @P < 0.05 compared to the quercetin group, &P < 0.05 compared to the crocin group, ▾P < 0.05 compared to the quercetin + crocin group.
Discussion
Diabetes causes an imbalance in internal metabolic processes and results in the development of a wide range of diseases 25 ; in addition, intake of natural products can regulate energy metabolism. 26 As Chinese medicinal materials, Eucommia ulmoides Oliv. and Gardenia are promising therapeutic drugs for type 2 diabetes. Hung MY et al. found that oral administration of an aqueous extract of Du-Zhong (Eucommia ulmoides Oliv.) leaves for 28 consecutive days significantly decreased the intensity of hepatic damage induced by CCl4 in rats and improved liver function. 27 Aqueous extract of Gardenia is effective in lowering blood glucose and lipid levels, and it has significant effects on reducing serum insulin, improving insulin sensitivity and reducing blood lipid levels. 28 Zhou et al. found that Gardenia could normalize dysfunctions in phenylalanine metabolism, tryptophan metabolism, and secondary bile acid biosynthesis pathways induced by diabetes. 29 This study verified that quercetin and crocin have therapeutic effects on obesity and type 2 diabetes, a result that is basically consistent with those of previous studies. Importantly, it was found that cotreatment with quercetin and crocin had a more significant effect on Type 2 diabetes than treatment with either compound alone, providing a basis for research on combination therapies for Type 2 diabetes in the clinic.
Studies have shown that the main renal histological changes in DN are caused by excessive deposition of extracellular matrix (ECM), which results in glomerular sclerosis and tubulointerstitial fibrosis. 30,31 There is increasing consensus that renal failure in patients with type 2 diabetes is preventable. Therefore, the need to identify novel pharmacological approaches to effectively retard/stop glomerular sclerosis and tubulointerstitial fibrosis is urgent. 32 In recent years, many experts have worked to identify herbs or herbal extracts that inhibit renal fibrosis both in vivo and in vitro, with some success. 33 Quercetin and crocin (extracts of Eucommia ulmoides Oliv. and Gardenia, respectively) can also inhibit renal fibrosis (as demonstrated by Masson staining and TGF-β1 immunofluorescence). Considering this finding, intake of quercetin and crocin can slow the progression of type 2 diabetes.
Dysregulated autophagy is implicated in the pathogenesis of type 2 diabetes and DN. 34 It is generally believed that autophagy has different roles during different stages and in different tissues. 35 Obesity affects autophagy in a tissue-specific manner, activating autophagy in adipocytes and impairing autophagy in hepatocytes, immune cells, and so on. 36 5’-AMP-activated protein kinase (AMPK) is a critical regulator of autophagy in vivo, and activation of AMPK is always accompanied by stimulation of autophagy in type 2 diabetes. 37 Therefore, AMPK-dependent pathways might be involved in the regulation of autophagy in DN. In this type 2 diabetes model, quercetin and crocin induced AMPK-dependent autophagy in the liver and inhibited AMPK-dependent autophagy in the kidneys. In rats with Type 2 diabetes, activation of liver autophagy by rapamycin improves IR and hepatic steatosis. 38 These natural active constituents (quercetin and crocin) have regulatory effects on autophagy similar to those of manufactured chemical substances.
Unfortunately, we only studied the main organs (liver and kidneys) of rats with type 2 diabetes or DN but did not assess autophagy-related proteins in other tissues (such as adipose tissue); this omission is a limitation of this research and a direction for further research. In addition, further research is needed to study the other effects of quercetin and crocin (Eucommia ulmoides Oliv. and Gardenia) and their other underlying mechanisms.
Conclusion
In conclusion, this study showed that both quercetin and crocin can regulate fasting blood glucose/lipid levels, reduce fat accumulation in the liver, alleviate renal fibrosis, and play a part in the AMPK-dependent autophagy process. Most importantly, combined administration of quercetin and crocin can reduce blood sugar/lipid levels and improve renal fibrosis more significantly than administration of either compound alone.
Supplemental material
Supplemental_Figure_1 - Protective effects of quercetin and crocin in the kidneys and liver of obese Sprague-Dawley rats with Type 2 diabetes: Effects of quercetin and crocin on T2DM rats
Supplemental_Figure_1 for Protective effects of quercetin and crocin in the kidneys and liver of obese Sprague-Dawley rats with Type 2 diabetes: Effects of quercetin and crocin on T2DM rats by Ling-Lin Lai, Hui-Qin Lu, Wen-Na Li, Hui-Ping Huang, He-Ying Zhou, En-nian Leng and Yue-yue Zhang in Human & Experimental Toxicology
Footnotes
Author contributions
WL and LL conceived and designed the experiments. LL and HL performed the experiments. HH contributed the statistical analysis. EL and YZ contributed the revison. LL and HZ wrote the paper.
Declaration of conflicting interests
The author(s) declared no potential conflicts of interest with respect to the research, authorship, and/or publication of this article.
Funding
The author(s) disclosed receipt of the following financial support for the research, authorship, and/or publication of this article: This work was supported by the Guangdong Medical Scientific Research Fund (No. B2019081), the National Natural Science Foundation of China (No. 81760697), and the Guizhou Science and Technology Foundation (No.QKHJC [2017]1220).
Statement of ethics
The experimental studies were approved by the Institutional Animal Care and Use Committee of Zunyi Medical College (Approval No: ZYM2018062).
Supplemental material
Supplemental material for this article is available online.
References
Supplementary Material
Please find the following supplemental material available below.
For Open Access articles published under a Creative Commons License, all supplemental material carries the same license as the article it is associated with.
For non-Open Access articles published, all supplemental material carries a non-exclusive license, and permission requests for re-use of supplemental material or any part of supplemental material shall be sent directly to the copyright owner as specified in the copyright notice associated with the article.