
Abstract
Calprotectin is a heterodimeric EF-hand Ca2+ binding protein that is typically released by infiltrating polymorphonuclear leukocytes and macrophages. This protein is a key player linking inflammation and cancer. Due to the increased levels of calprotectin in different inflammatory diseases and cancer, it is considered as a marker for diagnostic purposes. In this study, we evaluated the mechanism of cell viability and apoptotic-inducing effects of recombinant human calprotectin (rhS100A8/S100A9) on the gastric adenocarcinoma (AGS), the most common type of gastric cancer cell line. AGS cells were exposed to the different concentrations (5–100 μg/ml) of calprotectin for 24, 48, and 72 h, and cell viability was assessed through 3-(4,5-dimethylthiazol-2-yl)-2,5-diphenyltetrazolium bromide assay. Apoptotic-inducing effects of calprotectin were evaluated by sub-G1 cell cycle assay and Annexin V/propidium iodide double staining. Furthermore, real-time polymerase chain reaction and Western blot analysis were performed to evaluate the mechanism of action of calprotectin. Our findings indicated that calprotectin inhibits growth and viability of AGS cells in a time- and dose-dependent manner. The half-maximal inhibitory concentration values were measured as 85.77, 79.14, and 65.39 μg/ml for 24, 48, and 72 h, respectively. Additionally, we found that calprotectin downregulated the expression of antiapoptotic protein Bcl-2 and upregulated proapoptotic protein Bax in a time- and concentration-dependent fashion. Calprotectin also slightly upregulated the expression of extracellular signal-regulated protein kinase 2 (ERK2), while it significantly decreased the levels of phospho-ERK in a time-dependent manner. Overall, these findings indicated that calprotectin has cytotoxicity and apoptosis-inducing effects on AGS cell lines in high concentration by modulating Bax/Bcl-2 expression ratio accompanied by inhibition of ERK activation.
Introduction
Gastric cancer (GC) is known as the most common malignancies and significant causes of cancer-related death worldwide. The potent invasion and metastasis ability of this disease result in poor prognosis. 1 According to pathology, epidemiology, and etiology differences, GC is classified into two main types in Lauren classification that includes intestinal and diffuse types. Intestinal type occurs within the inner layers of the stomach; cells exhibit adhesion and are arranged in tubular or glandular formations and associated with lymphatic or vascular invasion. Diffuse type of GC often spread in the upper layers; cells lack adhesion and infiltrate the stroma as single cells or small population and scattered tumor cells. 2,3 Adenocarcinoma, which belongs to intestinal type, is the most common type of GC (up to 95%), originates from the inner surface of the stomach known as the gastric mucosa, and affects the glandular cells of the stomach. 4 The infection by gram-negative bacterium, Helicobacter pylori, is known as the main leading cause for initiating and development of gastric adenocarcinoma. H. pylori damages the gastric mucosa, changes gastric physiology, and finally leads to gastric inflammation. 5 Recent data have explained that many cancers arise from the sites of infection, chronic irritation, and inflammation. 6,7 The inflammatory microenvironment, specially H. pylori infection site in gastric mucosa, is largely enriched for Calprotectin 8 highlighting the possible inhibitory effects of this protein on gastric adenocarcinoma progression. Calprotectin (S100A8/S100A9) belongs to S100 superfamily and is a heterodimeric complex of EF-hand Ca2+ binding proteins. The EF-hand motif contains a helix–loop–helix topology, in which the Ca2+ ions are coordinated by ligands within the loop. 9 It comprises two subunits, S100A8 (myeloid related protein 8 (MRP8) or calgranulin A) with 93 residues and 10.8-kDa molecular weight and S100A9 (myeloid related protein 14 (MRP14) or calgranulin B) with 113 residues and 13.2-kDa molecular weight. The expression of S100A8/S100A9 increased in different inflammatory disease, including inflammatory bowel disease, rheumatoid arthritis, cystic fibrosis, chronic bronchitis, autoimmune disease, neurodegenerative disorders, and many types of cancers. 10 –12 Both S100A8 and S100A9 subunits have two EF-hand helix–loop–helix structural motifs: the N-terminal motif or EF-hand I comprising the noncanonical Ca2+-binding loop and the C-terminal motif or EF-hand II including the canonical Ca2+-binding loop. Two EF-hands are separated by linker regions of different lengths in both proteins (Figure 1). 13 Calprotectin as a damage-associated molecular pattern 8,14 plays as an endogenous ligand when secreted from activated neutrophil cells to the extracellular space. Previous studies have reported the apoptotic effects of extracellular S100A8/S100A9 dimer and its monomers individually on various types of cancer cells. 8 It has been reported that the cytotoxic/apoptotic effect of S100A8/S100A9 dimer is more than its subunits. 15,16

(a) The structure of calprotectin (S100A8/S100A9); each calprotectin monomer consists of two Ca2+ binding EF-hand motifs in the N-terminal and C-terminal of sequence which are connected by a linker region (hinge region). (b) The tertiary and quaternary structures of S100A8/S100A9 complex protein.
The mitogen-activated protein kinase (MAPK) pathways are involved in S100A8/S100A9-induced extracellular signal-regulated protein kinase (ERK) and nuclear factor κB (NF-κB) activation during inflammation. 17 The ERK is a serine/threonine protein kinase, which belongs to the MAPKs superfamily. ERK is a member of Ras-Raf-MEK-ERK signal cascade and its phosphorylation and activation form leads to phosphorylation of many downstream targets, which control the series of cell events. 18 Phosphorylated ERK translocates to the nucleus, where it acts on the NF-κB, activator protein 1 (AP-1), C-myc, and other nuclear transcription factors. These occurrences lead to the regulation of gene expression which is involved in the tumor cell cycle, proliferation, survival, growth, differentiation, and motility. 19,20 S100A8/S100A9 stimulates the production of pro-inflammatory cytokines (tumor necrosis factor alpha (TNF-α) and interleukin-6 (IL-6)) in BV-2 microglial cells via ERK/NF-κB and c-Jun N-terminal kinases (JNKs)/NF-κB signaling pathways. 21
Overexpression and activation of ERK have been found in many human malignant tumors and, as such, represented an attractive target for the development of anticancer drugs. 17 In addition, calprotectin leads to activation of other signaling pathways in various cells, including phosphoinositide 3-kinase, the Ras homologous-GTPases, the Janus kinase/signal transducers and activators of transcription, cell division control protein 42 homolog/Ras-related C3 botulinum toxin substrate 1. In addition, activation of NF-κB and AP-1 leads to the production of special inflammatory agents such as cytokines, interleukins, TNF-α, and chemokines due to the effects of calprotectin. 8,21 –23 Calprotectin also has a regulatory effect on tumor progression. In tumor cells, S100A8/S100A9 induces activation of NF-kB, which enhances expression of genes, including Cxcl1, Ccl5 and Ccl7, Slc39a10, Lcn2, Zc3h12a, Enpp2 whose products are known in angiogenesis, tumor migration, wound healing, and formation of pre-metastatic niches into the surrounding tissue and organs. 16,24,25 Moreover, the expression of different kinds of matrix metalloproteinases (MMPs) such as MMP10, MMP1, MMP2, and MMP9, which play an important role in tumor migration and invasion, was increased after S100A8/S100A9 treatment in tumor cells. S100A8/S100A9 knockdown in the MC38 and Lewis lung carcinoma (LLC) cancer cells leads to a reduction in MMP2 and MMP9 expression, which is consistent with a decrease in tumor cell migration and invasion. 26,27 Based on these aforementioned evidence, we examined the effect of calprotectin on AGS cells at different concentrations and incubation times. Afterward, the expression of Bax, Bcl-2, and ERK2 at mRNA and protein levels were evaluated in AGS treated with and without calprotectin through real-time polymerase chain reaction (PCR) and Western blot analysis. Our observations provide novel insights into the molecular mechanisms of S100A8/S100A9-inducing apoptotic effects by surveying the role of ERK2 and Bcl-2 family members, which play a significant role in the apoptosis pathways.
Materials and methods
Materials
Competent Escherichia coli strain BL21 (DE3) and the N-terminal S100A9 and S100A9 coding sequence were provided by Novagen Pharma (Pretoria, South Africa). Isopropyl β-
Methods
Recombinant protein production
Transformation of expression vectors of pET15b containing the coding region of S100A8 and S100A9 was used to express the His-tagged fusion proteins by CaCl2/heat shock method in Escherichia coli strain BL21 (DE3) as a host cell. Ampicillin in a concentration of 100 µg/ml was utilized as the selective marker for detection of the recombinant bacterial colonies that contain vectors. The single colony of recombinant bacterial colonies was cultured separately in liquid broth media until the optical density (OD 600) reached 0.5–0.6. IPTG (1 mM) was used as an inducer for expression of recombinant proteins. Cells were allowed to grow for 6 h before harvesting and then were pelleted by centrifugation at 5000 × g for15 min. Cells were incubated in lysis buffer (50-mM Tris, 150-mM NaCl, 2-mM MgCl2, 10-mM dithiothreitol (DTT), 10-mM imidazole, protease inhibitor cocktail, pH 7.8) and lysed by sonication. Cell debris was removed by centrifugation (30 min at 18,000 × g and at 4°C), and the clarified supernatants were kept. The purification of recombinant His-tagged proteins was performed using Ni-NTA affinity chromatography with a 50–200-mM stepwise imidazole gradient (Macherey-Nagel, Dueren, Germany). Imidazole was subsequently removed by dialysis which was carried out in the buffer containing 100-mM NaCl, 25-mM NaH2PO4, pH 7.8 at 4°C for 24 h. Purified recombinant His-tagged S100A8 and S100A9 were observed with the SDS-polyacrylamide gel electrophoresis (PAGE) analysis. The functional and structural investigation was implemented using fluorescence intensity measurements, Fourier-transform infrared spectroscopy, and circular dichroism spectroscopy as reported in our previous study 28,29 (data not shown). The crystal structure of human calprotectin (S100A8/S100A9) with Protein Data Bank (PDB) code 1xk4 was downloaded from PDB, https://www.rcsb.org/, was edited by Discovery Studio 4.1 Client. The secondary structure of this protein was represented by Chimera 1.10.2 software. 30,31
Cell culture
The AGS cells were cultured in RPMI-1640 medium supplemented with 10% FBS, penicillin (100 IU/ml), and streptomycin (100 μg/ml) in a humidified CO2 incubator containing 5% CO2 at 37°C. Cell cultures were maintained under logarithmic growth conditions. Cells were harvested with trypsin (0.25%) and counted by trypan blue cell staining solution and Neubauer slide.
Cell viability measurement
The cytotoxicity of S100A8/S100A9 toward AGS cell line was determined by MTT assay. The cells were cultured overnight at a density of 5000 cells/well in three 96-well plate culture. After cell attachment, the medium was replaced with a medium containing different concentrations (5–100 μg/ml) of S100A8/S100A9, and the cells were incubated for 24, 48, and 72 h. At the end of this period, 10 μl of MTT solution stock (5 mg/ml in phosphate buffered saline (PBS)) was added to each well as the way that final concentration has been 0.5 mg/ml, and the plates were incubated for 4 h at 37°C. Dissolved yellowish MTT is converted to an insoluble purple formazan by cleavage of the tetrazolium ring by active mitochondrial dehydrogenase enzymes of living cells which used to develop an assay system alternative to other assays for measurement of cell proliferation. Afterward, solubilization solution (200-μl DMSO + 25-μl glycine buffer) was added into each well, and the OD was determined against blank reagent with multiwall scanning spectrophotometer (ELISA reader, Organon Teknika, Netherlands) at a wavelength of 570 nm. 32 Eventually, the measurements of blank were subtracted from all the control and treated measurements, and then, the percentages of cell viability and cytotoxicity were calculated according to the following formulas


Annexin V/PI double staining assay
For flow cytometry analyses, double staining with FITC-Annexin V for detection of exposed phosphatidylserine which translocate from the inner cytoplasmic membrane to cell surface at early apoptotic cells and propidium iodide (PI) that is capable of binding and labeling DNA fragment at late apoptotic cells were used, according to the manufacturer’s instructions. AGS cells were cultured into six-well plates at a density of 3 × 10⁵ cells and then were treated with half-maximal inhibitory concentrations (IC50) of S100A8/S100A9 for 24, 48, and 72 h. All floated and adherent cells were harvested and centrifuged at 1500 r/min for 5 min. The cell pellet was washed twice with PBS and then resuspended in the 100-μl binding buffer. FITC-Annexin V (2 μl) was added to the cells and incubated at room temperature for 20 min in the dark and followed by the addition of 2-μl PI and then subjected to flow cytometer (Becton Dickinson FACS, Holdrege, NE (Nebraska), USA). 33
Cell cycle analysis
AGS cells were cultured into six-well plates at a density of 3 × 10⁵ cells and then were treated with IC50 concentrations of S100A8/S100A9 for 24–72 h. The IC50 values of calprotectin had been obtained by MTT assay. All floated and adherent cells were harvested and centrifuged at 1500 × g for 5 min. The cell pellet was washed twice with PBS. Afterward, 50 μg/ml of PI containing 20 μg/ml of RNase A was added and incubated in the darkroom at 37°C for 2 h. 34 The stained cells were then analyzed by flow cytometry (Becton Dickinson FACS). Calculated cell percent in the sub-G1, G0/G1, S, and G2/M phases were analyzed using Multicycle Cell Cycle Software (Partec PAS, Münster, Germany).
Real-time PCR
The mRNA levels of Bax, Bcl-2, ERK2 (MAPK1), and glyceraldehyde 3-phosphate dehydrogenase (GAPDH) genes in S100A8/S100A9-treated AGS cells with different concentrations (0, 25, 50, 75, 100, and 125 μg/ml) for 24, 48, and 72 h were evaluated with a highly sensitive, qRT-PCR method. Gene expression was determined using the ABI Step One Real-Time PCR (Applied Biosystems™, USA) system and SYBR Green master mix. The cycling thermal profile used to amplify the target cDNA sequences involved 95°C for initial denaturation for 7 min, followed by 40 cycles of denaturation at 95°C for 30 s, annealing at 60°C for 30 s, and extension at 72°C for 30 s. Primers for qRT-PCR were designed and obtained from Sinaclon Company. Sequences of primers are as follows: human Bax: 5′-GCCTCCTCTCCTACTTTG-3′ (forward) and 5′-CTCAGCCCATCTTCTTCC-3′ (reverse); human Bcl-2: 5′-TGGGAAGTTTCAAATCAGC-3′ (forward) and 5′-GCATTCTTGGACGAGGG-3′ (reverse); and human ERK2: 5′-CCTAAGGAAAAGCTCAAAGA-3′ (forward) and 5′-AAAGTGGATAAGCCAAGAC-3′ (reverse). GAPDH was used as an internal control. Primer sequences for GAPDH are as follows: 5′-CAATGACCCCTTCATTGACC-3′ (forward) and 5′-TGGAAGATGGTGATGGGATT-3′ (reverse). Relative expression of Bax, Bcl-2, and ERK2 genes was calculated using the cycle threshold (CT) in relative to the expression of GAPDH by calculating the delta CT value and fold changes in untreated and treated cells. 35 Final data were analyzed using the REST software and Excel method. All experiments were performed in triplicate.
Western blot analysis
AGS cells were seeded and incubated for 24 h and then treated with indicated dose (IC50 values) of calprotectin. Following 24, 48, and 72 h of treatment, the cells were harvested and lysed using radioimmunoprecipitation assay (RIPA)lysis buffer system kit. The protein concentration of each sample was determined using nanodrop spectrophotometer and then Bradford’s method. Equal quantities of protein (50 μg) were loaded on 12% SDS-PAGE and transferred to nitrocellulose membranes. Nonspecific binding membrane sites were blocked by incubation in the blocking buffer (PBS containing 0.1% Tween 20 and 5% nonfat dry milk) for 24 h at 4°C. Subsequently, the membranes were washed twice in washing buffer (PBS containing 0.05% Tween 20) and incubated with primary antibody which diluted in accordance with the catalogs, anti-β actin (1:500 dilution), anti-Bcl-2 (1:200 dilution), anti-Bax (1:200 dilution), anti-ERK2 (1:500 dilution), and anti-phosphorylated ERK2 (1:500 dilution) at 4°C overnight. After that, the membranes were washed twice in washing buffer and incubated with HRP conjugated secondary antibody (1:1000 dilution) for 1 h at room temperature. The proteins were detected using enhanced chemiluminescence detection system (GeneGnome XRQ—Chemiluminescence imaging, Syngene, USA). 36 Intensities of the bands normalized to β-actin band intensity and quantified using the NIH ImageJ software.
Statistical analyses
Experiments were done in triplicates and depicted as the mean ± SD. The IC50 values were calculated using the GraphPad Prism software, version 6.02 (GraphPad Software, San Diego, California, USA). The other data were analyzed by independent sample t-test or the one-way analysis of variance (ANOVA) followed by Tukey’s post hoc test using SPSS 23.0 software (SPSS Inc., Chicago, Illinois, USA). Results were considered statistically significant at a p-value of <0.05(*), <0.01 (**), and <0.001(***).
Results
Effects of calprotectin on AGS cell viability
We employed a human gastric adenocarcinoma cell line (AGS) to assess the anticancer activity of calprotectin. The result of MTT assay shows that this protein has an inhibitory effect on the AGS cells proliferation in a time- and dose-dependent manner. However, at concentrations lower than 40 μg/ml, calprotectin has no significant effect on proliferation and viability of AGS cells, but cell proliferation and viability were reduced following the treatment of AGS cells at greater than 40 μg/ml concentration of calprotectin (Figure 2 and Table 1). Using these data, the IC50 values were measured as 85.77, 79.14, and 65.39 μg/ml for 24, 48, and 72 h, respectively (Table 2). The results showed that the cytotoxicity effects of calprotectin on AGS cells were dose- and time-dependent.

The cytotoxicity effect of human calprotectin on AGS cancer cells by MTT assay. Cell viability percentage was measured by MTT assay, using corresponding controls. Stars show the level of significance from three independent samples t-test (*p < 0.05 and **p < 0.01). MTT: 3-(4,5-dimethylthiazol-2-yl)-2,5-diphenyltetrazolium bromide.
Cell viability in AGS cells treated with various concentration of calprotectin (S100A8/S100A9) for 24, 48, and 72 h.a
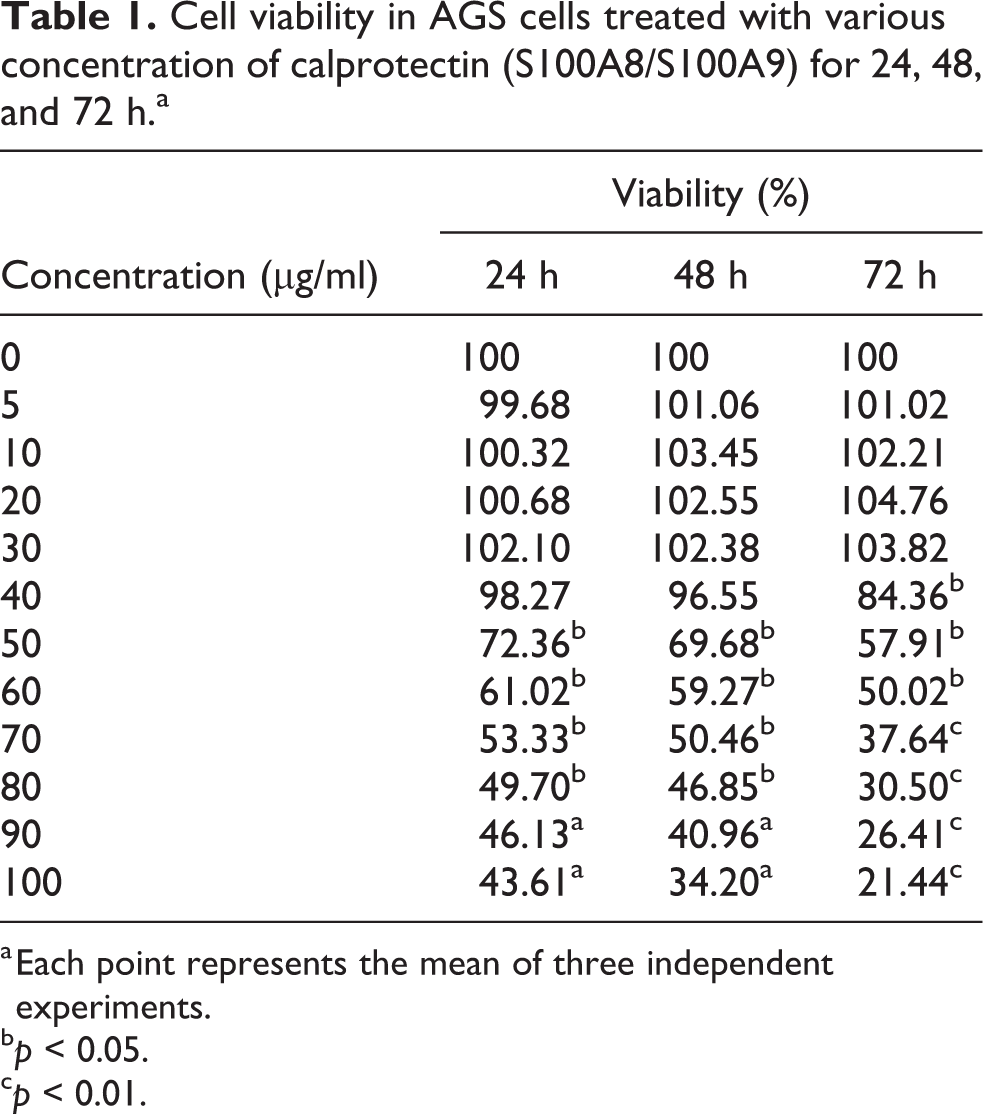
a Each point represents the mean of three independent experiments.
b p < 0.05.
c p < 0.01.
The IC50 values of calprotectin (S100A8/S100A9) after 24, 48, and 72 h of treatment.

IC50: half-maximal inhibitory concentration.
Apoptosis assay by flow cytometry
The surface expression assay of phosphatidylserine by Annexin V/PI technique was studied via flow cytometry analysis. Alive cells are Annexin V-FITC (−)/PI (−) (Q4), early apoptotic cells are Annexin V-FITC (+)/PI (−) (Q3), late apoptotic cells are Annexin V-FITC (+)/PI (+) cell population (Q2), and the necrotic cells or cellular debris has been described as the Annexin V-FITC (−)/PI (+) (Q1). Our findings showed that the cytotoxicity effect of calprotectin on human gastric AGS cell line occurs through apoptosis (Figure 3). As shown in Figure 3(a), after 72 h, a shift occurred from the early apoptosis to late apoptosis. Treatment of the cells with the calprotectin for 24, 48, and 72 h induced apoptosis (early and late apoptotic cells) in about 27.9%, 34.2%, and 43.6%, respectively (Figure 3(b)).

Double staining (Annexin V/PI) flow cytometric assay of the AGS cells treated with indicated concentrations (IC50 values) of calprotectin (S100A8/S100A9) for 24, 48, and 72 h. (a) Results showed a shift from low left quadrant panel (untreated cells) to low right (early apoptosis) and up right quadrant panel (late apoptosis). (b) Quantified apoptosis percentages (early apoptosis + late apoptosis) in cancer cells treated with calprotectin. The data are indicated as the mean ± SD of three independent experiments and were analyzed using FlowJo software (*p < 0.05). PI: propidium iodide; IC50: half-maximal inhibitory concentration.
Cell cycle assay by flow cytometry
Cell distribution in different cell cycle phases was analyzed via flow cytometry. The percentage of cell populations in sub-G1, G1, S, G2, and super-G2 phases in the control AGS cells was 11.25%, 45.97%, 36.83%, 7.82%, and 0.11%, respectively. After 24- to 72-h exposure of cells to calprotectin S100A8/S100A9 (at IC50 value), the percentage of cell population at sub-G1, G1, S, G2, and super-G2 phases was reported. The results showed a significant increase in the sub-G1 fraction (the sign of apoptosis) after treatment with S100A8/S100A9 which includes 18.09%, 42.84%, and 62.84% at 24, 48, and 72 h, respectively, as compared to 11.25% in the control cells. The cells treated with calprotectinshowed an increase in G1 population (51%) in comparison with the control cells (45%) after 24 h, while causing a concomitant decrease in the proportion of cells in G2 phasemaximally resulted in 1.8-fold promotion (Figure 4(a)). These findings suggested that calprotectin induced G1-phase cell cycle arrest at 24-h treatment and then induced apoptin AGS cells was shown at 72 hosis cell death at 48 and 72 h. Collectively, these data show that calprotectin suppresses cell proliferation of AGS cells and arrest them at G1-phase at short incubation time and triggers apoptosis at long incubation time (Figure 4(a) and (b)).

Effects of calprotectin on cell cycle of AGS cells. The cells were treated with IC50 concentration (65 μg/ml) and harvested every 24 h (a). Quantified of the different part of cell cycle (sub-G1, G1, S, G2, and super-G2 phases) in AGS cells treated with calprotectin (b). All data are indicated as mean ± SD (n = 3) and were analyzed using FlowJo software. Treated and untreated groups were compared by ANOVA (Tukey’s post hoc test) (*p < 0.05). IC50: half-maximal inhibitory concentration; ANOVA: analysis of variance.
Morphological evaluation of the treated cells
The AGS cells treated with different concentrations of calprotectin (0, 25, 50, 75, 100, and 125 μg/ml) for 48 h, and the morphological change was evaluated under an inverted microscope at high magnification (200×). Control cells were identified on a homogenous population of cells characterized by the small size and higher nuclear-to-cytoplasmic ratio. Treated cells in 25 and 50 μg/ml of calprotectin showed a cytoplasmic protrusion and lower nuclear-to-cytoplasmic ratio than other treated cells (Figure 5). These data showed that low concentration of calprotectin induced morphological changes in AGS cells while at higher concentration, these changes were stopped, and cells became smaller and spherical. Therefore, it is likely that the concentration of calprotectin is a determining factor in the occurrence of cellular processes such as differentiation and apoptosis. It may induce differentiation in low concentration and induce apoptosis in high concentration.
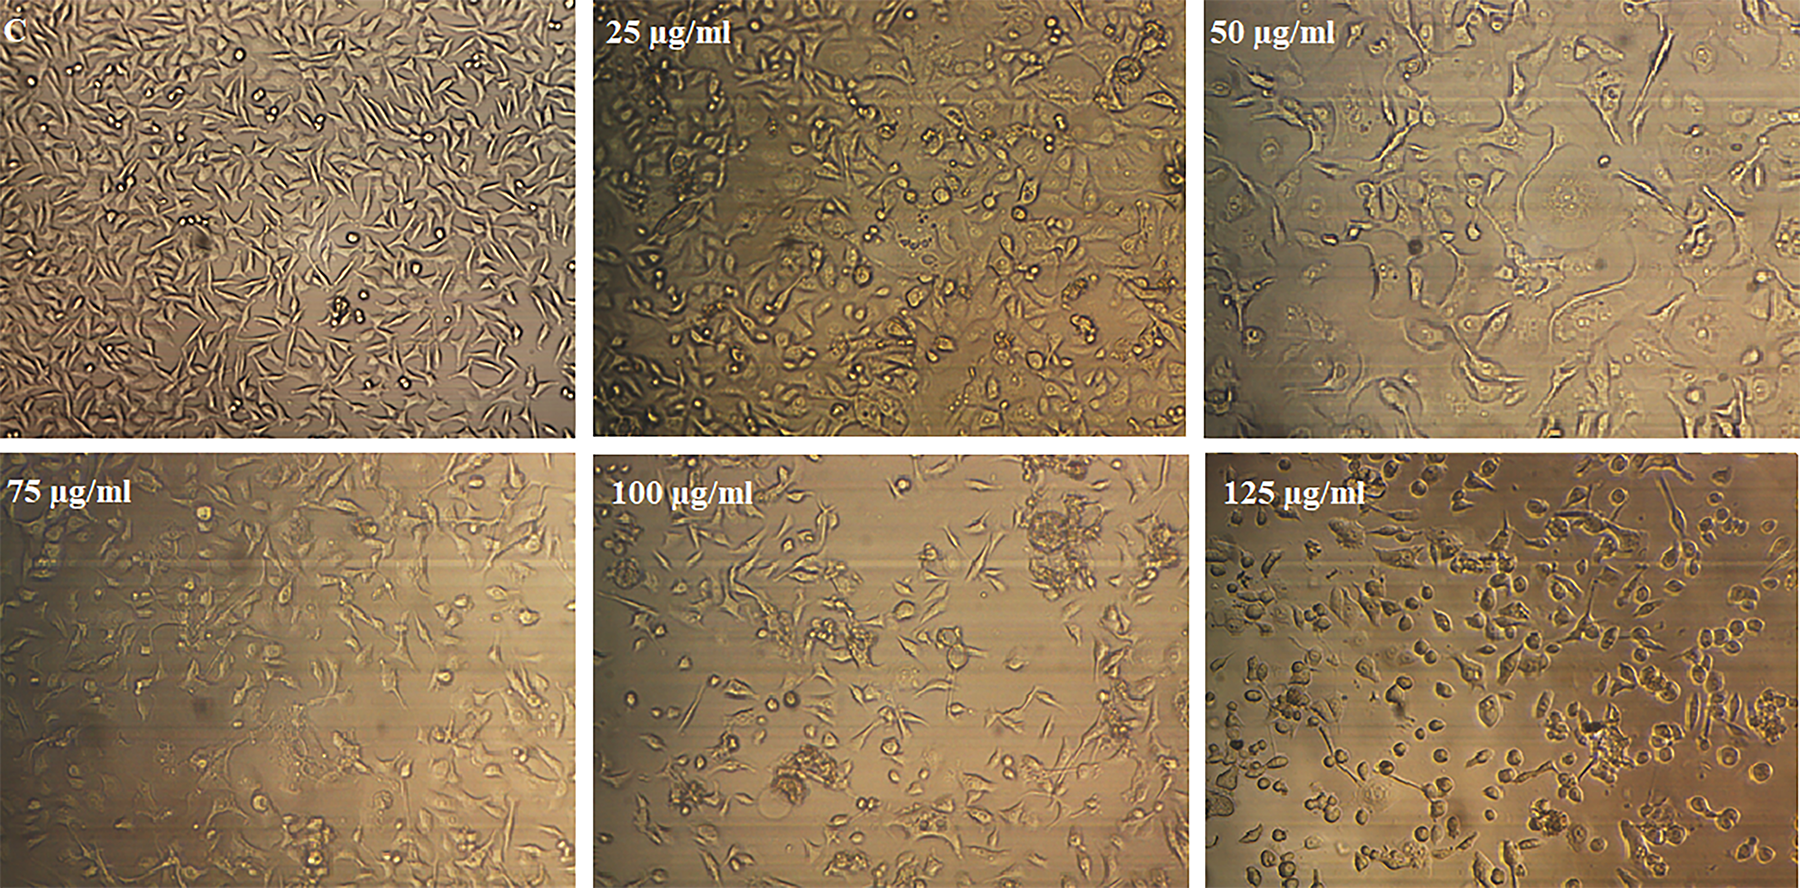
Morphological changes of AGS cells treated with different concentrations of calprotectin for 48 h. An inverted microscope took photomicrographs of the cells (magnification: ×200).
Calprotectin treatment alters the expression levels of Bax, Bcl-2, and ERK2
Regarding the apoptosis-inducing effects of calprotectin on AGS cells, we decided to examine possible alterations in Bcl-2, Bax, and ERK2 genes expression levels. Herein, AGS cells were treated with different concentrations of calprotectin (0, 25, 50, 75, 100, and 125 μg/ml) for 24, 48, and 72 h. According to melting curves, temperature melting values (T m) of Bax (B), Bcl-2 (C), ERK2 (D), and GAPDH (A) genes were 85.2°C, 77.8°C, 84.9°C, and 82.2°C, respectively (for more details, refer Supplemental Material). After calculating the fold change and standardization, the expression ratio of Bax, Bcl-2, and ERK2 genes are illustrated in Figure 6. Our findings indicated that the expression levels of Bax (proapoptotic gene) were increased significantly (Figure 6(A)) in cells treated with rhS100A8/S100A9 while the expression levels of Bcl-2 (antiapoptotic gene) were gradually decreased relative to the control (untreated) in a time- and concentration-dependent manner (Figure 6(B)). Calprotectin treatment (at less than IC50 value, 50 µg/ml) caused a slightly time-dependent increase in the ratio of Bax/Bcl-2 genes from 24 h to 48 h, which maximally resulted in 1.8-fold promotion after 72 h of incubation (Figure 6(C)). At higher concentration (125 µg/ml), a sustained overexpression of Bax/Bcl-2 genes to a 3.4-fold (p < 0.01) in AGS cells was shown at 72 h (Figure 6(C)).These results highlighted that calprotectin induced apoptosis in AGS cell line via the activation of the mitochondrial pathway. The expression of ERK2 was increased gradually in the cells treated with S100A8/S100A9 until 75 µg/ml, whereas no significant change was observed in higher concentrations (100 and 125 µg/ml) than the untreated (control) cells (Figure 6(D)). This increase was 0.1-, 0.2-, and 0.23-fold for 25, 50, and 75 µg/ml concentrations, respectively, after 72 h of incubation (Figure 6(D)). These findings revealed that calprotectin involved in two important processes of the cellular life span, cell viability and apoptosis cell death, which are regulated by Bcl-2 family and MAPK pathway.

Changes in the Bax (A), Bcl-2 (B) and MAPK1 (ERK2) (D) genes expression levels in AGS cells treated with various concentrations of S100A8/S100A9. Normalized values and change fold were obtained from the REST software. By increasing the S100A8/S100A9 concentration and incubation time, Bax gene expression was increased while Bcl-2 gene expression was decreased. The results showed a time- and dose-dependent patterns of gene expression in the cells exposed to calprotectin. Bax/Bcl2 protein expression ratio as an apoptotic index (C). (*p < 0.05 and **p < 0.01). MAPK1: mitogen-activated protein kinase 1; ERK2: extracellular signal-regulated protein kinase 2.
Evaluation of Bcl-2, Bax, ERK, and phospho-ERK proteins levels
The protein levels of Bax, Bcl-2, ERK, and its activated form, phospho-ERK, before and after treatment with calprotectin at IC50 value (65 µg/ml) were examined in AGS cell line using Western blot analysis. We observed that the level of proapoptotic protein Bax was increased in a time-dependent manner, while the expression of antiapoptotic protein Bcl-2 was reduced dramatically after 24–72 h of treatment (Figure 7(a) and (b)). Interestingly, our findings showed that calprotectin caused a gradually time-dependent increase in the ratio of Bax/Bcl-2 proteins from 24 h to 72 h. This increase was 4.1-fold after 72 h of incubation (Figure 7(c)). In addition, calprotectin inhibited ERK phosphorylation in AGS cells. The ERK pathway plays an important role in tumor development. The inhibition of ERK pathway has been demonstrated to inhibit cell proliferation and induce apoptosis in tumor cells. 37 To gain further insight into the association between calprotectin and apoptosis in AGS cells, the ERK and phospho-ERK protein levels were investigated. As shown in Figure 7(a), the levels of phospho-ERK was dramatically diminished following treatment with 65 µg/ml (IC50 value) of calprotectin for 24–72 h, indicating that inactivation of the ERK pathway may be involved in AGS cells apoptosis. The reduction was statistically significant (p < 0.005), as quantified by the NIH ImageJ software (Figure 7(d)).
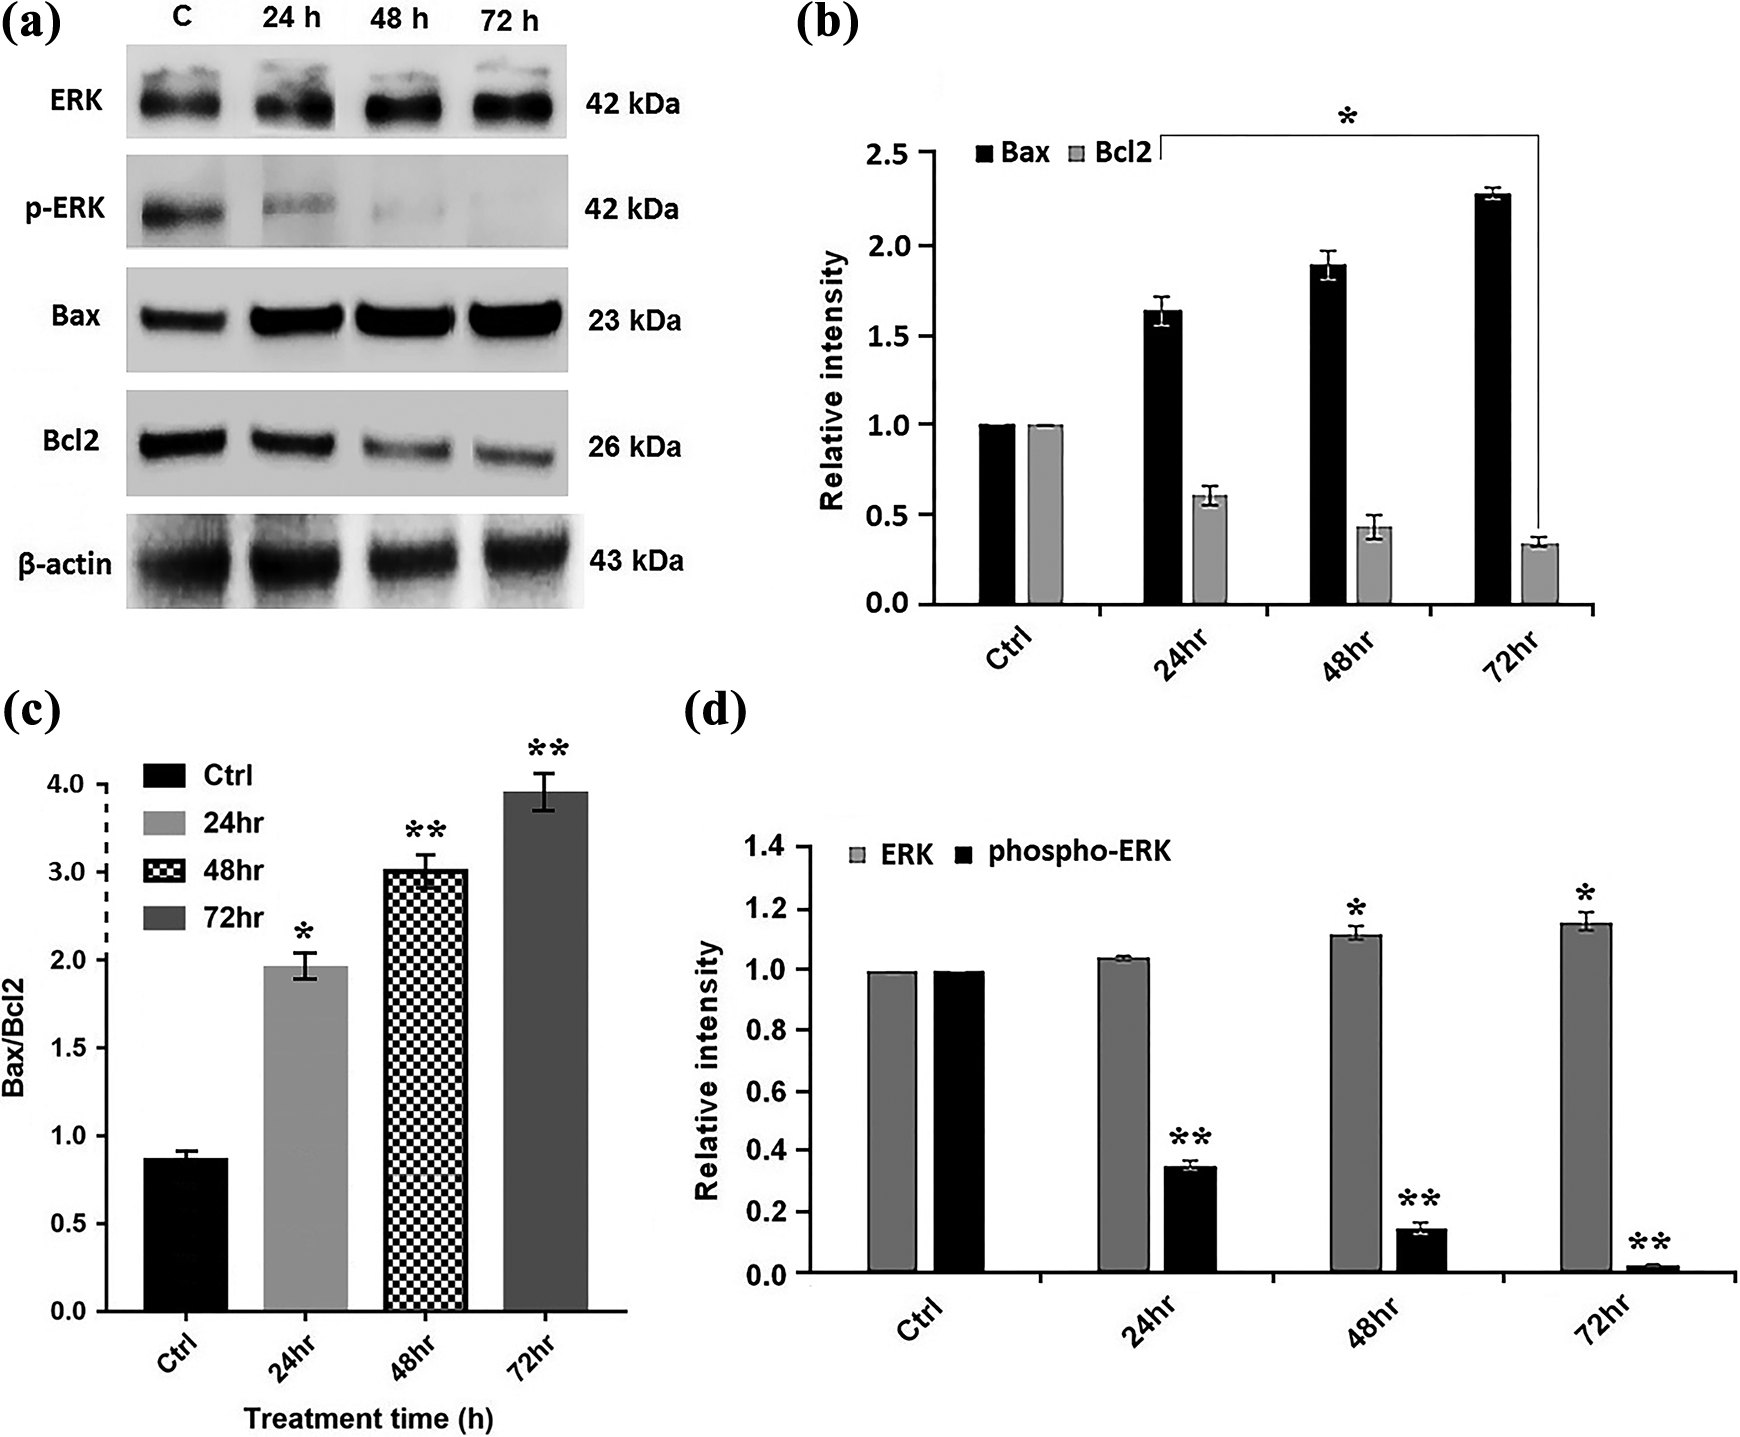
(a) Expression level of ERK, phosphor-ERK, Bax, and Bcl-2 proteins in the AGS cells. The treated cells with indicated concentrations (IC50 values) of S100A8/S100A9 in 24, 48, and 72 h were harvested and subjected to Western blot analysis. (b and c) The ERK, phosphor-ERK, Bax, and Bcl-2 protein levels in untreated and treated cells were quantified by ImageJ software and normalized to β-actin band intensity. (d) Bax/Bcl-2 protein expression ratio as an apoptotic index. (*p < 0.05 and **p < 0.01). ERK: extracellular signal-regulated protein kinase.
Discussion
In this study, we observed that calprotectin (S100A8/S100A9) is an apoptosis-inducing agent. This protein had no significant antiproliferative effects on the AGS cell lines at low concentration (less than 40 μg/ml), while it exhibited significant cytotoxicity and apoptotic effects at higher concentration (≥40 μg/ml) on AGS cell line (Figure 2). Recent studies have shown that the indicated concentration of S100A8/S100A9 regulates the induction of apoptosis. For example, a high concentration (10 µg/ml) of S100A8/S100A9 induces apoptosis in normal human keratinocytes but exerts cell growth at a low concentration (10 ng/ml). 38 These findings are consistent with our results in inducing apoptosis by high concentrations of calprotectin. Moreover, at low concentrations, S100A8/S100A9 promotes tumor cell growth through receptor for advanced glycation end products (RAGE) signaling and MAP kinase-dependent pathways as well as activation of NF-κB, whereas at higher concentrations, it does not enhance cell proliferation. 8 As mentioned, the IC50 value was measured as 79.14 μg/ml after 48 h of treatment that is in the range of results from previous studies. In addition, the IC50 values have been calculated as 45, 85, 110, 35, and 38 μg/ml for MDA-MB231, SHEP, KELLY, BJAB, and HFFF cancer cell lines, respectively, after 48 h of treatment. 16,39 Apoptosis is known as an efficient strategy for control of cancer since the cancer cells have various mechanisms to resistance apoptotic cell death. 40 To validate whether S100A8/S100A9 exerted its antiproliferative effects on AGS cells, we analyzed the effect of this protein on the cell cycle progression. Our findings revealed that antiproliferative effects of calprotectin were a consequence of apoptosis induction concomitant with the G1 cell cycle arrest (Figures 3 and 4). It is assumed that switching from cell cycle arrest to apoptosis is correlated with increased levels of apoptotic genes and proteins. 41 –43 Considering our findings from real-time PCR technique and Western blot analysis, a significant increase in Bax/Bcl-2 genes as well as proteins expression ratio was observed. These data suggest that induction of apoptosis by calprotectin is achieved by downregulation of Bcl-2 and upregulation of Bax (Figures 6 and 7). Decreased Bcl-2 protein expression follows to diminish its inhibitory effect on Bax protein. Due to the quantified data from Western blot analysis, an altered ratio of Bax/Bcl-2 was observed, which can trigger the intrinsic or mitochondrial pathway of apoptosis (Figure 7(c)). Free Bax can join to Bak at the outer membrane of mitochondrial, collapse the mitochondrial membrane potential, and consequently, trigger the cell apoptosis. Tumor progression is a complex multistep process controlled by numerous factors in the transformation of cells into their malignant phenotype. Increased levels of Bcl-2 expression in cancer cells prevent apoptosis and lead to tumor progression, while a decrease in Bcl-2 and an increase in Bax expression induce cell death and eliminate tumor cells. 44,45 Since the Bcl-2 family has a key role in the mitochondria membrane potential and mitochondrial depolarization, we can conclude that the mitochondrial fission has arisen in S100A8/S100A9-treated cells. It has been recently reported that S100A8/S100A9-induced cell death is related to BCL2 Interacting Protein 3 (BNIP3) (atypical proapoptotic Bcl-2-family member) protein. A mutant of BNIP3 (ΔTM-BNIP3), lacking the transmembrane domain, blocked S100A8/S100A9-induced cell death. BNIP3 is a proapoptotic Bcl-2 family member that has a single BH3 domain. 46 It directly interacts with Bcl-2 and Bcl-XL, suggesting that BNIP3 could activate Bax and Bak through sequestering Bcl-2 and Bax from each other. 25 Investigations have shown that S100A8/S100A9 can cause to decrease in Drp1 expression and increases reactive oxygen species (ROS) production, resulting in the depolarization or rapid loss of mitochondrial membrane potential (ΔΨ m) and subsequent inhibition of BNIP3 and activation of Bak. 47 After the translocation of Bak and BNIP3 in mitochondria, cytochrome C, Smac/DIABLO, and Omi/HtrA2 are concomitantly released from mitochondria into the cytoplasm. They activate caspase-3 in a direct way or in an inhibitor of apoptosis proteins (IAPs)-dependent manner to induce apoptosis. 16 It has also been reported that calprotectin inhibits the activity of casein kinase I and II (CKI and II), which is involved in the phosphorylation of several enzymes including topoisomerase I and II. 48,49 Since the inhibitors of topoisomerase activity stimulate cell death in various cells, 50,51 it is possible that inducing apoptosis by calprotectin is regulated somehow by inhibition of topoisomerase activity in cancer cells. It has been investigated that Fas-induced apoptosis is triggered through the cleavage of Bid (a member of the Bcl-2 family) at Asp 59 by caspase-8, the main caspase in the intrinsic pathway of apoptosis. The phosphorylation of Bid by CKs decreased its sensitivity to caspase-8 and prevented the caspase-8 dependent cleavage of Bid; therefore, cells were protected from Fas-induced apoptosis. 52 Inhibition of CKs by calprotectin can accelerate cleavage of Bid which leads to the beginning of the extrinsic apoptotic pathway. Previous studies showed that calprotectin interacts with the main components of the cytoskeleton in a calcium-dependent manner. Specific binding of S100A8/S100A9 protein to microtubules, vimentin, keratin, and actin filaments has already been reported. 53,54 So, it is possible that the interaction of S100A8/S100A9 with cytoskeleton causes a relevant functional correlation. In this case, the concentration of calcium plays an important role. The binding of Ca2+ to the calprotectin modulates S100A8 and S100A9 subunits to form a noncovalent heterodimer protein complex. In the presence of calcium, the S100A8 and S100A9 subunits show a strong preference for the formation of the noncovalent heterodimer protein complex. 55,56 At high concentrations of calcium, the (S100A8/S100A9)2 heterotetramer is specifically formed. 13 Moreover, threonine phosphorylation of S100A9 by p38 MAPK pathway can lead to further modification, which inhibits S100A8/S100A9-dependent tubulin polymerization. 57 Thus, S100A8/S100A9 can play as an inducer or inhibitor in the tubulin polymerization. It has previously reported that microtubule inhibitors can be used as apoptosis-inducing agents, and the mechanism of these agents is related to phosphorylation of Bcl-2, which cause protein degradation and stimulation of apoptosis. 58
As explained, phosphorylation of calprotectin by p38 MAPK and its modification can lead to inhibition of tubulin polymerization, cell cycle arrest, and induction of apoptosis. The MAPK pathways have important roles in cell growth, proliferation, survival, differentiation, and apoptosis. 17 Herein, we also investigated the level changes of ERK and phosphorylated form of ERK, which belongs to the MAPKs superfamily. Considering our findings from real-time PCR technique, we observed a slight increase in ERK gene expression until 75 μg/ml concentration of treatment, whereas this upregulating was stopped at high considerations (≥100 μg/ml) (Figure 6(d)). Moreover, according to the Western blot findings, at IC50 concentration (65 μg/ml) of treatment, the levels of ERK increased slightly in all three times (24, 48, and 72 h) confirming ERK gene expression, while the level of phospho-ERK was dramatically reduced in a time-dependent manner. These results indicated that inactivation of the ERK pathway might be involved in AGS cells apoptosis. Since p38 MAPK activation was accompanied by ERK inactivation, 59 it can suppress ERK phosphorylation and induce apoptosis. It has also been shown that S100A8/S100A9 treatment increases migration and invasion at low concentrations through p38 MAPK-dependent NF-κB activation leading to an increase in the expression of MMP2 and MMP12 in GC cells. 60 Furthermore, an increase in intracellular calcium (Ca2+) concentration leads to ERK phosphorylation and consequently the cAMP-response element binding (CREB) protein phosphorylation, which as a nuclear transcriptionfactor, increasing intracellular Bcl-2 protein. 61 Increased levels of intracellular Ca2+ activate ROS-generating enzymes which lead to the formation of the low level of free radicals resulting in proliferation and growth of tumor cells. In contrast, exposure to long-term calcium leads to more production of ROS in cells, which resulted in the cell death. 62 Our results support the previous studies, in which the low concentration of calprotectin produced a low level of ROS-dependent Ca2+ concentration and led to tumor cell growth and proliferation. Whereas, high concentration of calprotectin led to ROS-induced apoptosis via downregulation of Bcl-2 and upregulation of Bax, as well as inactivation of the ERK pathway. Despite these findings, more research is required to evaluate the role of calprotectin in the Bcl-2 and ERK expression pathways.
In conclusion, this study showed that low concentrations of calprotectin (S100A8/S100A9) did not induce AGS cell death, whereas at higher concentrations, this protein inhibited cells viability and induced apoptosis cell death by triggering intrinsic pathway through regulating of Bcl-2 family and ERK signaling pathway. Altered ratio of proapoptotic and antiapoptotic Bcl-2 family members, as well as ERK, might be an important key role to understand the sensitizing effect of calprotectin on AGS cancer cells. Lack of prior research studies on the molecular mechanism of apoptosis-inducing activity of S100A8/S100A9 was the limitation of our study and it needs to be fully elucidated by more investigation. Calprotectin is an important biological marker and a good crosstalk factor between cancer and inflammation. Therefore, the protein design aims to identify new protein sequences of desirable structure and biological function in apoptosis inducing, not inflammation stimulating, can be considered in the future.
Supplemental material
Supplemental Material, Fig_Supplementary - Calprotectin (S100A8/S100A9)-induced cytotoxicity and apoptosis in human gastric cancer AGS cells: Alteration in expression levels of Bax, Bcl-2, and ERK2
Supplemental Material, Fig_Supplementary for Calprotectin (S100A8/S100A9)-induced cytotoxicity and apoptosis in human gastric cancer AGS cells: Alteration in expression levels of Bax, Bcl-2, and ERK2 by F Shabani, M Mahdavi, M Imani, MA Hosseinpour-Feizi and N Gheibi in Human & Experimental Toxicology
Footnotes
Acknowledgments
The authors appreciate the support of this investigation by the Cellular and Molecular Research Center, Qazvin University of Medical Sciences, Qazvin, Iran and research council of University of Tabriz, Tabriz, Iran. We would like to thank Dr. Hossein Ahmadpour for helping us in protein extraction and also Prof. Hassan Ebrahimzadeh and Elite Foundation of Gilan for Investigator Award and financial support, respectively.
Author contributions
All authors contributed equally to this work.
Declaration of conflicting interests
The author(s) declared no potential conflicts of interest with respect to the research, authorship, and/or publication of this article.
Funding
The author(s) received no financial support for the research, authorship, and/or publication of this article.
Supplemental material
Supplemental material for this article is available online
References
Supplementary Material
Please find the following supplemental material available below.
For Open Access articles published under a Creative Commons License, all supplemental material carries the same license as the article it is associated with.
For non-Open Access articles published, all supplemental material carries a non-exclusive license, and permission requests for re-use of supplemental material or any part of supplemental material shall be sent directly to the copyright owner as specified in the copyright notice associated with the article.