
Abstract
This study aimed to analyse the protective effects of quercetin on the toxicity of cadmium (Cd) using metabonomics techniques. Sixty male Sprague–Dawley rats were randomly divided into six groups (n = 10): control group (C), low-dose quercetin-treated group (Q1; 10 mg/kg bw/day), high-dose quercetin-treated group (Q2; 50 mg/kg bw/day), Cd-treated group (D; 4.89 mg/kg bw/day), low-dose quercetin plus Cd-treated group (DQ1) and high-dose quercetin plus Cd-treated group (DQ2). The rats continuously received quercetin and Cd via gavage and drinking water for 12 weeks, respectively. The rat urine samples were collected for metabonomics analysis. Finally, 10 metabolites were identified via the metabonomics profiles of the rat urine samples. Compared with the control group, the intensities of taurine, phosphocreatine,
Introduction
Cadmium (Cd) is widely used in metal smelting, storage batteries, aerospace materials and other areas. The discharge of wastewater and gas from Cd can cause water, atmosphere and soil pollution. Cd can enter and accumulate in plants and animals through polluted environment and eventually arrive in the human body following the food chain. 1 With chronic exposure, Cd could cause damage to the kidney, liver, bones, nervous system and so on, resulting in life expectancy reduction. 2 Oxidative stress and reactive oxygen species induced by Cd may possibly be the reasons for various organ damage. 3 Cd has a long biological half-life and easily accumulates in the body. Therefore, reducing Cd-induced toxicity on the body has attracted the attention of people.
Quercetin, a flavonoid, is widely found in vegetables and fruits. Studies have shown that quercetin has anti-oxidation, anti-inflammatory, anti-cancer, antiaggregatory and immunomodulatory effects. 4 Epidemiological studies have suggested that quercetin may reduce the risk of hypercholesterolemia, atherosclerosis and other chronic diseases. 5,6 Some studies have also indicated that quercetin can alleviate Cd-induced kidney, testicular and nerve damage via inhibition of oxidative stress. 7 –9 However, current investigations concentrated on a single organ or tissue rather than at the metabolic level of the body. A new approach is necessary to research the positive effects of quercetin on Cd-induced toxicity.
Metabonomics is defined as ‘the quantitative measurement of the dynamic multi-parametric metabolic response of living systems to pathophysiological stimuli or genetic modification’. 10 Based on the metabolites identified in biological samples (e.g. urine, blood, tissues, etc.), metabonomics is able to provide a global view of the changes of specific small-molecule metabolites in biological systems in response to physiological or pathological state of the cell, tissue, organ or organism. 11 At the same time, metabonomics contributes to the broader field of systems biology (e.g. incorporation of genomics, proteomics, bioinformatics, etc.) by obtaining the comprehensive view of small molecules that may explain perturbations due to disease states or other phenomena. 12 Therefore, metabonomics has been widely employed in many fields, such as food safety, drug development and toxicology research.
In previous study, Chen et al. 13 analysed the toxic effect of chronic low-dose exposure to Cd on rat urine by using ultra-performance liquid chromatography–mass spectrometry (UPLC-MS). The results showed that Cd can disrupt energy metabolism, lipid metabolism and antioxidant defence system. Cd can also induce oxidative stress, and quercetin has antioxidant activity. Therefore, quercetin is speculated to affect Cd-induced toxicity in the metabolic level of the body. Based on this speculation, the aim of the present study is to systematically study the effects and mechanisms of quercetin against the toxicity of chronic low-dose exposure of Cd in rat urine by metabonomics techniques.
Materials and methods
Chemicals
Cadmium chloride (CdCl2; 99.99% purity) and quercetin (98% purity) were obtained from Sigma-Aldrich (Bangalore, India). High performance liquid chromatography (HPLC) grade methanol and acetonitrile were purchased from Dikma Science and Technology Co. Ltd (Canada). HPLC grade formic acid was supplied by Beijing Reagent Company (Beijing, China). The assay kits for superoxide dismutase (SOD), L-glutathione (GSH), catalase (CAT), malondialdehyde (MDA), uric acid (UA), N-acetyl-β-
Animal treatment and experimental design
The doses of quercetin-treated groups were designed as follows: the low dose (10 mg/kg bw/day) and high dose (50 mg/kg bw/day), which was according to the minimum (5.96 mg/day) and maximum quercetin intake (29.4 mg/day) in some countries. 14,15 The dose of CdCl2 (4.89 mg/kg bw/day) was determined according to previously published study, 13 which exerted significant toxic effects on the rats. Animals were cared for in accordance with the Guide for the Care and Use of Laboratory Animals. All animal experimental procedures were approved by the Institute of Zoology and Medical Ethics Committee of Harbin Medical University.
Sixty male Sprague–Dawley rats (180 ± 20 g) were purchased from Vital Laboratory Animal Technology Co. Ltd (Beijing, China). Rats were housed individually in metabolic cages and given AIN-93M rodent diets and drinking water ad libitum. Rats were maintained in a controlled condition of temperature (22 ± 2°C) and relative humidity (50–60%) with a 12-h light/12-h dark cycle.
After acclimatization, rats were randomly divided into six groups (n = 10): control group (C), low-dose quercetin-treated group (Q1), high-dose quercetin-treated group (Q2), Cd-treated group (D), low-dose quercetin plus Cd-treated group (DQ1) and high-dose quercetin plus Cd-treated group (DQ2). Quercetin was dissolved in 0.5% carboxymethyl cellulose (CMC) and was administered by gavage once per day. The same procedure was used for treating the rats of groups C and D with 0.5% CMC. Cd was dissolved in distilled water and was administered by drinking water. The rats of groups C, Q1 and Q2 were given unmodified distilled water. Body weight of each rat was measured once a week and water consumption of each rat was recorded every day. The experiment lasts for 12 weeks, and no significant difference was found on water consumption of rats in all experimental groups compared with that in the control group (p > 0.05; Online Supplementary Table S1).
Sample collection
Urine samples were collected in the metabolic cages with ice packs for 24 h at two different time points (24 h pre-dose and 12 weeks post-dose). Urine samples were centrifuged at 3000 r/min (996 g) for 15 min, and the supernatants were stored at −80°C. After collected the last urine samples, the rats were fasted for 12 h. Then, the rats were anaesthetised with chloral hydrate by intraperitoneal injection. The kidneys and livers were collected and stored at −80°C for further analysis.
Detection of biochemical parameters in urine, kidney and liver
The Cr, β2-MG, RBP and UA levels and NAG activity in urine were detected using kits according to manufacturer’s instructions. The antioxidant enzyme activities of SOD and CAT and the levels of GSH and MDA in the kidney were detected using kits according to manufacturer’s instructions. The content of α-TTP in the liver was detected using the ELISA assay kit according to manufacturer’s instructions.
Sample preparation for metabonomics analysis
Urine samples were thawed at 4°C and centrifuged at 12,000 r/min (13,201 × g) for 10 min. A 150 μL volume of the supernatant was added to 450 μL of distilled water in a vial, and 10 μL of each sample was combined to generate a pooled quality control (QC) sample. The QC sample was injected after every 10 samples to monitor instrument stability.
Chromatography
Chromatographic separation was performed on Waters ACQUITY UPLC system (Waters Corporation, Milford, Massachusetts, USA) equipped with an HSS T3 column (100 × 2.1 mm, 1.8 μm i.d.; Waters Corporation). The temperature of the autosampler and column was kept at 4°C and 35°C, respectively. A 2 μL aliquot of each sample solution was injected onto the column, and the flow rate was 0.45 mL/min. The mobile phase system of 0.1% aqueous formic acid solution (mobile phase A) and acetonitrile (mobile phase B) was used. A gradient elution system was employed as follows: 0–2% B for 0–0.5 min, 2–5% B for 0.5–1 min, 5–12% B for 1–2 min, 12–20% B for 2–5 min, 20–32% B for 5–6.5 min, 32–45% B for 6.5–8.5 min, 45–65% B for 8.5–10 min, 65–98% B for 10–11 min, 98% B for 11–12 min, 98–30% B for 12–13 min, 30–2% B for 13–14 min and 2% B for 14–16 min in the positive and negative ion mode.
Mass spectrometry
Mass spectrometry was performed using a Xevo G2 Q-TOF mass spectrometry (Waters Corporation) with electrospray ionization in positive and negative modes and in full scan mode from m/z 50–1000 for 0–16 min. The analytical parameters were as follows: cone gas (nitrogen) and desolvation gas (nitrogen) were 50 and 900 L/h, respectively; source temperature and desolvation temperature were 120°C and 450°C, respectively; and capillary voltage was 0.5 KV and cone voltage was 30 V. The mass accuracy and reproducibility were maintained by infusing lock mass (leucine–enkephalin, (M + H)+ = 556.2771 m/z; (M − H)− = 554.2615 m/z) through lock spray at a flow rate of 10 μL/min. The lock spray frequency was set at 10 s in the positive ion mode and 15 s in the negative ion mode.
Data processing and metabolite identification
The UPLC-MS data were processed using Progenesis QI software (version 2.1; Waters Corporation). The metabolites were filtered on the basis of the one-way analysis of variance (ANOVA) p value < 0.05 and maximum fold change > 2. After that, the selected metabolites were exported into EZinfo statistical analysis software (version 2.0; Umetrics AB, Umea, Sweden). Prior to multivariate statistical analysis, the data were mean-cantered and Pareto-scaled. Principal component analysis (PCA) was first used for all samples to visualize the general separation and determine the reproducibility and quality. Subsequently, the partial least-squares discriminant analysis (PLS-DA) model was built. Moreover, to avoid over-fitting of PLS-DA models, a default seven-fold cross-validation and testing with 200 random permutations were performed using SIMCA-P software (version 12.0; Umetrics AB). The metabolites were selected on the basis of the variable importance in projection (VIP) threshold (VIP > 1).
The selected metabolites were imported into Progenesis QI software for metabolite identification. The Human Metabolome Database (HMDB; http://www.hmdb.ca/; the mass tolerance was set at 10 ppm or 5 mDa) was applied to identify initial metabolites. To reduce the false-positive matches, the chromatographic retention behaviour and fragmentation information should be taken into consideration. Eventually, metabolites were confirmed by contrasting the retention time, m/z, and fragmentation pattern with standard substances. The relevant pathways of the identified metabolites were determined using the MetaboAnalyst website (http://www.metaboanalyst.ca/), Kyoto Encyclopedia of Genes and Genomes (KEGG; http://www.genome.jp/kegg) and HMDB databases.
Statistical analysis
Statistical analysis was performed using SPSS (version 17.0; Beijing Stats Date Mining Co. Ltd, China). Differences between the control group and the treatment groups were analysed by ANOVA or non-parametric Kruskal–Wallis test, with a statistical significance set at p < 0.05. Receiver operating characteristic (ROC) curve analysis was performed for each confirmed biomarker to determine the area under the curve (AUC), which is a measure to compare the predictive ability of metabolites.
Results
Body weight
The rat body weights at each time point in groups are shown in Online Supplementary Table S2. At all time points, no significant difference was found on the body weight of rats in all experimental groups compared with that in the control group (p > 0.05).
Biochemical parameters in urine
Several urine biochemical parameters are listed in Table 1. Compared with the group C, the NAG/Cr, RBP and β2-MG levels in urine were significantly increased (p < 0.01) and the UA level was significantly decreased (p < 0.01) in group D. When high-dose quercetin and Cd were administered to rats simultaneously, the NAG/Cr, RBP and β2-MG levels were significantly decreased (p < 0.01) and the UA level was significantly increased (p < 0.01) compared with those in group D. Moreover, a significant difference in the above parameters was found between groups C and DQ2 (p < 0.05). No significant difference in the above parameters was observed among groups C, Q1 and Q2 or between groups D and DQ1 (p > 0.05).
Biochemical parameters in urine.a
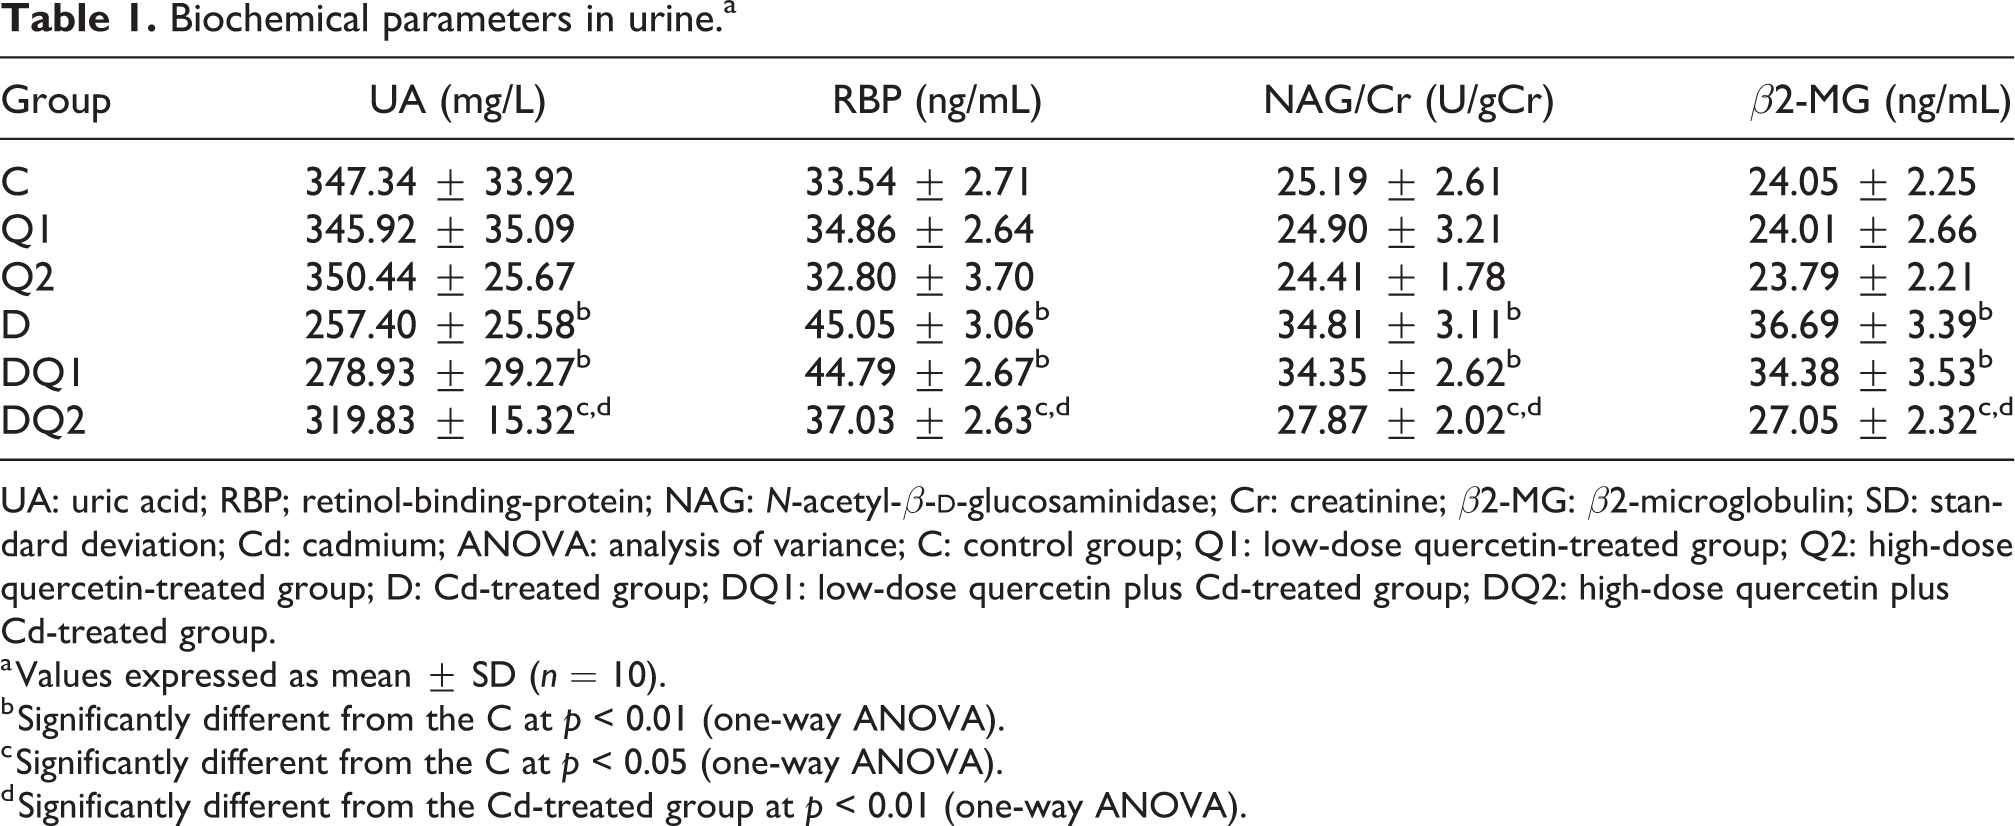
UA: uric acid; RBP; retinol-binding-protein; NAG: N-acetyl-β-
a Values expressed as mean ± SD (n = 10).
b Significantly different from the C at p < 0.01 (one-way ANOVA).
c Significantly different from the C at p < 0.05 (one-way ANOVA).
d Significantly different from the Cd-treated group at p < 0.01 (one-way ANOVA).
Antioxidant activities and MDA levels
The CAT and SOD activities and GSH and MDA levels in the kidneys are detected, as presented in Table 2. The CAT and SOD activities and the GSH level were significantly decreased (p < 0.01) and the MDA level was significantly increased (p < 0.01) in group D than in group C. When high-dose quercetin and Cd were administered to rats simultaneously, the CAT and SOD activities and the GSH level were significantly increased (p < 0.01) and the MDA level was significantly decreased (p < 0.05) compared with those in group D. However, a significant difference in the above parameters was found between groups C and DQ2 (p < 0.05 or p < 0.01). No significant difference in the above parameters was observed among groups C, Q1 and Q2 or between groups D and DQ1 (p > 0.05).
The antioxidant levels and the MDA levels in the kidneys.a

CAT: catalase; GSH: L-glutathione; SOD: superoxide dismutase; MDA: malondialdehyde; SD: standard deviation; Cd: cadmium; ANOVA: analysis of variance; C: control group; Q1: low-dose quercetin-treated group; Q2: high-dose quercetin-treated group; D: Cd-treated group; DQ1: low-dose quercetin plus Cd-treated group; DQ2: high-dose quercetin plus Cd-treated group.
a Values expressed as mean ± SD (n = 10).
b Significantly different from the control group at p < 0.01 (one-way ANOVA).
c Significantly different from the control group at p < 0.05 (one-way ANOVA).
d Significantly different from the Cd-treated group at p < 0.01 (one-way ANOVA).
e Significantly different from the Cd-treated group at p < 0.05 (one-way ANOVA).
α-TTP content in the liver
The α-TTP content in the liver of rat is detected, as shown in Figure 1. The content of α-TTP was significantly decreased (p < 0.01) in group D than in group C. When high-dose quercetin and Cd were administered to rats simultaneously, the α-TTP content was significantly increased (p < 0.05) compared with that in group D. However, a significant difference in the indicator was found between groups C and DQ2 (p < 0.05). No significant difference in the indicator was observed among groups C, Q1 and Q2 or between groups D and DQ1 (p > 0.05).

The content of α-TTP in rat liver. Values expressed as mean ± SD (n = 10). *Significantly different from the C at p < 0.05 (one-way ANOVA). **Significantly different from the C at p < 0.01 (one-way ANOVA). #Significantly different from the Cd-treated group at p < 0.05 (one-way ANOVA). ##Significantly different from the Cd-treated group at p < 0.01 (one-way ANOVA). C: control group; Q1: low-dose quercetin-treated group; Q2: high-dose quercetin-treated group; D: Cd-treated group; DQ1: low-dose quercetin plus Cd-treated group; DQ2: high-dose quercetin plus Cd-treated group; α-TTP: α-tocopherol transfer protein; SD: standard deviation; ANOVA; analysis of variance; Cd: cadmium.
Metabonomics analysis of urine
The urine samples from all groups of rats were analysed by UPLC-MS in the positive and negative modes to obtain comprehensive metabonomics data. The PCA scores of all groups, including the QC samples, are presented in Figure 2. QC samples are closely packed together. The six ions (m/z 167.04, 268.781, 200.0497, 365.05, 470.8879 and 506.1469 in the positive mode) were selected from the chromatographic peaks to verify the reliability of the method. The relative standard deviations of peak intensities, retention times and m/z were 0.02–1.79%, 0.12–0.77% and 0.28–0.79%, respectively, indicating good stability of the overall system. Subsequently, PLS-DA was used to further observe the differences between the groups. The scores of PLS-DA are shown in Figure 2. Groups D, DQ1 and DQ2 were clearly separated from group C. Overlap between groups D and DQ1 can be noted, but groups D and DQ2 were evidently separated. Cross-validation and permutation tests of PLS-DA models were applied to prevent model overfitting and ensure the validity of the model (Online Supplementary Figure S1). In the positive mode, the R2Y and Q2 values are 0.934 and 0.838, respectively. In the negative mode, the values of the two aforementioned parameters are 0.92 and 0.802. The R2 and Q2 values are both lower than the original points on the right, and the former are always larger than the latter. Moreover, the results of cross-validation ANOVA suggest that the PLS-DA models are highly significant (Online Supplementary Tables S3 and S4).

PCA and PLS-DA score plots in the positive and negative mode. (a) PCA score plots in the positive mode. (b) PCA score plots in the negative mode. (c) PLS-DA score plots in the positive mode. (d) PLS-DA score plots in the negative mode. Black dots, Cd-treated group (D); red boxes, low-dose quercetin plus Cd-treated group (DQ1); green triangles, high-dose quercetin plus Cd-treated group (DQ2); blue diamonds, control group (C); orange stars, low-dose quercetin-treated group (Q1); violet crosses, high-dose quercetin-treated group (Q2); green inverted triangles, QC group. N = 10. PCA: principal component analysis; PLS-DA: partial least-squares discriminant analysis; Cd: cadmium; QC: quality control.
Using the aforementioned metabolite identification methods (data processing and metabolite identification), 10 metabolites (8 positive modes and 2 negative modes) were identified. The retention times, measured masses, calculated masses and elemental compositions of the 10 metabolites are shown in Table 3. The intensity of biomarkers in rat urine in positive and negative modes is shown in Online Supplementary Table S5. Fragment and other information of the 10 metabolites are shown in Online Supplementary Tables S6 and S7.
Renal biomarkers identified after treatment in positive and negative mode.

α-CEHC: 2,5,7,8-tetramethyl-2(2′-carboxyethyl)-6-hydroxychroman; DA: dopamine; PCr: phosphocreatine; GSA: guanidinosuccinic acid; UA: uric acid; LPC: lysoPC.
a The metabolite was confirmed by databases.
b The metabolite was identified by reference compound.
Compared with the control group, the intensities of LysoPC (LPC), guanidinosuccinic acid (GSA), dopamine (DA), 2,5,7,8-tetramethyl-2(2′-carboxyethyl)-6-hydroxychroman (α-CEHC) and allantoic acid were significantly increased (p < 0.01 or p < 0.05) in the groups D, DQ1 and DQ2. In group DQ2, the intensities of the five aforementioned metabolites were significantly decreased compared with those in group D (p < 0.01 or p < 0.05). The intensities of taurine, phosphocreatine (PCr),
An ROC plot was constructed to assess the sensitivity and specificity of the metabolites. All AUCs exceeded 0.8 in the 95% confidence interval (Figure 3), showing good predictive power.

Performance of potential biomarkers based on ROC curves. (a) α-CEHC, AUC = 0.910. (b) GSA, AUC = 0.810. (c) LPC, AUC = 0.920. (d) Allantoic acid, AUC = 0.810. (e) Taurine, AUC = 1.000. (f) Phosphocreatine, AUC = 0.870; (g)
Discussion
After the experiment, the urine of rats was detected by UPLC-MS. The PLS-DA score plot displays that groups C and D were significantly separated, groups D and DQ1 overlap and groups D and DQ2 were evidently separated, indicating that Cd can cause toxicity and high-dose quercetin can affect the Cd-induced toxicity. Finally, 10 metabolites were identified (Table 3). Based on information obtained from the MetaboAnalyst website, HMDB and KEGG databases, the biological relationships between the potential biomarkers and toxic effects induced by Cd, and the mechanism by which quercetin affects such toxicity are discussed according to the four pathways, as shown in Figure 4.
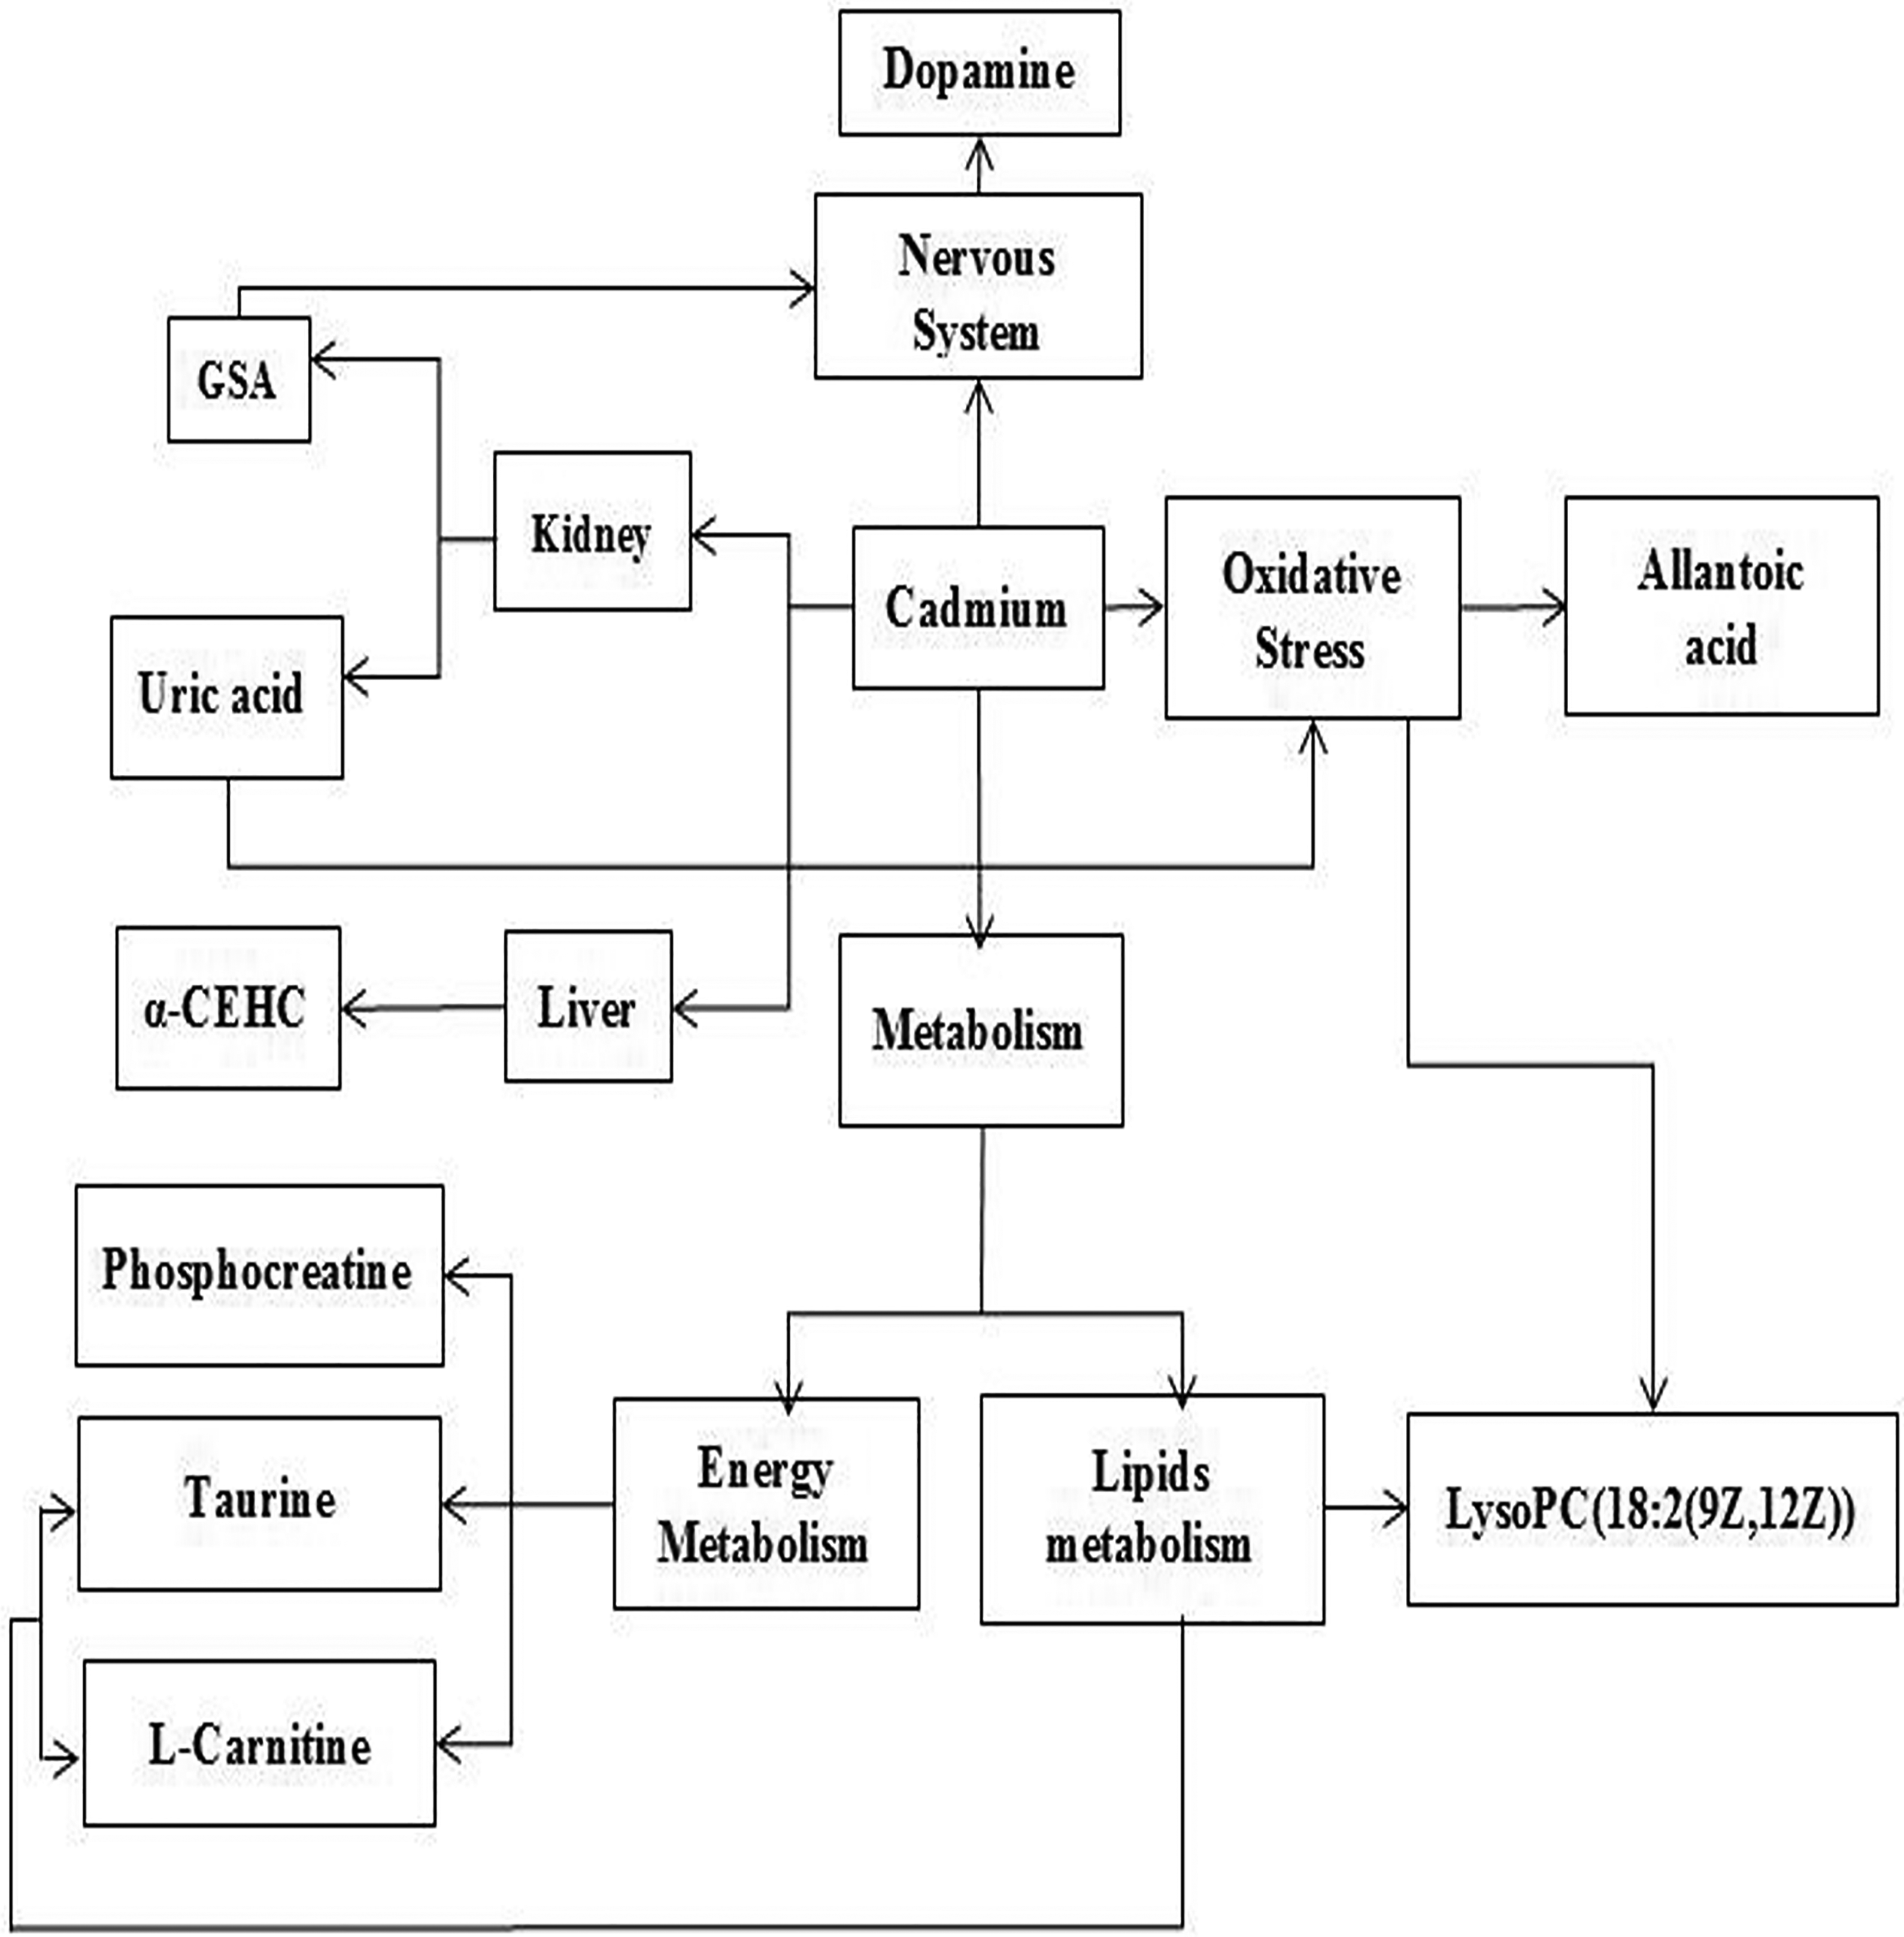
The pathways in response to Cd and/or quercetin treatment. Cd: cadmium.
The first pathway is linked to the metabolism of energy and lipids (Figure 4). Taurine is a non-proteinogenic β-sulphamic acid, which inhibits fatty acid-induced lipid accumulation and maintains normal lipids. 16 –20 Taurine deficiency increases the NADH/NAD ratio and affects energy metabolism. 21,22 PCr, a fast and high-energy phosphate molecule, is essential for intracellular energy transfer systems. 23 When the ATP in the body is lacking, PCr will be decomposed into the ATP. In the current study, the intensities of taurine and PCr in group D were significantly decreased compared with those in group C, indicating that Cd exposure affects lipid and energy metabolism. This finding may be related to the effect of Cd on the oxidation rate of NADH and its destruction of the tricarboxylic acid cycle. 24 Quercetin was reported to increase the cytosolic NAD+/NADH redox potential and the oxidation of NADH. 25 When high-dose quercetin and Cd are simultaneously administered to rats, the intensities of taurine and PCr were significantly increased in group DQ2 compared with those in group D (Online Supplementary Table S5). This finding indicates that high-dose quercetin has a protective effect on lipid and energy metabolic disorders induced by Cd. The protective effect of quercetin can be explained by increasing NAD+/NADH ratio.
LPC is the major product of low-density lipoprotein oxidation. Phospholipase A2 (PLA2) hydrolyses PC to liberate LPC. Increased LPC concentration in urine may possibly be associated with intensified PLA2 activity. 30 PLA2 can release free fatty acids and affect lipid metabolism. 31 Quercetin modulates PLA2 interfacial activity via its effects on membrane-bound mode of PLA2. 32 In the current study, the intensity of LPC in group D was significantly increased compared with that in group C. When high-dose quercetin and Cd are simultaneously administered to rats, the intensity of LPC was significantly decreased in group DQ2 compared with that in group D (Online Supplementary Table S5), indicating that high-dose quercetin has a protective effect on lipid metabolic disorders induced by Cd.
The second pathway involves the antioxidant defence system (Figure 4). SOD, CAT and GSH play an important role in protecting the body from oxidative stress and lipid peroxidation. In the current study, the CAT and SOD activities and the GSH level were significantly decreased and the MDA level was significantly increased in group D compared with those in group C, which indicated that the antioxidant defence system was affected. When high-dose quercetin and Cd are simultaneously administered to rats, the CAT and SOD activities and the GSH level were significantly increased and the MDA level was significantly decreased in group DQ2 compared with those in group D (Table 2), which indicates that high-dose quercetin has a protective effect on oxidative stress induced by Cd. 33 UA can increase the production of ROS and promote inflammation. 34 –36 High levels of UA in serum lead to increased oxidative stress. 37 In addition, LPC can induce the enhancement of oxidative stress through reactive species generation by an activated 5-lipoxygenase pathway. 38,39 Allantoic acid is hydrolysed by allantoin. Decreased levels of allantoin in urine are associated with oxidative stress. 40 In the current study, the level of UA in serum and the intensities of LPC and allantoic acid in urine were increased in group D compared with those in group C, indicating that Cd can induce oxidative stress. Quercetin was reported to significantly attenuate ROS overproduction and the expression of 5-lipoxygenase. 41,42 The level of UA in serum and the intensities of LPC and allantoic acid in urine were decreased in group DQ2 compared with that in group D (Online Supplementary Table S5). This finding indicates that high-dose quercetin can reduce Cd-induced oxidative stress by enhancing the antioxidant activity of the body.
The third pathway involves the nervous system (Figure 4). GSA is a neurotoxin. 43 Excessive accumulation of GSA in the brain produces neural excitotoxicity. 44 DA, a neurotransmitter, is mainly responsible for the brain’s attention, feeling, memory and learning. 45 Excessive DA was reported to have a toxic effect on the nervous system. 46 In this study, the levels of GSA and DA were significantly increased in group D compared with those in group C, which may be related to neurotoxicity due to Cd-induced Akt phosphorylation. 47 Quercetin-3-O-glucuronide, a quercetin metabolite, was reported to have a contrary effect on the neural stem cell viability through opposite regulation of Akt phosphorylation and had a certain protective effect on neurodegeneration or neurotoxicity. 48 The levels of GSA and DA in group DQ2 were significantly decreased compared with those in group D (Online Supplementary Table S5), which indicates that high-dose quercetin has a protective effect on the neurotoxicity induced by Cd.
The fourth pathway is linked to the kidney and liver function (Figure 4). The kidney is necessary to balance the internal environment of the body. GSA, a guanidino compound, is a uremic toxin. 49 GSA can induce inflammation and activate leukocytes, causing renal failure. 50,51 In patients with chronic renal insufficiency, GSA levels in urine and serum are increased. 52 In this study, the GSA level in group D was significantly increased compared with that in group C, which indicates that Cd may cause kidney damage. Quercetin was also reported to improve renal function by inhibiting histological leukocyte infiltration and reducing oxidative stress factors and kidney inflammation. 53,54 When high-dose quercetin and Cd are simultaneously administered to rats, the level of GSA was significantly decreased in group DQ2 compared with that in group D (Online Supplementary Table S5), indicating that high-dose quercetin has a protective effect on Cd-induced renal injury.
UA, the end product of purine metabolism, activates NF-kB signalling in proximal tubular cells to induce renal inflammation, thereby causing tubular damage. 55 In the renal tubular injury, the excretion of UA was decreased, and the level of UA in serum was increased. 56 –59 In the study, the level of UA was significantly decreased and the levels of β2-MG, RBP and NAG/Cr were significantly increased in group D compared with those in group C. This finding indicates that Cd may cause the renal tubular damage. Quercetin was also reported to have a potential protective role in renal tubular damage by reducing the production of inflammatory cytokines and decreasing the transcriptional activity of NF-kB. 60,61 When high-dose quercetin and Cd are simultaneously administered to rats, the level of UA was significantly increased and those of β2-MG, RBP and NAG/Cr were significantly decreased in group DQ2 compared with those in group D (Online Supplementary Table S5 and Table 1). This finding indicates that high-dose quercetin has a protective effect on Cd-induced tubular damage.
The liver plays an important part in metabolism and detoxification. α-CEHC is the main urinary metabolite of the α-tocopherol. The liver X receptor (LXR) regulates α-TTP expression. 62 Some studies have shown that LXR has an antioxidant and anti-inflammatory function in the liver and plays an important role in cholesterol and lipid metabolism. 63 When the liver lacks α-TTP, the content of α-CEHC in urine is significantly increased. 64 In the present study, the content of α-TTP in rat liver was significantly decreased (Figure 1), and the intensity of α-CEHC was significantly increased in group D compared with that in group C, indicating that Cd can cause liver damage. When high-dose quercetin and Cd are simultaneously administered to rats, the intensity of α-CEHC is significantly decreased in group DQ2 compared with that in group D (Online Supplementary Table S5). This finding indicates that high-dose quercetin can protect against liver injury by enhancing the antioxidant capacity of the liver tissue. 65
With regard to biomarker intensities in all groups (Online Supplementary Tables S5), the differences between groups DQ2 and D (p < 0.01 or p < 0.05) indicate the protective effects of quercetin on Cd-induced toxicity. Although some differences were noted between groups DQ2 and D (p < 0.01 or p < 0.05), differences were still observed between groups DQ2 and C (p < 0.05 or p < 0.01), indicating that high-dose quercetin elicits a partial protective effect on Cd-induced toxicity.
Conclusions
This study was conducted to investigate effects of quercetin on Cd-induced toxicity using metabonomics techniques. The study shows that high-dose quercetin has protective effects on Cd-induced toxicity by regulating energy and lipid metabolism and so on. These beneficial effects of quercetin are closely related to its antioxidant action. This provides a new insight into the mechanism of quercetin against the toxicity of Cd on the metabolic levels.
Supplemental material
Supplementary_File.docx - Effects of quercetin on cadmium-induced toxicity in rat urine using metabonomics techniques
Supplementary_File.docx for Effects of quercetin on cadmium-induced toxicity in rat urine using metabonomics techniques by Y Liu, X Zhang, T Guan, S Jia, Y Liu and X Zhao in Human & Experimental Toxicology
Footnotes
Authors’ note
The Laboratory of Nutrition and Food Hygiene in Harbin Medical University is the key laboratory of Heilongjiang Province and Heilongjiang Higher Education Institutions.
Declaration of conflicting interests
The author(s) declared no potential conflicts of interest with respect to the research, authorship, and/or publication of this article.
Funding
The author(s) disclosed receipt of the following financial support for the research, authorship, and/or publication of this article: This work was supported by the China National Center for Food Safety Risk Assessment.
Supplemental material
Supplemental material for this article is available online.
References
Supplementary Material
Please find the following supplemental material available below.
For Open Access articles published under a Creative Commons License, all supplemental material carries the same license as the article it is associated with.
For non-Open Access articles published, all supplemental material carries a non-exclusive license, and permission requests for re-use of supplemental material or any part of supplemental material shall be sent directly to the copyright owner as specified in the copyright notice associated with the article.