
Abstract
Of all cancer types, prostate cancer is the second most common one with an age-standardized incidence rate of 29.3 per 100,000 men worldwide. Nitric oxide (NO) is both a radical and versatile messenger molecule involved in many physiological activities. NO was documented to be highly secreted and utilized by cancer cells. Nω-nitro-
Keywords
Introduction
Of all cancer types, prostate cancer is the second most common one with an age-standardized incidence rate of 29.3 per 100,000 men worldwide and the most frequently diagnosed cancer in 105 countries, followed by lung cancer in 37 countries according to 2018 statistics of GLOBOCAN. 1 In 2018, 1.3 million new prostate cancer cases were recorded. 1 During the first stages of prostate cancer, modalities including active surveillance, radical prostatectomy (RP), or radiation therapy (RT) are employed. In the prostate cancer stages posing mortality risk to the patient, applications such as RP ± RT and androgen deprivation therapy are done. 2,3 However, these applications do not present remedy for every patient, and the prostate-specific antigen re-elevates in 25% of patients. 4 At this stage of the disease, androgen deprivation therapy serves as a standard treatment method and is based on eliminating the circulating androgens which promote prostate growth. 5 Nonetheless, most patients do not respond to androgen deprivation therapy and develop castration-resistant prostate cancer, which is fatal. 3,6
Nitric oxide (NO) is both a radical and versatile messenger molecule involved in many physiological activities such as vasodilatation, neurotransmission, immune system response, angiogenesis, and so on. It can be synthesized by three different NO synthases (NOS) as neuronal (nNOS), inducible (iNOS), and endothelial (eNOS). NO was documented to be highly secreted and hence utilized in cancer cells. In several studies, exhaled NO and nitrite were reported to be increased in lung cancer.
7,8
eNOS deficiency was reported to decrease pancreatic lesions and prolong the lifespan of mice with advanced cancer.
9
In another study, angiogenesis and tumor growth were associated with high levels of NOS in head and neck cancers.
10
Similarly, while eNOS was reported to enhance the Ras proteins’ activation, which are crucial proteins for tumorigenesis, blocking it prevented tumor initiation and maintenance.
11
Collectively, inactivation of NO synthesis provides great hope for cancer treatment. Besides, the availability of small molecule inhibitors to inactivate NO synthesis such as Nω-nitro-
LNCaP, DU145, and PC-3 human prostate cancer cells are popularly employed in the studies of prostate cancer. DU145 cells are a hypotriploid, epithelial, and adherent cell line, characterized by Stone et al. 19 from a lesion in the brain of a patient with metastatic carcinoma of the prostate. To the best of our knowledge, there is only one study 20 which investigated the effect of L-NAME on prostate cancer cells but did not reveal the IC50 concentration of L-NAME. To fill this gap, we carried out a cytotoxicity study on how different doses of L-NAME affect DU145 human prostate cancer cells.
Materials and methods
Cell culture
DU145 cells (ATCC® HTB-81) were procured from the American Type Culture Collection (ATCC, Rockville, Maryland, USA) and maintained in 89% ready-to-use medium (Dulbecco’s Modified Eagle’s Medium) with 10% (v/v) fetal bovine serum and 1% (v/v) penicillin-streptomycin (100 U/mL–100 µg/mL) at 37°C in a humidified atmosphere of 95% air and 5% CO2. The cells were cultured in 75 cm2 cell culture flasks. On experiment day, sufficiently confluent (80–90%) cells’ medium was discarded, washed with phosphate-buffered saline (PBS), rewashed with PBS-EDTA, and detached with 0.25% trypsin-1 mM EDTA solution.
MTT cytotoxicity assay
3-(4,5-Dimethylthiazol-2-yl)-2,5-diphenyltetrazolium bromide (MTT) is one of the common cytotoxicity tests based on mitochondrial dehydrogenase activity of the viable cells. 21 For cytotoxicity assay, the cells were grown in 96-well plates at a density of 5 × 10³ cells per well. Firstly, cells were allowed to adhere to flasks 1 day before the experiment. No stock solution was used. L-NAME solution was freshly prepared using cell medium just before the experiment and filtered by 0.21 µm filter. The concentration range for L-NAME was selected by preliminary experiments conducted in our laboratory. Firstly, L-NAME doses ranging from 0 µM to 1000 µM were used. Then, the dose range was increased from μM to mM level, and the doses ranging between 0 mM and 32 mM were used. L-NAME was administrated to the DU145 cells in a 96-well plate. Following 24-h treatment, the cell media were discarded and 100 μL of 0.5 mg/mL MTT diluted in medium was added to the wells. After 4-h incubation period at 37°C, the formazan salts were dissolved with 100 μL DMSO by shaking. Finally, absorbance values of each well were quantified at the wavelength of 570 nm in enzyme-linked immunosorbent assay (ELISA) reader (800TS, BioTek Instruments, Winooski, Vermont, USA). Thereafter, the viabilities of the L-NAME-treated cells were calculated considering the viability of the untreated cells as 100%. The following formula was used to calculate the viability percentages:
where OD refers to optical density.
The inhibitory concentrations of 25% (IC25), 50% (IC50), and 75% (IC75) were estimated by the graph drawn with the help of cell viability percentages. These concentrations were used in all the analyses except for hematoxylin-eosin staining and immunocytochemistry. For hematoxylin-eosin staining only IC50 and IC75 and for immunocytochemistry only IC25 and IC50 doses were used.
Cell lysate preparation
Cell lysates for malondialdehyde (MDA), glutathione (GSH), NO, total antioxidant status (TAS), total oxidant status (TOS), tumor necrosis factor-α (TNF-α), interleukin-6 (IL-6), cytochrome C somatic (CYCS), and caspase 3 (CASP3) assays were prepared according to the following method. Three concentrations of L-NAME (6.9, 12.2, and 22.4 mM) were used in all the above-mentioned assays. Twenty-four hours after respective L-NAME application, adherent cells were rinsed gently by ice-cold PBS (pH = 7), then detached by trypsin and collected by centrifugation at 300 × g for 10 min at 4°C. The supernatant was discarded and the pellet was resuspended in 500 µL of cold radioimmunoprecipitation assay (RIPA) lysis buffer. Resuspended cells were incubated in RIPA (sc-24948, Santa Cruz Biotechnology, California, USA) for 30 min with sporadic vortexing on ice. Ensuingly, the cells were centrifuged at 16,000 × g for 10 min at 4°C to precipitate cell debris. Protein levels were measured by the biuret method. 22 The prepared cell lysates were used at once for the assays.
Lipid peroxidation measurement
MDA levels of cell lysates were quantified utilizing the method reported by Ohkawa et al. 23 MDA is considered as a crucial parameter that is commonly used as a marker of lipid peroxidation. It is a thiobarbituric acid reactive substance, which is a byproduct of fat degradation. Besides, MDA is normally a colorless liquid. When it was incubated with thiobarbituric acid, it gives a pink color. Concisely, the cell isolates were incubated with thiobarbituric acid at 95°C for 1 h, and pink-colored complex formed. The absorbance of pink-color density was spectrophotometrically quantified at 532 nm. The results were presented as nmol/mg protein.
Glutathione measurement
GSH levels were determined according to the modified method of Srivastava and Beutler. 24 Briefly, it is based on the measurement of 5-thio-2-nitrobenzoic acid that occurs as a result of the reaction between GSH and 5,5′-dithiobis (2-nitrobenzoic acid), known as Ellman’s reagent. The color intensity associated with the GSH concentration was determined by measuring the absorbance values at 412 nm. Reaction medium contains 0.1 mL cell lysates, 1 mL 200 mM Tris–HCl buffer (pH = 8), and 0.1 mL Ellman’s reagent (60 mg/100 mL, 0.2 M Tris–HCl buffer, pH = 6.5). GSH levels were expressed as μmol/mg protein.
Nitric oxide measurement
Quantification of NO levels relies on the measurement of nitrite and nitrate, which are the end products resulting from the oxidation of NO. The quantities of nitrite (NO−2) and nitrate (NO−3) in the samples are measured in two steps. First, nitrate is reduced via enzymatic transformation or via cadmium. Then, in the acidic environment, the nitrite reacts with diazotization with sulfanilamide, which is the aromatic amine, and forms a purple azo compound with N-(1-naphthyl) ethylenediamine. Deproteinization is the critical step, which is carried out to eliminate proteins that interfere with the assay. In the present study, the nitrite levels in DU145 cells were determined by the method of Cortas and Wakid. 25
TNF-α and IL-6 measurements
TNF-α and IL-6 levels were measured using commercial kits (cat no. SEA133Ra and SEA079Ra; Cloud-Clone Corp., Texas, USA) in ELISA reader (Perkin Elmer 2030 Multilabel, Victor X3, Turku, Finland). The concentrations of TNF-α and IL-6 in cell lysates were shown as pg/mL in comparison with the optical density of the standard curve.
TOS, TAS, and oxidative stress index measurements
TOS and TAS measurements were performed according to the manufacturer’s instructions (Rel Assay Diagnostics, Gaziantep, Turkey). TOS measurement is based on the oxidation process. During the oxidation of ferrous ion to ferric ion, a colored complex molecule is formed in the reaction medium. The color density, which represents the total amount of TOS in cells, was measured spectrophotometrically at 530 nm. The results were expressed as µmol H2O2 equiv./L. TAS measurement is based on the reduction of colored 3-ethylbenzothiazoline-6-sulfonate (ABTS) to colorless ABTS by antioxidants. Reduction of ABTS was monitored at 660 nm. The results were expressed as mmol Trolox equiv./L.
Oxidative stress index (OSI) is the proportion of TOS to TAS. To carry out the OSI calculation, the unit of TAS, millimoles of Trolox equivalent per liter, was converted into micromoles of Trolox equivalent per liter. The formula to calculate OSI is as follows:

Data are displayed as mean ± standard deviation (SD).
CYCS and CASP3 assays
CYCS and CASP3 levels in DU145 cell lysates were measured using colorimetric commercial kits, pre-coated with an antibody specific to either CYCS or CASP3 (Cloud-Clone Corp.). The cells were lysed according to the manufacturer’s protocol. Briefly, cells were washed by cold PBS (pH = 7) and then gathered by centrifugation at 1500 × g for 10 min. Resuspended cells in fresh lysis buffer were subjected to homogenization for 1 min and centrifuged at 1500 × g for 5 min at 2–8°C to remove cellular debris. Cell lysates were stored at −20°C until the measurement day. The enzyme–substrate reactions for CYCS and CASP3 were performed according to the manufacturer’s instructions and then color changes were determined spectrophotometrically at 450 nm. The concentrations of CYCS and CASP3 in cell lysates were indicated as ng/mL by comparing to the optical density of the standard curve.
Inverted microscopy
Cells were incubated on the coverslips in six-well plates and treated with different L-NAME concentrations (6.9, 12.2, and 22.4 mM) determined by MTT. Then, the plates were scrutinized under an inverted microscope with terms of morphological alterations.
Hematoxylin-eosin staining
The hematoxylin-eosin staining is a widespread method used for examining cellular changes. 26 The morphological alterations of DU145 cells were observed under a BX51 light microscope (Olympus Corporation, Tokyo, Japan) attached with a DP70 digital camera (Olympus Corporation). In this respect, DU145 cells were seeded into six-well plates until they adhered on the bottom of the flasks. After that, the cell medium was removed and the cells were rinsed with PBS. The cells were incubated with different L-NAME concentrations (12.2 and 22.4 mM) determined by MTT assay. Next, the cells were fixed with 100% ice-cold methanol and rewashed with PBS. Thereafter, hematoxylin was applied for 4 min and the cells were immersed into 1% ammonia solution. Ensuingly, the eosin stain was applied for 5 min. In the end, the cells were washed with distilled water, dried and mounted with the aqueous mounting medium.
Immunocytochemistry
Cells were seeded at a density of 3 × 10⁵ on lamellae in six-well plates and treated with L-NAME concentrations of 6.9 and 12.2 mM for 24 h. Subsequently, the cells were washed with PBS and fixed with 100% ice-cold methanol for 10 min. After three washes with PBS for 5 min each, cells were incubated in 0.2% Triton X for 5 min, followed by blocking solution for 10 min. After that, cells were incubated with primary antibody against Bax (1:50, sc-526; Santa Cruz Biotechnology, Santa Cruz, California, USA) overnight at 4°C with sufficient moisture provided. Next day, biotinylated goat anti-polyvalent and streptavidin-peroxidase reagents were consecutively added for 10 min each. 3-Amino-9-ethylcarbazole was used for color development and hematoxylin for counterstaining. Finally, the samples were mounted with the aqueous mounting medium and observed under a light microscope.
Statistical analysis
Three independent experiments were done at different times for all assays. Results were expressed as the mean ± SD. For statistical analyses, GraphPad Prism 7.0 (San Diego, California, USA) was employed. All the data of this study followed Gaussian distribution as a result of the Shapiro–Wilk normality test. Therefore, the analysis of variance and Tukey’s post-hoc test were performed. The statistical significance was considered as p < 0.05.
Results
Cell proliferation assay results
In the first MTT assay, between the concentration range 0 and 1000 µM of L-NAME, we did not detect any prominent decrease in cell viability when compared to control (Table 1, p > 0.05). As such, we increased the concentration range of L-NAME and used the doses of 32 mM and below (Table 2). Similar to first MTT results, in second MTT, no significant decrease in cell viability was detected (p > 0.05) at 0.5, 1, 2, and 4 mM of L-NAME. However, at 8 mM of L-NAME, cell viability lowered to 68.4% (p < 0.001 vs. control). Furthermore, the cell viability decreased to 33.3% at 16 mM and to 12.7% at 32 mM (for both p < 0.001 vs. control). IC25, IC50, and IC75 were found as 6.9, 12.2, and 22.4 mM, respectively.
Cell viability percentages belonging to various L-NAME concentrations (0–1000 µM) according to the first MTT assay results.

ns: no significant difference was detected among the groups; L-NAME: Nω-nitro-
Cell viability percentages belonging to L-NAME concentrations according to the second MTT assay results.

ns: no significant difference was detected among the groups; L-NAME: Nω-nitro-
a Significant difference of p < 0.001 when compared to the control.
Oxidative stress results
As depicted in Figure 1(a) and (e), 6.9, 12.2, and 22.4 mM of L-NAME elicited a significant dose-dependent rise in MDA and TOS levels in DU145 cells (p < 0.05 or p < 0.001 vs. control). The highest L-NAME concentration of 22.4 mM led to an approximate two-fold and three-fold rise in MDA and TOS levels, respectively (for both p < 0.001 vs. control). In contrast to MDA and TOS levels, 6.9, 12.2, and 22.4 mM of L-NAME caused a significant decrease in NO levels when compared to control (for all treated groups p < 0.001, Figure 1(c)).

Antioxidant and oxidant molecule levels of L-NAME-treated DU145 cells. The levels of (a) MDA, (b) GSH, (c) NO, (d) TAS, (e) TOS, and (f) OSI. •p < 0.05 and *p < 0.001 when compared to the control group. The results are displayed as mean ± SD of three separate experiments (n = 3). MDA: malondialdehyde; GSH: glutathione; NO: nitric oxide; TAS: total antioxidant status; TOS: total oxidant status; OSI: oxidative stress index; L-NAME: Nω-nitro-
As for GSH and TAS levels, a significant drop in antioxidant levels was observed in DU145 cells following L-NAME treatments (for all treated groups p < 0.001, Figure 1(b) and (d)). The dose-dependent decrease was more apparent in GSH compared to TAS levels. In TAS levels, the lowest L-NAME dose caused a sudden decrease and other used doses almost maintained this level. At the highest dose of L-NAME, GSH, and TAS levels almost lowered in half when compared to control.
OSI calculated by TAS and TOS levels are shown in Figure 1(f). A dose-dependent increase in OSI of L-NAME-treated groups was evident and statistically significant when compared to that of control (for all treated groups p < 0.001). There were almost a three-fold increase in OSI at the moderate dose and almost five-fold increase at the highest dose, whereas this increase was only two-fold at the lowest dose of L-NAME.
Inflammatory cytokine results
To evaluate inflammation, the levels of inflammatory cytokines TNF-α and IL-6 were analyzed. Similar to MDA and TOS levels, these cytokines rose significantly depending on L-NAME doses (for each treated group p < 0.001 vs. control, Figure 2(a) and (b)). The lowest values of TNF-α and IL-6 were 185.7 and 123.1 pg/mL and observed in the untreated group. The highest values of TNF-α and IL-6 were 433.4 and 336.3 pg/mL and observed at 22.4 mM of L-NAME.

TNF-α and IL-6 levels of L-NAME-treated DU145 cells. (a) TNF-α levels and (b) IL-6 levels. *p < 0.001 when compared to the control group. The results are displayed as the mean ± SD of three separate experiments (n = 3). TNF-α: tumor necrosis factor-α; IL-6: interleukin-6; L-NAME: Nω-nitro-
Apoptosis evaluation results
To evaluate apoptosis, the levels of CYCS and CASP3 were analyzed. The CYCS levels increased approximately 1.5-, 2.5-, and 3-folds in increasing doses of L-NAME when compared to control group (for all p < 0.001, Figure 3(a)). The lowest mean value of CYCS was 5.337 ng/mL in the control group, and the highest mean value was 15.86 ng/mL in 22.4 mM of L-NAME-treated group. The CASP3 levels increased approximately 1.7-, 3.3-, and 5.2-folds in increasing doses of L-NAME when compared to control group (for all p < 0.001, Figure 3(b)). The lowest mean value of CASP3 was 2.355 ng/mL in the control group, and the highest mean value was 12.22 ng/mL in 22.4 mM of L-NAME-treated group.
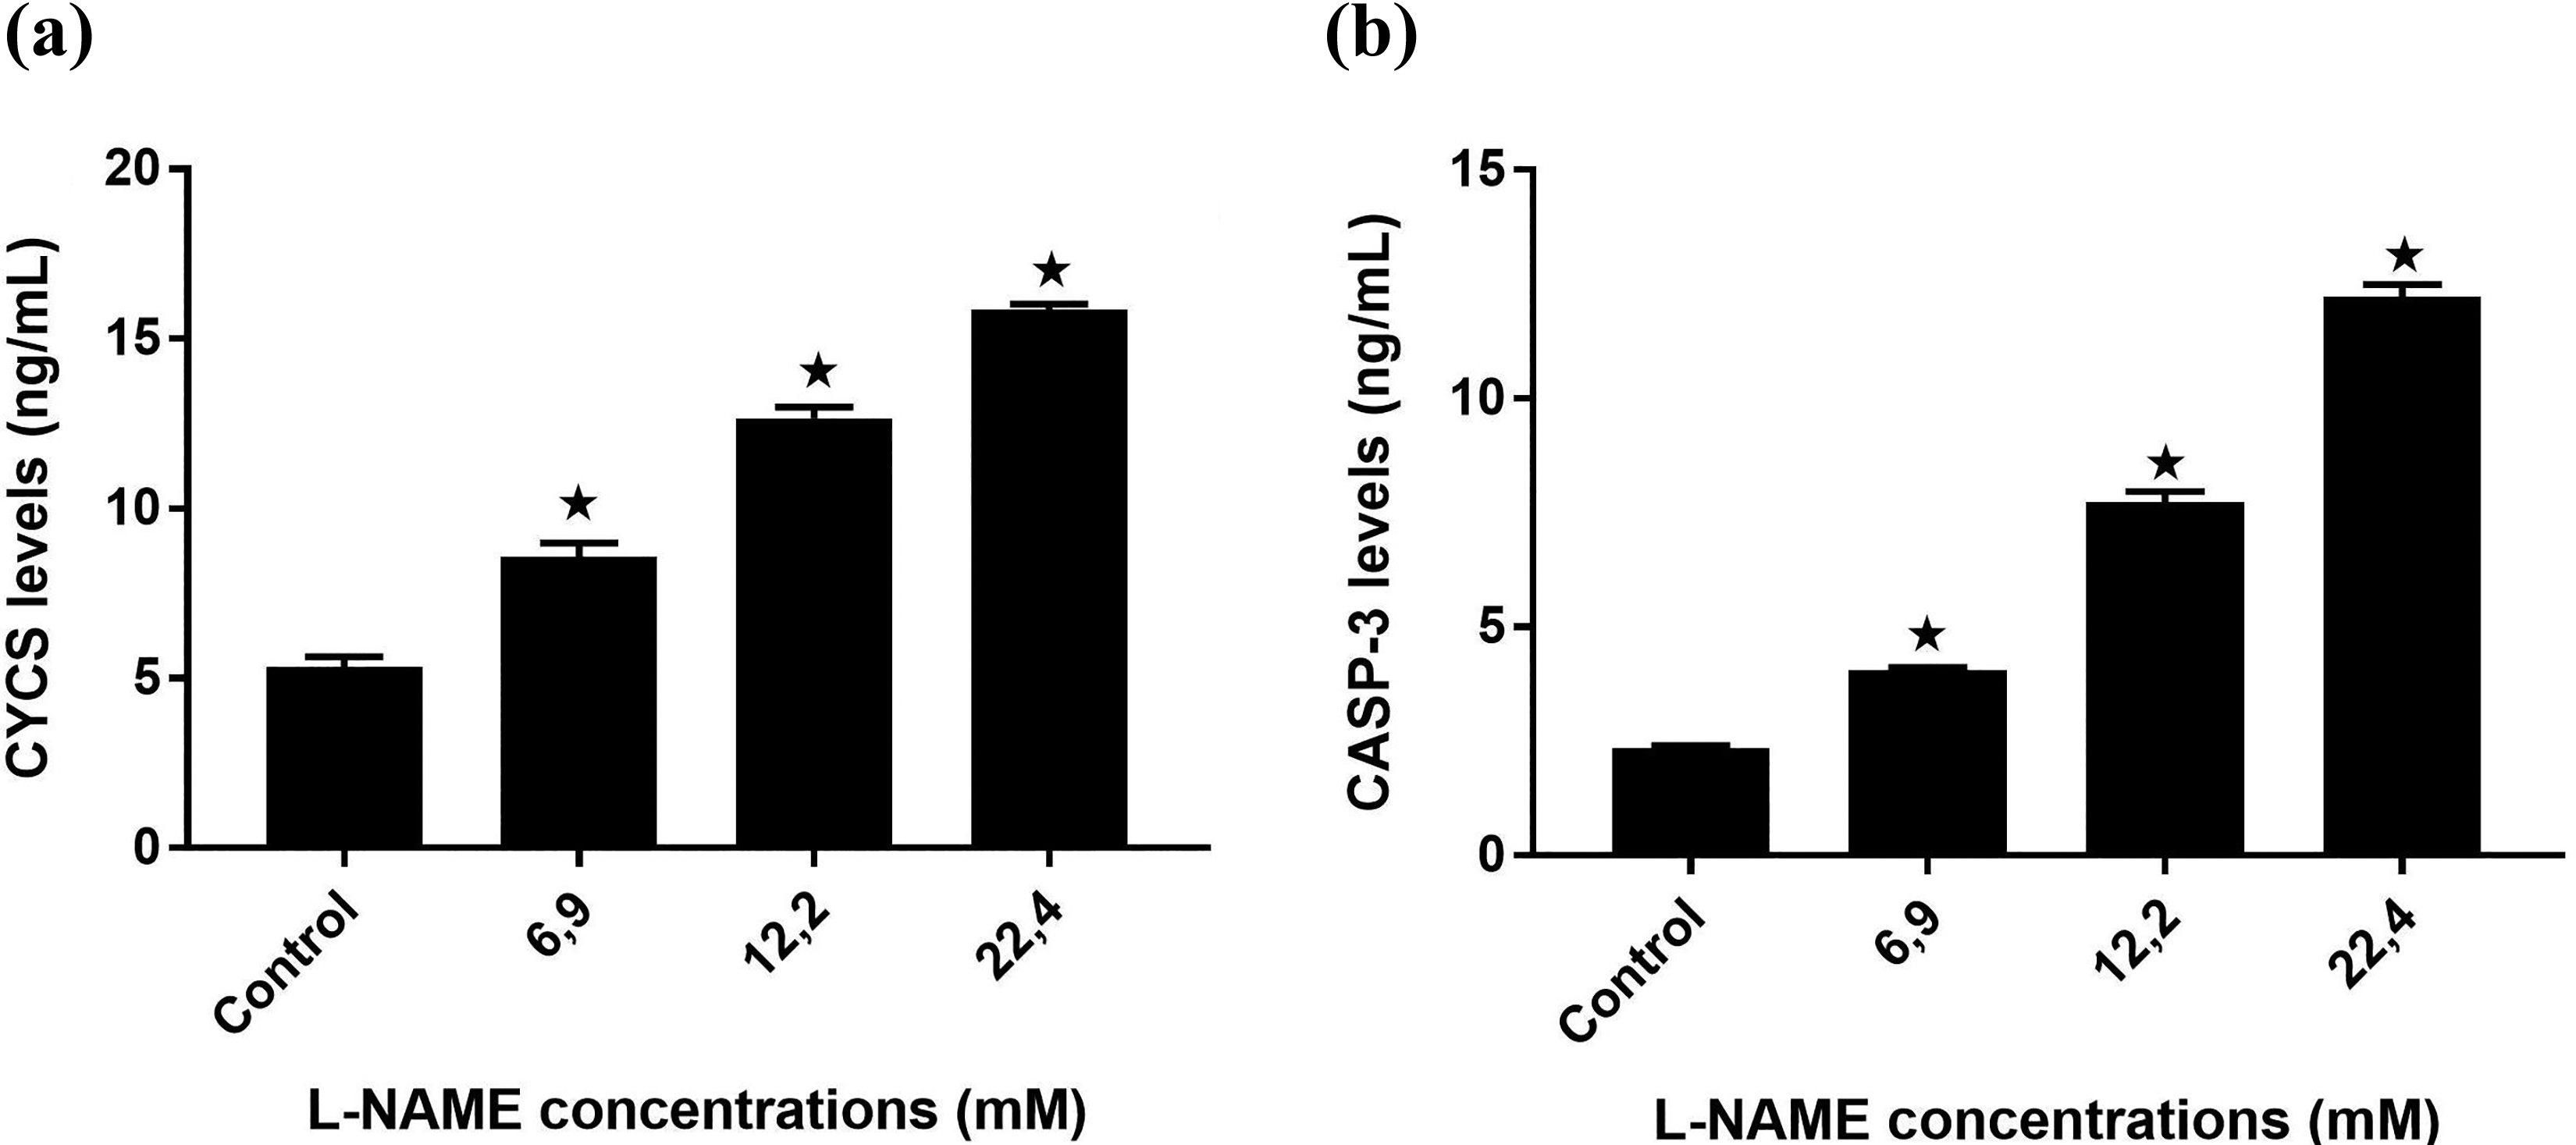
CYCS and CASP3 levels of L-NAME-treated DU145 cells. (a) CYCS level and (b) CASP3 level. *p < 0.001 when compared to the control group. The results are displayed as the mean ± SD of three separate experiments (n = 3). CYCS: cytochrome C somatic; CASP3: caspase 3; L-NAME: Nω-nitro-
Microscopic analysis results
According to inverted microscope observations (Figure 4(a) to (d)), L-NAME decreased the number of DU145 cells and led to several degenerations including cellular shrinkage and rounded cells in a concentration-dependent manner.

Inverted microscope images of L-NAME-treated DU145 cells. (a) Untreated DU145 cells. (b) 6.9 mM of L-NAME-treated cells. (c) 12.2 mM of L-NAME-treated cells. (d) 22.4 mM of L-NAME-treated cells. Note that the cell density decreases while rounded and shrunken cells increase in a concentration-dependent manner. Original magnification: ×200. L-NAME: Nω-nitro-
Hematoxylin-eosin stained cells are shown in Figure 5(a) to (f). Untreated DU145 cells demonstrated a normal morphology with standard size and typical euchromatic nuclei. However, several degenerations and apoptotic changes, including shrunken cells with condensed nuclei, membrane blebbing, and apoptotic bodies, were evident in 12.2 mM of L-NAME-treated cells. In contrast to 12.2 mM dose, there were swollen cells with numerous vacuolization, apart from the cells with kidney-shaped and condensed nuclei in 22.4 mM of L-NAME-treated cells.

Hematoxylin-eosin stained cells of L-NAME-treated DU145 cells. (a) and (b): Untreated DU145 cells. Red arrow in (b): a normal cell with euchromatic nucleus and regular cytoplasm. (c) and (d): 12.2 mM of L-NAME-treated cells. Empty arrows in (c): membrane blebbings, red arrow in (c): condensed nuclei, and in (d): membrane blebbing and apoptotic body formation. (e) and (f): 22.4 mM of L-NAME-treated cells. Red arrow in (e): cellular vacuolization, and in (f): cellular swelling, empty arrows in (e) and (f): shrunken cells with condensed nuclei and eosinophilic cytoplasm, arrowheads in (e) and (f): kidney-shaped nucleus with cellular vacuolization. Bars in (a), (c), and (e) indicate 50 µm and bars in (b), (d), and (f) indicate 20 µm. L-NAME: Nω-nitro-
Bax-immunostained DU145 cells are shown in Figure 6(a) to (c). Untreated DU145 cells were immune negative. In 6.9 mM of L-NAME-treated cells, Bax-immunopositive cells were visible. As the concentration of L-NAME increased to 12.2 mM, the density and number of Bax-immunopositive cells increased.

Bax staining images of L-NAME-treated DU145 cells. (a) Untreated DU145 cells. Note of the negative immunostaining. Arrows: Bax-negative cells. (b) 6.9 mM of L-NAME-treated cells. Arrow: slightly Bax-positive cells and arrowhead: intensely Bax-positive cell (c) 12.2 mM of L-NAME-treated cells. Arrows: intensely Bax-positive cells. All bars indicate 50 µm. L-NAME: Nω-nitro-
Discussion
In this study, we investigated the toxic doses of L-NAME for DU145 cells, determined three doses including IC25, IC50, and IC75 and performed biochemical, apoptotic, and morphological analyses. To the best of our knowledge, this is the first study to disclose the effects of L-NAME on DU145 cells.
In the MTT cytotoxicity analysis, we could not detect a significant decrease in cell viability at the doses of L-NAME less than 4 mM. At the doses higher than 4 mM, there was a dose-dependent decrease in the viability of DU145 cells. IC50 was determined as being 12.2 mM in DU145 cells. Majdzadeh et al. 27 studied the effect of L-NAME on MCF-7 breast cancer cells and their IC50 was between 10 mM and 20 mM in the MTT test. In their study, the viabilities of MCF-7 cells at 10, 20, and 40 mM of L-NAME were nearly 80%, 40%, and <20%, while in the current study, the viabilities of DU145 cells at 8, 16, and 32 mM of L-NAME were 68.4%, 33.3%, and 12%, respectively. In this respect, it can be conceivable that DU145 cells are more sensitive to L-NAME than MCF-7 cells. Shang et al. 28 treated squamous cell carcinoma cells with L-NAME for 48 h. In their MTT assay, they used doses between 0 mM and 20 mM. L-NAME doses (8 and 16 mM) decreased the MCF-7 cell viabilities to 70.2% and 50.2%, respectively. In our experiment, the same doses decreased DU145 cells viabilities to 68.4% and 33.3%. Considering their treatment duration was longer than ours, we can surmise that DU145 cells are more sensitive to L-NAME than squamous cell carcinoma cells. In the study of Vanella et al., 20 both 0.1 and 1 mM of L-NAME decreased the cell viabilities of human prostate BPH1 and LNCaP cells significantly. However, in our study, we could not find any difference between cell viabilities of DU145 cells at these doses.
Our starting point for this study was NO, which is documented to be involved in carcinogenesis as well as many physiological and pathological processes. High amount of NO makes the cells to be mutated by generating carcinogenic nitroso compounds and deaminating DNA bases. 29 Therefore, we aimed to inhibit this procancer molecule with L-NAME, a small molecule inhibitor. In our study, not intriguingly, NO amounts decreased with the increasing concentrations of L-NAME.
Oxidative stress commences when the balance between production of reactive oxygen species (ROS) and antioxidants shifts to the former. It starts when cellular reserves of antioxidants are no longer able to withstand overwhelming amount of oxidants. As a result, biological molecules and cells become damaged. ROS production can be either advantageous or disadvantageous for cancer cells. ROS, in normal cells, can induce DNA damage, generating the mutations that feed and progress cancerogenesis in one hand. On the other hand, ROS can also cause cancer cells to undergo death by behaving like an anticancer agent. The effect of ROS on cancer cells depends on a number of factors, including the amount of ROS, cell and tissue types and the site of production, and so on. 30 In our study, the DU145 cells underwent death, indicating that generated oxidative stress surpassed the level that cancer cells are able to tolerate. Yokohama et al. 31 investigated if anticancer drugs produced oxidative stress in cancer cells using DLD-1 human colorectal cancer cells. They found that 12 out of 20 anticancer drugs produced ROS and suggested anticancer drugs to utilize ROS-induced mechanisms. In our study, we showed an increase in oxidative stress by MDA, TOS, and OSI, which increased dose-dependently after L-NAME treatments. Also, we showed cellular antioxidant reserves to decrease by GSH and TAS assays. In the study of Cardoso et al. 32 with L-NAME-induced hypertension rats, protein and lipid peroxidation increased significantly while NO and antioxidant levels such as catalase and superoxide dismutase decreased upon L-NAME treatment. 32 Consistently, also in our study, NO and antioxidant levels decreased while oxidant levels increased. NO is also an important cell signaling molecule as much as being a free radical. NO was implicated in activating mitogenic pathways, inducing growth hormones and inhibiting apoptosis in cancer. 33 It was reported that NO induces the extracellular signal-regulated kinase, 34 Wnt/β-catenin, 35 and mTOR mitogenic pathways, 36 thereby promoting migration and proliferation of the cells. As such, in our study, upon the inhibition of NO by L-NAME, these mitogenic pathways might have remained inactivated and apoptosis might have triggered.
In our study, we found an increase in inflammatory markers after L-NAME treatment. In literature, consistently, Ding et al. 37 reported an increase in both TNF-α and IL-6 levels in L-NAME-treated rats. On the other hand, in the study of Reis et al., 38 L-NAME was stated to reduce the influx of inflammatory cells in tumor growth. This discrepancy can arise from different doses and duration of L-NAME applied.
The ability to control the survival or death of a cell is thought to hold an immense therapeutic hope. That is why the cell cycle process and its associated signaling pathways that stop it and induce apoptosis are centered in the studies. The process of apoptosis, programmed cell death, is characterized by well-defined morphological hallmarks and energy-dependent biochemical mechanisms. 39 Since its sufficiently known mechanism and being based on consecutive determined changes, apoptosis-inducing substances are in high demand in cancer research. In our study, we detected a dose-dependent rise in apoptotic markers and also confirmed this result by morphological analysis. In literature, in the study of Majdzadeh et al., 27 L-NAME was suggested to partially lead to apoptosis and proposed to show its effect by another cell death mechanism. In our study, we found increase in CASP3, CYCY, and Bax immunostaining as well as apoptotic hallmarks morphologically. In the morphological analysis, we used the inverted and light microscope images to assess the morphological changes in DU145 cells. We observed characteristic changes for apoptosis such as nuclear condensation, membrane blebbing, apoptotic bodies as well as crescent-shaped nuclei at all doses of L-NAME. However, intriguingly, at the highest dose, we also observed vacuolated cells with swollen cytoplasm. We speculated two reasons to explain this unexpected vacuolization event. Either L-NAME enters into cellular organelles and forms vacuoles by accumulating or that these vacuoles are an indication of a different cell death type induced by L-NAME. There are two vacuolization types as reversible and irreversible. 40 In the former one, in neutral extracellular fluid, lipophilic bases are uncharged and can transit the plasma membrane. 41 Uncharged lipophilic bases readily enter into organelles’ membranes in intracellular medium, wherein they become positively charged and arrested, which rises osmotic pressure of organelle. High osmotic pressure favors water diffusion into organelle, and thereby vacuoles form. 42 This type of vacuolization is consistent with our first speculation. The irreversible version of vacuolization occurs in cytopathological conditions ending with cell death and is attributed to a cytotoxic stimulus, 40 which is consistent with our second speculation and also stated in the above-mentioned study of Majdzadeh et al.
To recap, L-NAME, broadly used NO inhibitor, exerted a dose-dependent cytotoxic effect on DU145 prostate cancer cells. It mainly induced apoptosis, except for the highest dose used, and provoked inflammatory cytokine synthesis by eliciting an increase in oxidant levels and a decrease in antioxidant levels of the cells. The IC50 value of L-NAME for DU145 cells was determined as 12.2 mM. This study was a cytotoxicity-based study, and we believe it to provide insights about L-NAME dose and possible effects in future studies. The shortcoming of this study can be that we did not check other cell death pathways especially at highest L-NAME dose, and we did not support this in vitro study with an in vivo model. L-NAME seems to be a very advantageous molecule to use in cancer, given that it has a high value of IC50, implying to be less toxic, and the ability to inhibit a procancer agent, NO. It may offer potential to be used as an adjuvant or protective agent in cancer therapy once its exact mechanism and effects on the body have been uncovered. Further studies are needed to elucidate its exact mechanism.
Footnotes
Declaration of conflicting interests
The author(s) declared no potential conflicts of interest with respect to the research, authorship, and/or publication of this article.
Funding
The author(s) received no financial support for the research, authorship, and/or publication of this article.