
Abstract
This study investigated the effect of heptachlor-induced oxidative stress (OS) on transforming growth factor (TGF)-β1-mediated epithelial to mesenchymal transition (EMT) in human renal proximal tubular epithelial (HK-2) cells. Following treatment of HK-2 cells with an increasing concentration of heptachlor (0.01–10 µM) for 24 h, the intracellular reactive oxygen species and malondialdehyde level increased, whereas the glutathione-s-hydroxylase (GSH) level declined significantly in a dose-dependent manner. Pretreatment with N-acetyl cysteine attenuates the heptachlor-induced OS. In this study, we have shown that heptachlor-induced OS regulates the mRNA expression of TGF-β1-mediated Smad signalling genes accompanied by increased nuclear localization of phosphorylated Smad-2 and phosphorylated Smad-3. Furthermore, the m-RNA and protein level of epithelial marker, that is, E-cadherin decreased while the mesenchymal marker, that is, α-smooth muscle actin increased in heptachlor exposed HK-2 cells. In conclusion, heptachlor-induced OS might be responsible for the activation of TGF-β1/Smad signalling which ultimately leads to renal damage by means of EMT.
Keywords
Introduction
Heptachlor is a chlorinated dicyclopentadiene insecticide which is persistent in the environment and accumulates in the food chain. Despite its severe restriction in many countries 1 including India, 2 it is still detected as a contaminant in several food commodities. 3 Various investigators have detected the existence of heptachlor and its metabolite in human milk, 4 tissue 5 and blood. 6 Chronic exposure to heptachlor has been associated with blood related defects in humans along with neuronal 7,8 and renal defects. 9 Although the studies of heptachlor affecting kidneys are available, the specific mechanism behind the effect of heptachlor exposure in the kidney remains vague.
Exposure to various organochlorine pesticides (OCPs) including heptachlor induced the production of reactive oxygen species (ROS) in HaCaT cell line 10 and in SH-SY5Y cells 11 and hence increased oxidative stress (OS). It is presumed that OS may play a significant role in heptachlor-induced kidney dysfunction. OS in excess modulates the stimulation of various cytokines and transcription factors, leading to enhanced expression of extracellular matrix (ECM) genes, subsequently predilection to fibrosis, which represents the common final pathway proceeds to end-stage renal failure. 12
Transforming growth factor-β1 (TGF-β1) is one of the important factors upregulated by OS, 13,14 and the level of TGF-β1 has been found to be increased during renal fibrotic pathology. 15 The binding of TGF-β1 to its receptor leads to the phosphorylation of Smad2 and Smad3 and forms a complex of phosphorylated Smad-2 (p-Smad2)/phosphorylated Smad-3 (p-Smad3) with Smad4, which then translocated into the nucleus and transactivates the transcription factors regulating epithelial to mesenchymal transition (EMT). 16
EMT is a process of dedifferentiation of epithelial cells to the mesenchymal phenotype, the role of which in renal pathology has been revealed in multiple in vivo studies. 17 De novo α-smooth muscle actin (α-SMA) expression has been detected as a result of phenotypic changes in tubular epithelial cells in human renal biopsy samples. 18 A study by Rastaldi et al. has demonstrated that EMT was present with variable degrees independent of the histologic diagnosis on human renal biopsies of different renal diseases. 19
Therefore, in the present in vitro study, attempts have been made to evaluate whether heptachlor can cause OS-mediated EMT leading to kidney fibrosis and to elucidate the involvement of TGF-β1/SMAD signalling pathway in human renal proximal tubular epithelial (HK-2) cell line.
Materials and methods
Chemicals
The HK-2 was obtained from the American Type Culture Collection (Manassas, Virginia, USA), and keratinocyte serum free media, human recombinant epidermal growth factor 1-53 (EGF 1-53) and bovine pituitary extract were purchased from Invitrogen (Gibco, Gaithersburg, Maryland, USA); 1% Antibiotic-antimycotic solutions were purchased from Sigma-Aldrich (St Louis, Missouri, USA). Heptachlor, DMSO, 2′,7′-dichlorodihydrofluorescein diacetate (H2DCFDA), methanol and N-acetyl cysteine (NAC) were purchased from Sigma-Aldrich. Trizol, chloroform, isopropanol and ethanol were purchased from Hi-Media, Mumbai, India. Complementary DNA (c-DNA) kit was purchased from Thermo Scientific (California, Foster City, USA). Primary rabbit E-cadherin polyclonal antibody was purchased from Pierce (Vancouver, Washington, USA). Primary rabbit α-SMA polyclonal antibody, primary rabbit p-Smad2 polyclonal antibody, primary rabbit p-Smad3 polyclonal antibody and Alexa Fluor 488 conjugated anti-rabbit IgG were purchased from Abcam (Cambridge, Massachusetts, USA). Ethylenediaminetetraacetic acid (EDTA), O-phthalaldehyde, methanol, 49,69-diamidino-2-phenylindole dihydrochloride (DAPI), phosphate buffer saline (PBS), bovine serum albumin (BSA), trichloroacetic acid, thiobarbituric acid, nicotinamide adenine dinucleotide phosphate hydrogen (NADPH) and lucigenin were purchased from Sigma-Aldrich.
Cell culture and treatment
The HK-2 cells were maintained in keratinocyte serum free media, supplemented with prequalified EGF 1-53 and bovine pituitary extract (BPE) with 1% antibiotic-antimycotic solution. Cells were incubated at 37°C in a humidified atmosphere with 95% air and 5% carbon dioxide (CO2), adding growth media after confluence. For experiments, HK-2 cells were seeded and harvested in 96-well plate or 6-well culture plate or 24-h culture plate. Cells were allowed to adhere for 18 h in an incubator at 37°C in a humidified atmosphere with 95% air and 5% CO2. Immediately, prior to experimental treatment, the media was replaced with fresh media and cells were treated with various concentration of heptachlor, that is, 0.01, 0.1, 1, 2.5, 5 and 10 µM for 24 h. Cell viability assay using 3-(4,5-Dimethylthiazol-2-Yl)-2,5-Diphenyltetrazolium Bromide (MTT) showed (data not shown) the absence of significant toxicity up to 2.5 µM. On the basis of this observation and the concentrations range commonly used for in vitro studies in the previous literature, we have selected 2.5 µM of heptachlor for further experimentation. 10,20 Cells used in therapeutic studies were pretreated with NAC (10 mM) for 2 h, prior to incubation with heptachlor. The control cells were treated with pre-warm culture media. Thereafter, cells were harvested for experimental analysis.
ROS measurement assay
Intracellular ROS produced from HK-2 cells was detected by non-fluorescent cell permeating compound H2DCFDA according to Kim et al. 21 Briefly, the HK-2 cells were incubated with H2DCFDA (20 µM) for 45 min. Afterwards, cells were washed with PBS and pre-incubated with NAC (10 mM) following various doses of heptachlor (0.01–10 µM) for 24 h. Cells were subsequently washed with PBS and analysed in a multimode plate reader (Molecular Devices, Sunnyvale, California, USA) at an excitation wavelength of 485 nm and an emission wavelength of 530 nm.
GSH level determination
HK-2 cells (4.5 × 10⁴ cells per well) were seeded in a 96-well plate overnight, prior to the experimentation. The cultured HK-2 cells were treated with variable concentrations of heptachlor (0.01–10 µM) for 24 h and then washed with PBS followed by disrupting the cells in 200 µL of ice-cold distilled sterilized water containing 30 mM of EDTA. The suspension was centrifuged at 10,000 × g for 15 min. To the supernatant, freshly prepared glutathione-s-hydroxylase (GSH) assay reagent (16.6% of 0.1% O-phthalaldehyde in methanol and 83.4% of 0.1-M sodium phosphate buffer (pH 8.0)) was added at a ratio of 3:10. The mixtures were maintained in darkness at room temperature for 15 min, and then, the GSH–O-phthalaldehyde derivative was detected with fluorescence (excitation/emission: 350/420 nm) by a multimode plate reader (Molecular Devices).
Lipid peroxidation assay
Briefly, 2 × 10⁶ HK-2 cells/mL were seeded in a six-well plate and treated with different concentrations (0.01–10 µM) of heptachlor. Cells were incubated for 24 h in the humidified 5% CO2 incubator at 37°C. After the incubation period, cells were washed with PBS, collected in test tubes and pelleted down. The cell pellets were resuspended in 1 mL of 20% (w/v) trichloroacetic acid containing 0.8% (w/v) thiobarbituric acid and boiled for 45 min. After cooling to room temperature, 200-μL aliquot of the sample was assayed for malondialdehyde (MDA). The absorbance of the sample was monitored at 586 nm by a multimode plate reader (Molecular Devices), and the concentration of MDA was determined from a standard curve.
NADPH oxidase-4 assay
The NADPH oxidase-4 (NOX-4) activity after treating the HK-2 cells with varying doses (0.01–10 µM) of heptachlor was measured by the lucigenin enhanced chemiluminescence method using a multimode reader (Molecular Devices). Photon emission expressed as relative light units (RLU) was measured every 30 s for 5 min in a luminometer. A buffer blank was subtracted from each reading before calculation of the data. Superoxide production was expressed as the rate of RLU/min/mg protein. Protein concentration was determined with the Lowry method using BSA as a standard.
RNA extraction and real-time polymerase chain reaction
To observe the mRNA expression, HK-2 cells were grown in six-well culture plate and grown to confluence. Subsequently, cells were incubated with 2.5-µM heptachlor. After 24 h, cells were harvested for m-RNA expression analysis. Total RNA was extracted using TRIzol reagent and quantified using NanoDrop (Thermo-scientific, Foster City, California, USA) by measuring optical density value at 260/280 nm and concentration in ng/μL. For each sample, first-strand c-DNA was then synthesized from the total RNA by reverse transcription using c-DNA Reverse Transcription Kit (Fermentas, Massachusetts, Boston, USA). The c-DNA was then diluted with water at a ratio of 1:4, and aliquots were amplified using the Maxima SYBR Green quantitative polymerase chain reaction (PCR) Master Mix according to the instructions of the supplier (Thermo Fisher Scientific, Inc., Waltham, Massachusetts, USA). c-DNA and primers were added to the real-time Master Mix (Thermo Fisher Scientific, Inc.) to reach a final volume of 20 μL. PCR reactions were performed using the CFX ConnectTM Real-Time PCR Detection System (BioRad, San Diego, CA, USA). Glyceraldehyde 3-phosphate dehydrogenase (GAPDH) expression was used as an internal standard. Relative gene expression levels were calculated with the
Primers of the gene used for real-time PCR analysis.

PCR: polymerase chain reaction; TGF: transforming growth factor; α-SMA: α-smooth muscle actin; GAPDH: glyceraldehyde 3-phosphate dehydrogenase.
Cell morphology
Cells morphology was assessed by seeding the cells at a density of 5 × 10⁴ cells/well onto a six-well plate for 24 h. The cells were treated with 2.5-µM heptachlor for another 24 h. Cell morphology was investigated by phase contrast microscope using a JVC high-resolution digital camera attached to a Nikon Ti phase contrast microscope (Nikon, Japan).
Immunofluorescence assay
Immunofluorescence staining was performed to detect the expression of SMAD2, SMAD3, E-cadherin and α-SMA. Briefly, 2.5-µM heptachlor-treated and control HK-2 cells grown on coverslips in 24-well culture plates were fixed in 4% paraformaldehyde in PBS for 30 min at room temperature, followed by permeabilization with 0.1% TritonX-100 in PBS for 5 min. The cells were rinsed in PBS (pH 7.4) three times for 5 min. After blocking in 5% BSA and 1% TritonX-100/PBS for 30 min at room temperature, the cells on the coverslips were incubated with primary rabbit anti-human α-SMA polyclonal antibody (1:800), rabbit anti-human E-cadherin polyclonal antibody (1:2000), rabbit anti-human p-Smad2 (1:1500) and rabbit anti-human p-Smad3 (1:1500) for overnight at 4°C. After rinsing with PBS three times for 10 min, the cells were incubated with Alexa Fluor 488 conjugated anti-rabbit IgG (1:500; Molecular Probes, Eugene, Oregon, USA) for 30 min at room temperature. The nuclei were counterstained with DAPI. All of the images were semi-quantitatively analysed, and the slides were mounted and viewed using a Nikon fluorescent microscope (Nikon Eclipse Ni, Japan).
Statistical analysis
Statistical analysis was performed using standard statistical methods (SPSS software version 16.0). Data were expressed as the mean ± SEM. Comparisons between the groups were made by student’s t-test (two-tailed) or one-way analysis of variance with Tukey’s post hoc analysis depending on number of groups. For all statistical tests, p < 0.05 was considered as significant.
Results
Heptachlor-induced intracellular ROS generation
We assessed the levels of ROS generation following the exposure with increasing concentration of heptachlor using a non-fluorescent dye H2DCFDA. Heptachlor induced ROS generation significantly in a dose-dependent manner (Figure 1). However, the maximum 67% increase in fluorescence was observed at 2.5-µM heptachlor. Beyond 2.5-µM heptachlor, ROS generation becomes stagnant in HK-2 cells. Therefore, on the basis of ROS results and MTT assay (data not shown), we have selected 2.5 µM of heptachlor for further experimentation. 10,20
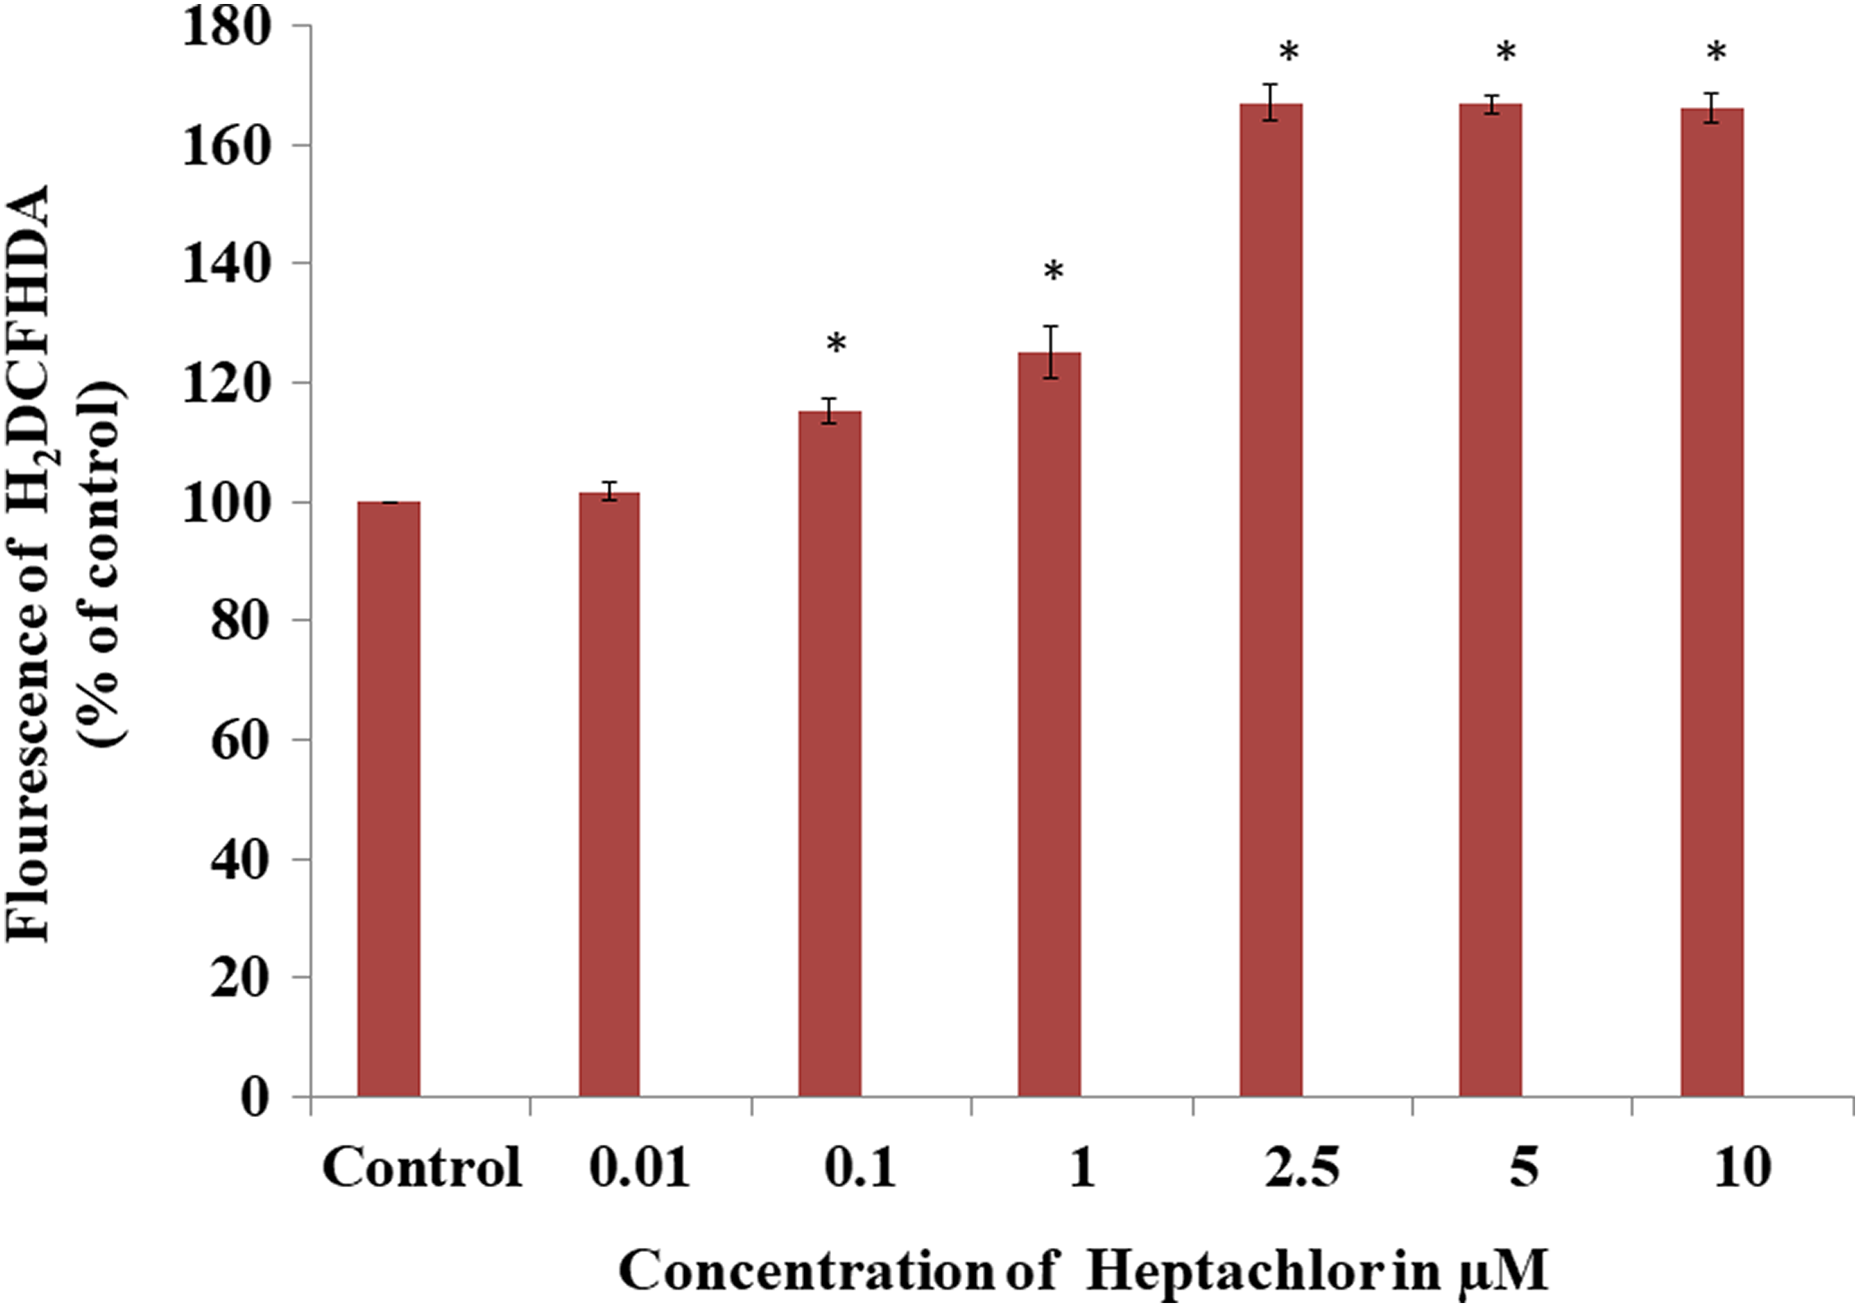
Intracellular ROS generation in heptachlor exposed HK-2 cells. HK-2 cells were treated with heptachlor (0.01–10 µM) for 24 h and then incubated with H2DCFDA for 30 min at 37°C and analysed by multimode reader. The data are expressed as the mean ± SEM of at least three independent experiments. *p < 0.05, statistically significant difference from control cells. ROS: reactive oxygen species; HK-2: human renal proximal tubular epithelial; H2DCFDA: 2′,7′-dichlorodihydrofluorescein diacetate.
Effect of heptachlor on lipid peroxidation in HK-2 cells
We investigated the lipid peroxidation in heptachlor-treated HK-2 cells by measuring the MDA level. After 24 h of incubation with increasing heptachlor concentrations, the MDA production in HK-2 cells increased significantly in a dose-dependent pattern (Figure 2). We found 28–49% increased MDA production at ≥ 2.5-µM heptachlor concentrations as compared to control in HK-2 cells.

Effect of heptachlor on MDA generation in HK-2 cells. Cells were exposed to varying doses (0.01–10 µM) of heptachlor, and MDA formation was measured as mentioned in “Materials and methods” section. The data are expressed as the mean ± SEM of at least three independent experiments. *p < 0.05, statistically significant difference from control cells. MDA: malondialdehyde; HK-2: human renal proximal tubular epithelial.
Effect of heptachlor on GSH level in HK-2 cells
To investigate the role of GSH in heptachlor-induced ROS, we have performed the GSH assay in heptachlor-induced HK-2 cells. Following treatment of HK-2 cells with an increasing concentration of heptachlor, GSH level declined significantly in a dose-dependent manner (Figure 3). The GSH level significantly declined to 29–42% of the control group at concentrations ≥ 1 μM of heptachlor exposed cells, suggesting that heptachlor may induce GSH depletion which contributes to ROS generation.

Dose-dependent effect of heptachlor on GSH in HK-2 cells. HK-2 cells were also subjected to the measurement of GSH after incubation with (0.01–10 µM) of the heptachlor as mentioned in “Materials and methods” section. The results are expressed as a percentage of control of at least three independent experiments. p < 0.05 is considered as significant and *significant versus controls. HK-2: human renal proximal tubular epithelial; GSH: glutathione-s-hydroxylase.
Effect of NAC on OS induced by heptachlor
In order to validate that the heptachlor induces OS in HK-2 cells, we pretreated the cells with a well-established antioxidant and intracellular ROS scavenger, NAC, and subsequently analysed the ROS generation, MDA production and GSH levels in the cells. NAC significantly inhibit heptachlor-induced ROS generation by up to 26% in HK-2 cells (Figure 4(a)). Also, NAC showed 16% inhibitory effect on heptachlor-induced MDA production (Figure 4(b)). Further, GSH content was significantly augmented by 20% in HK-2 cells pretreated with 10-mM NAC (Figure 4(c)).

The effect of 24-h pre-incubation with 10-mM NAC on (a) intracellular ROS generation, (b) MDA production and (c) GSH depletion in HK-2 cells treated with heptachlor for 24 h. All the data are expressed as mean ± SEM of at least three independent experiments. p < 0.05 is considered as significant, *significant versus controls and #significant versus heptachlor-exposed cells. NAC: N-acetyl cysteine; ROS: reactive oxygen species; MDA: malondialdehyde; HK-2: human renal proximal tubular epithelial; GSH: glutathione-s-hydroxylase.
Effect of heptachlor on NOX-4 activation
To evaluate the source of ROS in heptachlor-treated HK-2 cells, we measured the effect of heptachlor on NOX-4 activity. Heptachlor induced a significant increase in the rate of NOX-4 activity as assayed by the superoxide excitation of lucigenin using NADPH as substrate. At ≥ 2.5-µM heptachlor concentrations, the NOX-4 activity of HK-2 cells was increased by 44–69% with reference to control (Figure 5). These data suggest that NOX-4 may act as an important mediator of heptachlor-induced ROS generation.
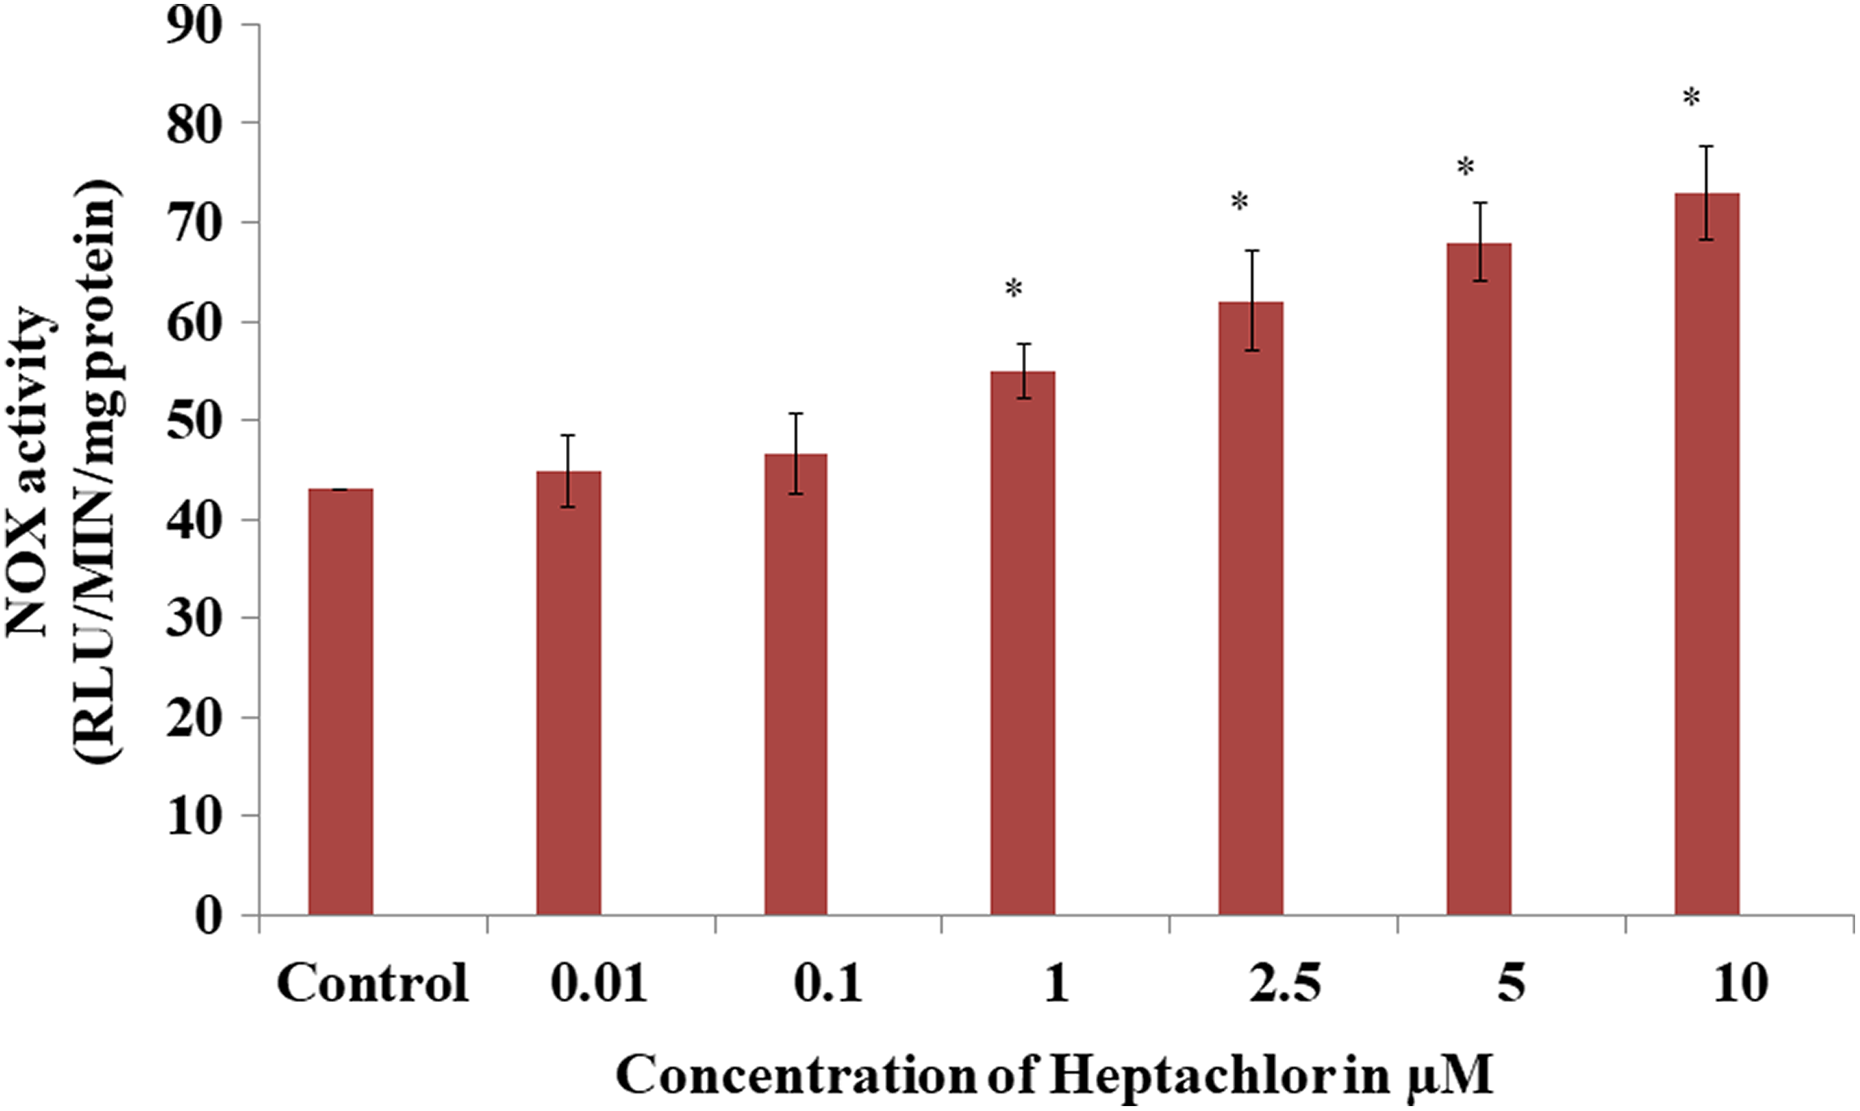
NOX activation induced by heptachlor in HK-2 cells. NOX activity was measured by lucigenin chemiluminescence assay with heptachlor (0.01–10 µM) exposure. The data are expressed as mean ± SEM of at least three independent experiments. p < 0.05 is considered as significant and *significant versus controls. NOX: NADPH oxidase; HK-2: human renal proximal tubular epithelial; NAPDH: nicotinamide adenine dinucleotide phosphate hydrogen.
Effects of heptachlor on endogenous TGF-β1 mRNA expression and activation of Smad2/3
In the present study, the endogenous m-RNA expression of TGF-β1, Smad2 and Smad3 in heptachlor-induced HK-2 cells was quantified using real-time PCR. Following 2.5-µM heptachlor treatment, TGF-β1 mRNA expression was increased significantly by 3.7-fold (Figure 6(a)). Furthermore, a significant increase was observed in Smad2 and Smad3 m-RNA level in heptachlor-induced HK-2 cells.

Heptachlor induced endogenous TGF-β1, Smad2 and Smad3 mRNA expression and Smad2/3 protein activation. (a) Real-time PCR analysis of endogenous TGF-β, Smad2 and Smad3 m-RNA expression after 24 h of 2.5-µM heptachlor treatment. (GAPDH was used as an internal control.) The data are expressed as the mean ± SEM of at least three independent experiments. p < 0.05 is considered as significant and *significant versus controls. (b) Immunofluorescence analysis of phospho-Smad family member; p-Smad2 and p-Smad3 expression at 24 h after heptachlor treatment. Representative images of p-Smad2 (a′) and (b′) expression and p-Smad3 (c′) and (d′) are shown (magnification – 40×). Nuclei (blue) are stained with DAPI. Images are representative of at least three independent experiments. TGF: transforming growth factor; PCR: polymerase chain reaction; GAPDH: glyceraldehyde 3-phosphate dehydrogenase; DAPI: 49,69-diamidino-2-phenylindole dihydrochloride; p-Smad3: phosphorylated Smad-2; p-Smad3: phosphorylated Smad-3.
The activation of Smad2 and Smad3 protein was also investigated by immunofluorescence (Figure 6(b)). In the immunofluorescence assay, higher p-Smad2 and p-Smad3 signalling was observed in heptachlor-induced HK-2 cells as compared to controls.
Effects of heptachlor on the morphology of HK-2 cells
The effects of heptachlor on HK-2 cell morphology were assessed at 24 h by phase contrast microscopy. In controls, HK-2 cells formed a confluent monolayer exhibiting classic epithelial cobblestone morphological characteristics. Individual cell displayed a polygonal shape with a high degree of attachment to neighbouring cells (Figure 7(a)). HK-2 cells exposed to 2.5 µM of heptachlor appeared significantly elongated and spindle-like morphology which is associated with fibroblast-like cells (Figure 7(b)).
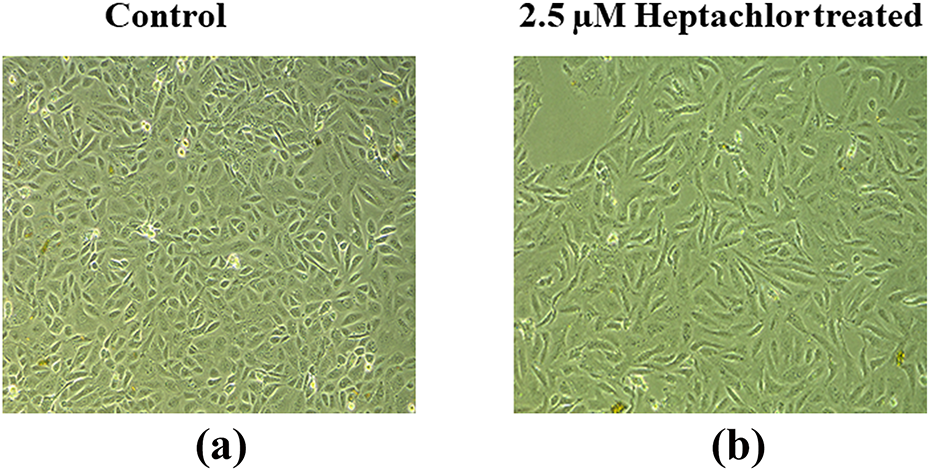
Effects of heptachlor on the morphology of HK-2 cells. Cellular morphology was assessed using phase contrast microscopy. Cells were treated with (a) control medium and (b) medium containing 2.5-µM heptachlor for 24 h (magnification – 20×). Images are representative of at least three independent experiments. HK-2: human renal proximal tubular epithelial.
Effect of heptachlor on EMT gene marker
To explore the effect of heptachlor in initiating EMT processes in HK-2 cells, we incubated the cells with 2.5-µM heptachlor for 24 h. The expression of the known marker of myofibroblast activation, that is, α-SMA and marker of epithelial junctional integrity, that is, E-cadherin was examined. We observed the significant increase of 2.3-fold in the m-RNA expression of α-SMA while E-cadherin m-RNA levels were significantly decreased to 0.39-fold (Figure 8(a)).
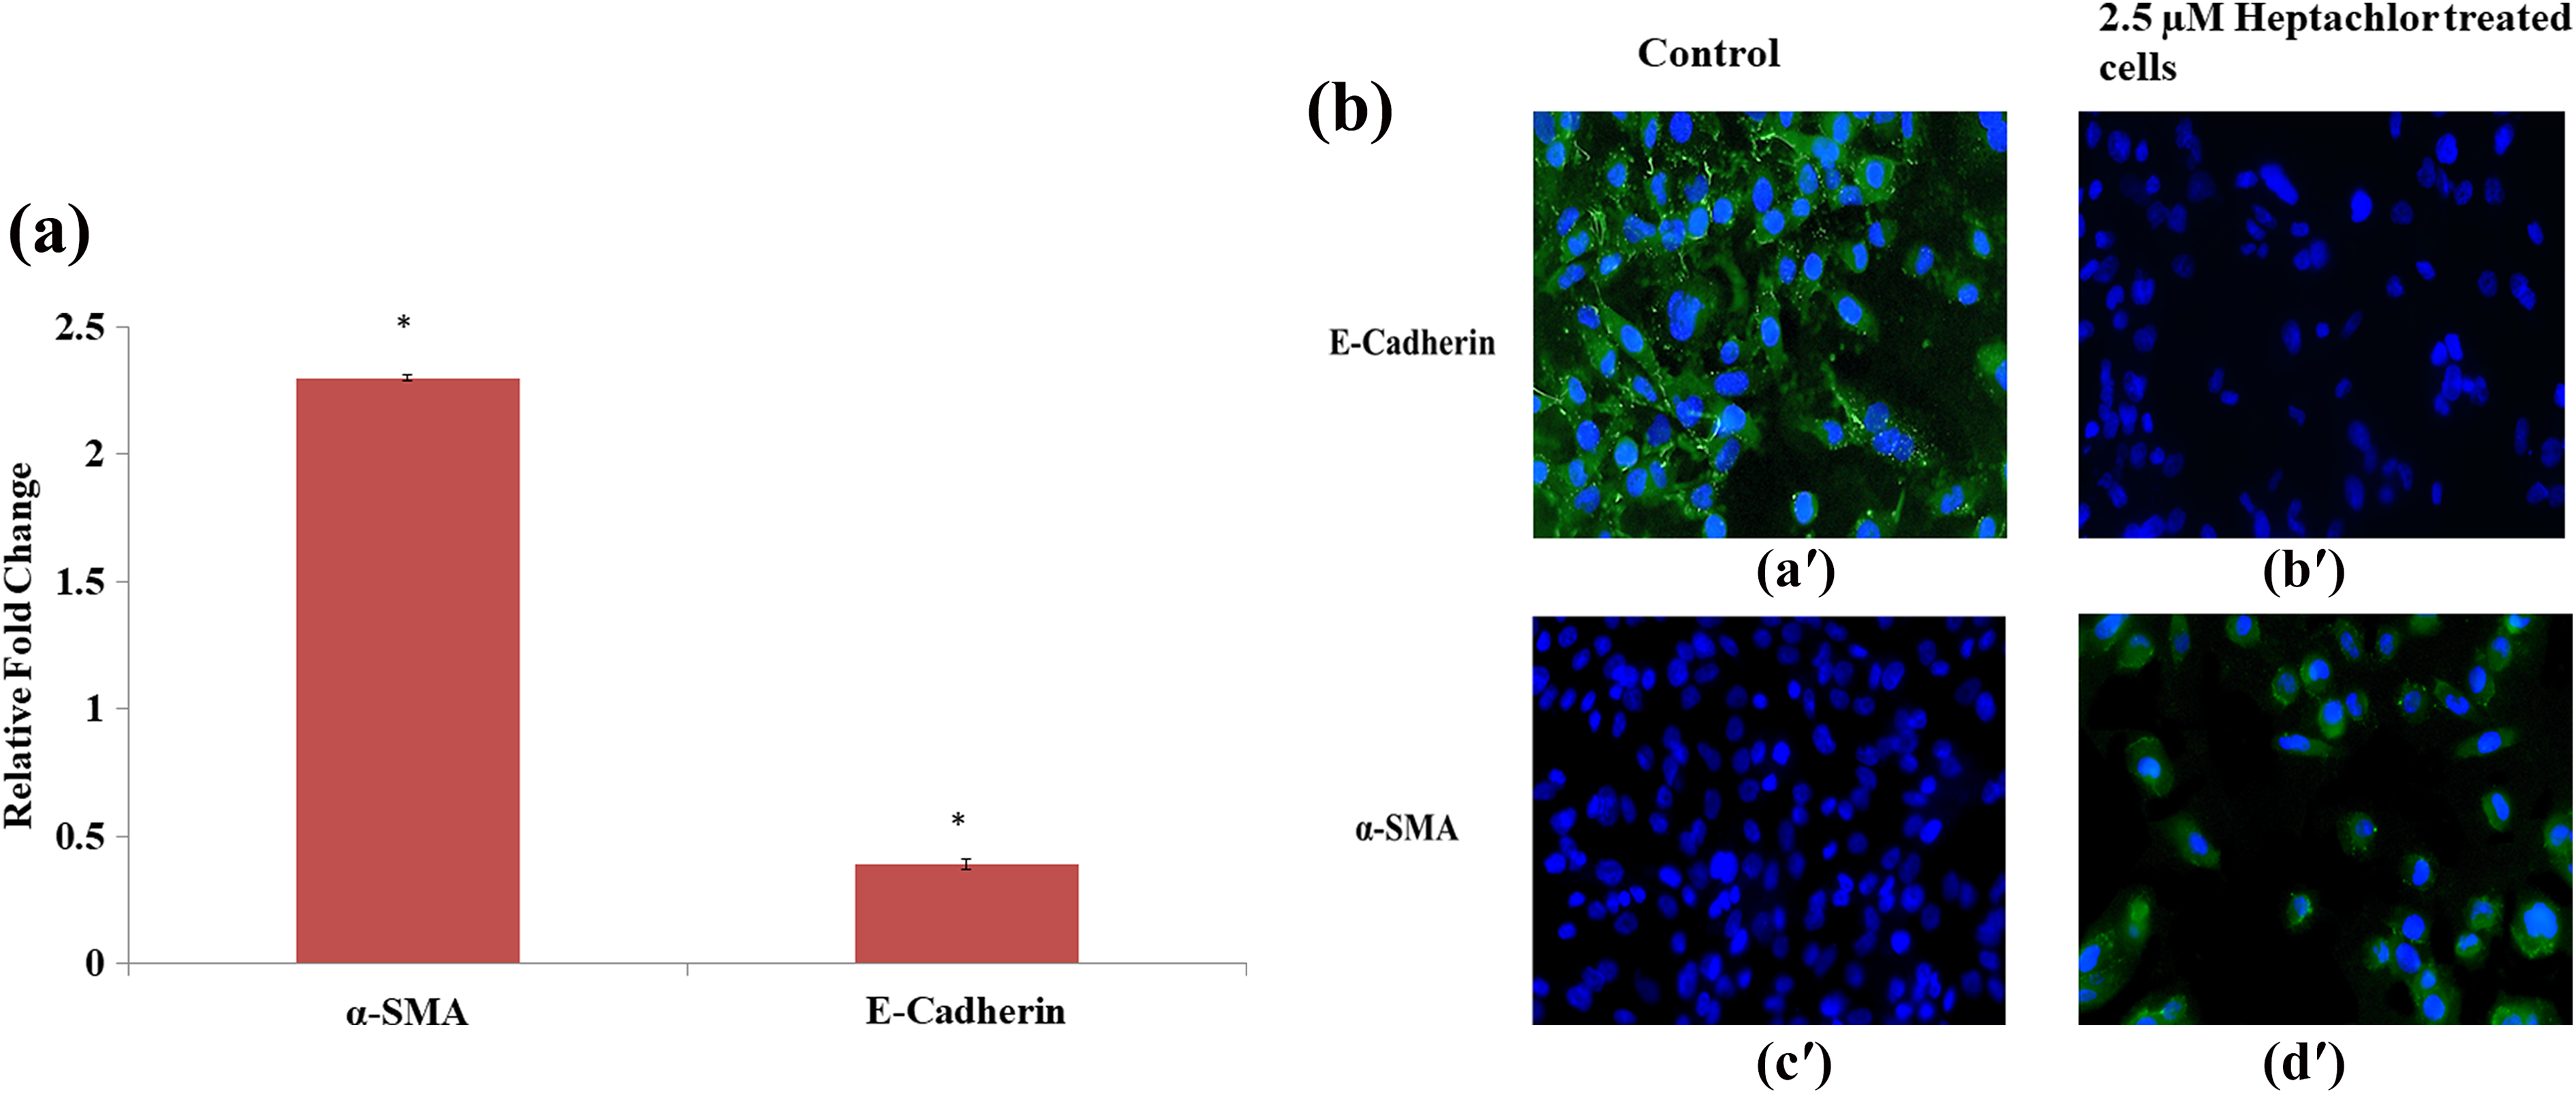
Effect of heptachlor on EMT gene marker. (a) HK-2 cells were treated with 2.5-µM heptachlor for 24 h. Relative fold change in the m-RNA expression of α-SMA and E-cadherin was analysed by real-time PCR (GAPDH was used as an internal control). The data are expressed as the mean ± SEM of at least three independent experiments. p < 0.05 is considered as significant and *significant versus controls. (b) Immunofluorescence analysis of E-cadherin (a′) and (b′) and α-SMA (c′) and (d′) expression at 24 h after heptachlor treatment. Representative images of E-cadherin and α-SMA (green) are shown (magnification – 40×). Nuclei (blue) are stained with DAPI. Images are representative of at least three independent experiments. EMT: epithelial to mesenchymal transition; HK-2: human renal proximal tubular epithelial; PCR: polymerase chain reaction; GAPDH: glyceraldehyde 3-phosphate dehydrogenase; DAPI: 49,69-diamidino-2-phenylindole dihydrochloride; α-SMA: α-smooth muscle actin.
Confirming the findings of m-RNA expression, a similar trend in protein expression of α-SMA and E-cadherin was observed with immunofluorescence. In HK-2 cells, 2.5-µM heptachlor enhanced the expression of α-SMA protein in comparison with control cells. In contrast, stimulation of HK-2 cells with heptachlor resulted in a remarkable loss of E-cadherin with respect to control cells (Figure 8(b)).
Discussion
Although the studies of heptachlor on kidney dysfunction are available, 9 the precise mechanism of heptachlor-induced nephrotoxicity is not properly understood. Several findings of in vitro and in vivo studies have indicated the involvement of OS in OCPs-mediated toxicity. 18,23 Thus, in the present study, we investigated the role of heptachlor in kidney dysfunction via ROS-mediated EMT and also to explore the involvement of TGF-β1/SMAD signalling pathway in HK-2 cells. To the best of our knowledge, this is the first study to explore the effect of heptachlor in kidney tubular epithelial cell line.
The findings of the current study showed a significant increase in ROS production in HK-2 cells following heptachlor exposure in a dose-dependent manner (Figure 1). Additionally, this study showed an enhanced lipid peroxidation as evidenced by a significant increase in MDA levels after the heptachlor exposure in HK-2 cells (Figure 2). Moreover, heptachlor-mediated GSH depletion in HK-2 cells implies that GSH depletion may be the major factor contributing to heptachlor-induced OS (Figure 3). Further, to reconfirm our findings, we pretreated the cells with NAC and subsequently analysed for ROS generation, MDA production and GSH levels. NAC is a well-established antioxidant and intracellular ROS scavenger and known to be cytoprotective against a variety of cellular damaging agents and its antioxidant activities have been established in several studies. 24,25 In the current study, we found that NAC significantly attenuated heptachlor-induced OS in HK-2 cells (Figure 4) implicating that NAC can be considered as an important therapeutic intervention against heptachlor-induced cytotoxicity in humans owing to its excellent scavenging capacity.
To evaluate the source of ROS in heptachlor-treated HK-2 cells, we measured the NOX-4 activity which seems to be primary renal oxidase and has been identified as a source for ROS in renal cells. 26 Our results revealed significant increased activity of NOX-4 in a dose-dependent manner in a heptachlor-stimulated HK-2 cells (Figure 5). Earlier, similar studies also reported that OCPs induced NOX activation in different cell line models. 27,28
Excessive OS has been shown to stimulate the expression of various cytokines, for example, TNF-α, TGF-β, IL-1β and IL-8. 29 Among these, TGF-β1 is considered as one of the strong contributors to fibrotic diseases. 30 TGF-β1 has been involved in the pathogenesis of renal fibrosis in experimental as well as human glomerulonephritis. It has been known to stimulate ECM deposition by speeding up the synthesis of ECM proteins on one side while impeding their degradation on the other. 31 Also, TGF-β1 has been known to initiate the activation of various factors responsible for altering the expressions of some genes and transcription factors involved in fibrosis. Hence, TGF-β1 is considered to be an important factor in the fibrosis. 32 In the present study, expression of endogenous TGF-β1 mRNA was found increased in heptachlor-stimulated HK-2 cells suggesting OS induced by heptachlor stimulated the m-RNA expression of TGF-β1 (Figure 6(a)). Our finding is in line with the previous report that showed the increased m-RNA expression of TGF-β1 after the hexachlorobenzene exposure in thyroid epithelial cells. 33 Recently, Miret et al. have also indicated that exposure to OCP significantly upregulated the m-RNA expression of TGF-β1 in MDA-MB-231 breast cancer cell line. 34 The binding of TGF-β1 to its receptor leads to the activation of Smad2/3, which is then phosphorylated and accumulated in the nucleus, and initiates the EMT process. 14,35,36 Our study has revealed that heptachlor exposure to HK-2 cells leads to the up-regulation of the m-RNA expression of both Smad2 and Smad3 (Figure 6(a)). Moreover, we also detected a significant increase in the nuclear localization of p-Smad2 and p-Smad3 in heptachlor-stimulated HK-2 cells as illustrated by immunofluorescence (Figure 6(b)). These findings indicated that heptachlor-induced OS enhanced the endogenous m-RNA expression of TGF-β1 followed by the activation of TGF-β1/Smad signalling.
Several lines of evidence indicated that TGF-β1/Smad signalling is accountable for EMT. 37,38 EMT encompasses various morphological changes such as lack of cell–cell attachment; spindle-shaped cell, which subsequently leads to the loss of the epithelial markers and the acquisition of a fibroblastic phenotype. 39 In this study, we observed marked alteration in the morphology of heptachlor-induced HK-2 cells. In particular, heptachlor-treated individual HK-2 cell exhibited starry-shape morphology in conjunction with refringent intercellular margins, suggesting that heptachlor treatment led to the cell detachment (Figure 7).
Our study has demonstrated the significant rise and decrease in the m-RNA expression of α-SMA and E-cadherin, respectively, in heptachlor-treated HK-2 cells (Figure 8(a)), consistent with the findings from Qi et al. 40 Furthermore, immunofluorescence staining has revealed the notably diminished protein expression of E-cadherin and increased protein expression of α-SMA in heptachlor-treated HK-2 cells (Figure 8(b)). Previously, a similar study has reported significant decrease in E-cadherin expression after heptachlor exposure along with the other OCPs in the primary cultured human hepatocytes. 41 The abovementioned findings as a whole indicated that heptachlor may have the potency of inducing EMT via TGF-β1 signalling in HK-2 cells.
In conclusion, the present study demonstrated that heptachlor-induced OS mediated by increased NOX-4 activity could be responsible for the activation of TGF-β1/Smad signalling pathway, which might lead to renal failure as a consequence of EMT and fibrosis. Our findings suggest that heptachlor may serve as a causal agent for renal dysfunction in vitro which may be responsible for heptachlor-mediated renal damage seen in vivo. However, further experimentations are required to gain better insight into the mechanism behind the role of heptachlor in causing renal dysfunction. From a clinical viewpoint, this may lead to effects concomitant with OCPs-induced renal damage as our outcomes revealed that low level exposure to organochlorinated pesticides such as heptachlor caused cell toxicity culminating in renal dysfunction via fibrosis. Exploration of the mechanism involved in heptachlor-induced renal damage may lead to the development of the novel therapeutic strategy for the treatment of renal fibrosis and provide further insight into the mechanism of action of heptachlor in the human kidney.
Footnotes
Declaration of Conflicting Interests
The author(s) declared no potential conflicts of interest with respect to the research, authorship, and/or publication of this article.
Funding
The author(s) disclosed receipt of the following financial support for the research, authorship, and/or publication of this article: This work was supported by the Department of Science and Technology (DST-SERB), India (ref. no. SR/SO/HS/0021/2012); and the University Grant Commission, India, by providing the Senior research fellowship (reference no. 17-06/2012(i)EU-V) to NS and Postdoctoral fellowship to MS (PDFWM-2015-17-DEL-38642).