
Abstract
Water contamination with metals due to anthropogenic activity is increasing and subsequent exposure increases the risk of associated toxicity. Exposure is not limited to a single metal but usually involves mixtures of different metals at different concentrations. Little is known about the contribution of this type of exposure, in humans, to the development of non-communicable diseases such as cardiovascular disease, and an increased risk to thrombosis. The World Health Organization has established limits for metal levels in drinking water and this includes levels for copper (Cu), manganese (Mn) and mercury (Hg). In this study, at 100X these limits, the ability of the metals’ oxidative effects as catalysts of the Fenton reaction and/or ability to bind glutathione (GSH) were determined. The haemostatic effects of these metals, alone and in combination, at the World Health Organization limit were then evaluated. The ultrastructural and viscoelastic alterations of exposed ex vivo whole blood were also evaluated using scanning electron microscopy and thromboelastography® (TEG), respectively. Cu, alone and in combination with Mn and/or Hg, induced hydroxyl radical formation and reduced GSH levels. Ex vivo exposure caused deformation of erythrocytes and accelerated platelet activation especially for Cu, alone and in combination, with Mn. Reduction in the lysis potential of the clot was also observed for all combinations, especially Cu in combination with Hg as well as Mn alone. Although the TEG findings were not statistically significant, the trends indicate that the exposure to these metals, alone and in combination, adversely affects thrombus formation in ex vivo blood, thereby potentially increasing the risk in exposed individuals for thrombosis.
Introduction
Increased anthropogenic activities have led to an increase in the release of various wastes, including heavy metals, into the environment. 1 South Africa is in the top five largest coal producers in the world and coal contains a number of elements, including copper (Cu), mercury (Hg) and manganese (Mn). 2 –4 Exposure to these heavy metals may have an adverse effect on the health of a population and includes not only individuals in the workplace but also those indirectly exposed through air and water contamination. Bioaccumulation in plant and animal tissue further increases the risk of exposure. 5 Exposure is not limited to South Africa but also affects other communities where coal production is high such as China, India, Australia and the United States. 6
Metal ions can cause oxidative damage by acting as catalysts of the Fenton reaction with the formation of reactive oxygen species (ROS) and/or by reducing the levels of antioxidant elements such as glutathione (GSH) either by direct binding or inhibiting activity of the enzymes involved in the antioxidant pathways. 7 Metals, such as Cu and Mn, are needed in micro-amounts for normal physiological and biochemical processes; however, high levels of these metals are toxic and, therefore, uptake is tightly regulated by transporter proteins. 8 Both Cu and Mn undergo redox cycling and in excess can form ROS, which leads to cellular and tissue damage. Mn accumulates in the mitochondria, where the oxidative phosphorylation pathway is disrupted and cellular death occurs. 9 Other metals, such as Hg, that are non-essential pose a human health risk even at small doses. Hg is a non-redox metal that depletes mainly thiol-containing antioxidants and enzymes, such as GSH and binds to sulfhydryl groups on proteins. 10,11
The worldwide increase in stroke and other cardiovascular diseases (CVDs) especially in specific communities is of concern. Oxidative stress has been identified as a contributing factor to the disruption of blood haemostasis, thereby contributing to the development of CVD by adversely altering blood haemostasis and blood vessel integrity resulting in thrombosis. 12,13 Thrombosis, which involves the interaction of platelets and erythrocytes together with fibrin fibres, can occur when blood flow decreases, blood vessel walls sustain injury, or when there is an imbalance between procoagulant and anticoagulant factors. 14,15 Metal exposure can alter the process of clot formation and composition via oxidative and/or direct effects on the coagulation pathway.
The World Health Organization (WHO) has established limits for exposure to Cu, Mn and Hg which are 2 mg/L, 0.5 mg/L and 1 μg/L, respectively. 16 Lji et al. reported that acid mine water from the Highveld region of South Africa contained, in addition to other metals, 0.03 mg/L Cu, 39 mg/L Mn and < 5 µg/L Hg, which induced oxidative damage in the fish gill, liver and kidney cell lines. 17 The cellular and tissue effects of each metal, usually alone but increasingly as part of mixtures, have been researched using animal models. 18,19 Although these studies provide valuable information on specific tissue and cellular targets, the information on the effects on human tissue are limited.
Increasingly, the relevance of the metal concentrations used is being queried and alternative strategies have been to use the Environmental Quality Standard (EQS) levels and the dosages found in contaminated products. 20,21 In a recent study, the effects of cadmium (Cd), chromium (Cr) and Hg at 1000×, the WHO limits in Sprague–Dawley rats, were evaluated. At these concentrations, blood markers of tissue damage were not increased, but extensive tissue and cellular damage occurred, which included damage to blood vessels and altered blood haemostasis and indicates that exposure to these metals may lead to the development of CVD in humans. 18,19
The aim of this study was to determine the oxidative potential of Cu, Mn and Hg as well as the effect of these metals at the WHO safety limit on the ultrastructure and viscoelastic properties of blood using an ex vivo blood model.
Methods
Metal preparations
The concentrations of the various metals were based on the WHO safety levels for each respective metal in water, which are 2 mg/L Cu (31.47 µM Cu (II) sulphate; Sigma-Aldrich, St Louis, Missouri, USA), 0.5 mg/L Mn (9.1 µM Mn (II) chloride; Sigma-Aldrich) and 1 µg/L Hg (0.004 µM mercuric (II) chloride; Sigma-Aldrich). 16 For the metal combinations, the final concentrations were 31.47, 9.1 and 0.004 µM for Cu, Mn and Hg, respectively.
Hydroxyl radical formation
A modification of the method described by Ou et al. was used, to determine the ability of each metal, alone or in combination, to catalyse the Fenton reaction. 22 A 6.77 μM fluorescein stock solution was prepared in 50 mL phosphate buffered saline (PBS). A 10 µL volume of the stock solution was added to 10 mL PBS, from which a 1% working solution was prepared. A 20 µL volume of 100 × solutions of each metal and metal mixtures were added to separate wells in a 96-well plate. To each well, 100 µL of the fluorescein working solution was added. The plate was then placed in a fluorometer/spectrophotometer (BMG Labtech, Offenburg, Germany), and the fluorescence was measured at an excitation wavelength of 485 nm and emission at 520 nm, for 5 min at 37°C (FlBlank). Then, the plate was removed and 20 µL of a 6% hydrogen peroxide solution was added to each well. After 30 min, fluorescence was measured (FlSample). Using the equation, [FlBlank − (FlSample)/FlBlank] × 100, the % fluorescence loss was calculated.
A 1mM cobalt (II) chloride solution shown to catalyse the Fenton reaction by Ou et al. was used as an experimental control. 22
GSH binding
Quantification of reduced GSH levels with Ellman’s reagent was determined. To wells of a 96-well plate, 20 µL of a 1 mM solution of GSH was added followed by 20 µL of a 100× concentration of each metal and metal combinations. The samples were mixed well and after 5 min, 100 µL of a 3 mM Ellman’s reagent was added and then the absorbance was measured at 405 nm using a fluorometer/spectrophotometer (BMG Labtech). Data were expressed as micromolar GSH remaining following the addition of the metals, alone and in combination.
Blood collection
Approximately, 16 mL of venous blood was drawn in four citrate tubes from three healthy, human, male volunteers by a trained phlebotomist (Research Ethics Committee, ethical clearance number: 244/2016), using a sterile needle and EVAC citrate tubes containing 3.2% sodium citrate. Informed consent was obtained from each participant. The whole blood was used on the day of extraction. The inclusion criteria of the volunteers were healthy, male individuals over the age of 18 years, non-smokers, not taking any chronic medication and no known inflammation. Volunteers, who smoke, suffer from any inflammatory conditions or those who use chronic medication were excluded from the study.
Scanning electron microscopy
Whole blood was exposed to the different metals, alone and in combinations, and then incubated for 30 min at room temperature. Blood smears (whole blood only) were made on 10 mm round glass cover slips (LASEC, South Africa), with and without human thrombin (20 U/mL). The cover slips were then dried for 10 min and washed in PBS for 20 min. The samples were then fixed in a 2.5% glutaraldehyde (GA)/formaldehyde (FA; Sigma-Aldrich; 5 mL buffer solution, 1 mL GA, 1 mL FA and 3 mL distilled water – solution in 0.075 M phosphate buffer (pH 7.4)) for 30 min and then washed three times in PBS. The samples then underwent secondary fixation in 1% osmium tetroxide (Sigma-Aldrich) for 30 min and were washed again as explained in the previous step. The samples were then dehydrated using an increasing serial dehydration step with 30, 50, 70 and 90% ethanol (EtOH), followed by three changes of absolute EtOH. The 100% EtOH (Merck, Darmstadt, Germany) was removed and 100% hexamethyldisilazane (HMDS) (Merck) was then added for 30 min for drying. Approximately, two drops of HMDS were then placed on the cover slips and the samples were left to dry overnight. Once the samples were dry, the cover slips were then mounted on aluminium stubs, coated with carbon and viewed with a Zeiss Ultra Plus FEG SEM (Carl Zeiss Microscopy, Munich, Germany).
Thromboelastography®
Whole blood was exposed to the different metal groups, alone and in combinations, and then incubated for 30 min at room temperature. Two samples were run in the two channels of the thromboelastography (TEG) (TEG 5000 computer-controlled device; Haemoscope Corp., Niles, Illinois, USA), simultaneously. A volume of 340 µL of whole blood was added to the oscillating cup of the TEG and 20 µL of calcium chloride was added to the sample in order to start the coagulation process. The process was run until maximum amplitude (MA) was reached. The results are presented in Table 1 that gives various measurements of the parameters.
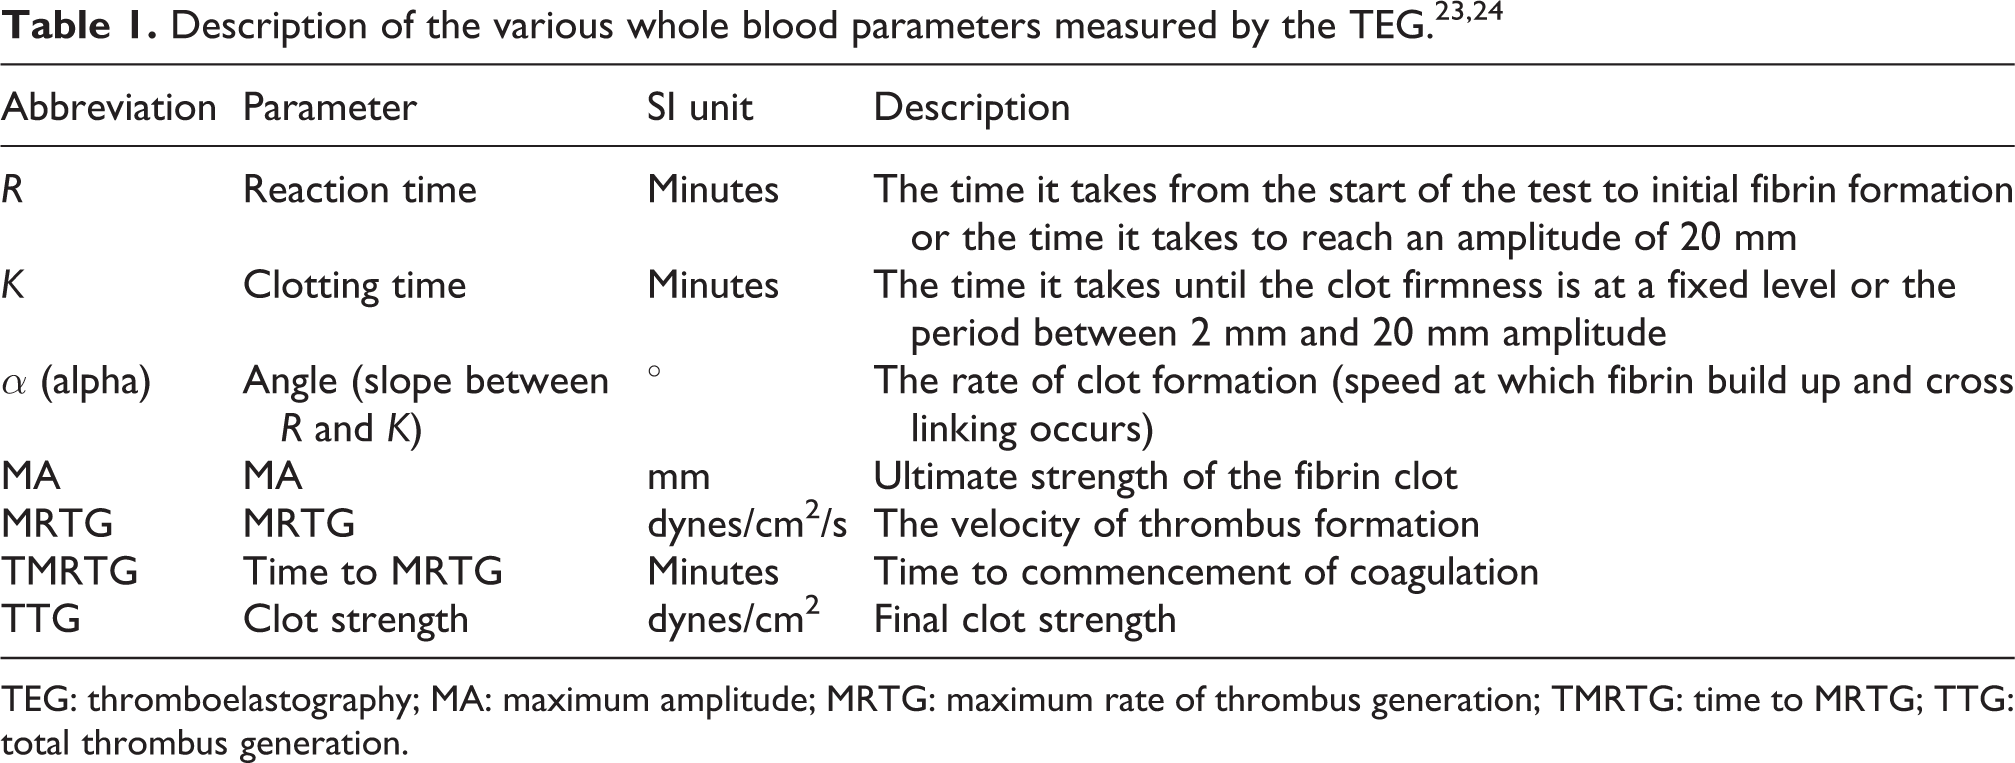
TEG: thromboelastography; MA: maximum amplitude; MRTG: maximum rate of thrombus generation; TMRTG: time to MRTG; TTG: total thrombus generation.
Statistical analysis
All quantitative experiments (radical formation (HORAC assay) and GSH binding) were done in triplicate and repeated three times, yielding nine data points. Differences between the metals and each metal and their mixtures, compared to the respective controls, were determined using the t-test and one-way analysis of variance. Post hoc analysis was further evaluated using Tukey’s analysis, where a p value of < 0.05 was considered significant. Statistical analysis of TEG parameters was performed on GraphPad Prism Version 6.01 using the Mann–Whitney U test, where a p value of < 0.05 was considered to be significant.
Results
Oxidative damage and GSH binding
ROS formation via the Fenton reaction causes the decay of fluorescein. In the original method of Ou et al., cobalt (Co) was used as a catalyst. 22 Likewise, the ability of each metal and metal combinations to catalyse the Fenton reaction was evaluated.
Compared to control (1 mM Co), Hg was the metal least able to catalyse the Fenton reaction (p < 0.0001) followed by the Mn + Hg combination (p = 0.01). Cu compared to Cu-containing groups all showed Fenton catalysing ability even higher than the control, Cu + Mn with a 18% increase, Cu + Hg with a 9% increase and Cu, Mn + Hg with a 16% increase. Mn compared to the Mn-containing groups had catalysing activity with the Cu + Mn (p = 0.0007) and Cu, Mn + Hg (p = 0.0014) groups but not for the Mn + Hg group. Hg’s catalysing effect was only significant when in combination, as seen in Cu + Hg (p < 0.0001) and Cu, Mn + Hg (p < 0.0001; Figure 1).

Ability of 1 mM Co (control) and each metal, alone and in combinations, at 100 × the WHO safety limit, to catalyse the Fenton reaction. Data is an average of three independent experiments expressed as the mean ± SEM. Differences between control and all groups are denoted with an *, differences between Mn and Mn groups are denoted with a # and differences between Hg and Hg groups are denoted with a +. WHO: World Health Organization; SEM: standard error of mean; Mn: manganese; Hg: mercury; Cu: copper; Co: cobalt.
With regard to the metals’ ability to bind GSH, Cu, Cu + Mn, Cu + Hg and Cu, Mn + Hg caused the most significant reduction in the measured GSH levels (p < 0.0001), indicating strong GSH binding. Mn showed weak GSH binding (p < 0.01), whereas Hg and Mn + Hg did not show reductions in GSH levels, indicating that Mn and Hg do not bind to GSH (Figure 2).

The ability of each metal, alone and in combinations, at 100 × the WHO limit of each metal to bind GSH. Data is an average of three independent experiments expressed at the mean ± SEM. Differences between control and all groups are denoted with an *, differences between Cu and Cu groups are denoted with ⁁, differences between Mn and Mn groups are denoted with a # and differences between Hg and Hg groups are denoted with a +. WHO: World Health Organization; GSH: glutathione; SEM: standard error of mean; Mn: manganese; Hg: mercury; Cu: copper.
Scanning electron microscopy
Figure 3 shows erythrocyte micrographs acquired from blood smears prepared from whole blood without thrombin. Figure 3(a) presents the erythrocyte control group exposed to isotonic PBS (isoPBS) and shows normal morphology of an erythrocyte which is a typical biconcave shape with a smooth membrane. Figure 3(b) to (h) shows erythrocytes exposed to the various metals. Overall all the experimental groups caused erythrocyte membrane deformity seen in the bulging and swollen appearance. A summary of the findings on erythrocyte morphology is shown in Table 2.

Scanning electron micrographs of whole blood without thrombin exposed to Cu, Mn and Hg, alone and in combination, showing erythrocyte morphology; Scale bars
Summary of morphological changes of erythrocytes exposed to each metal alone and in combination.
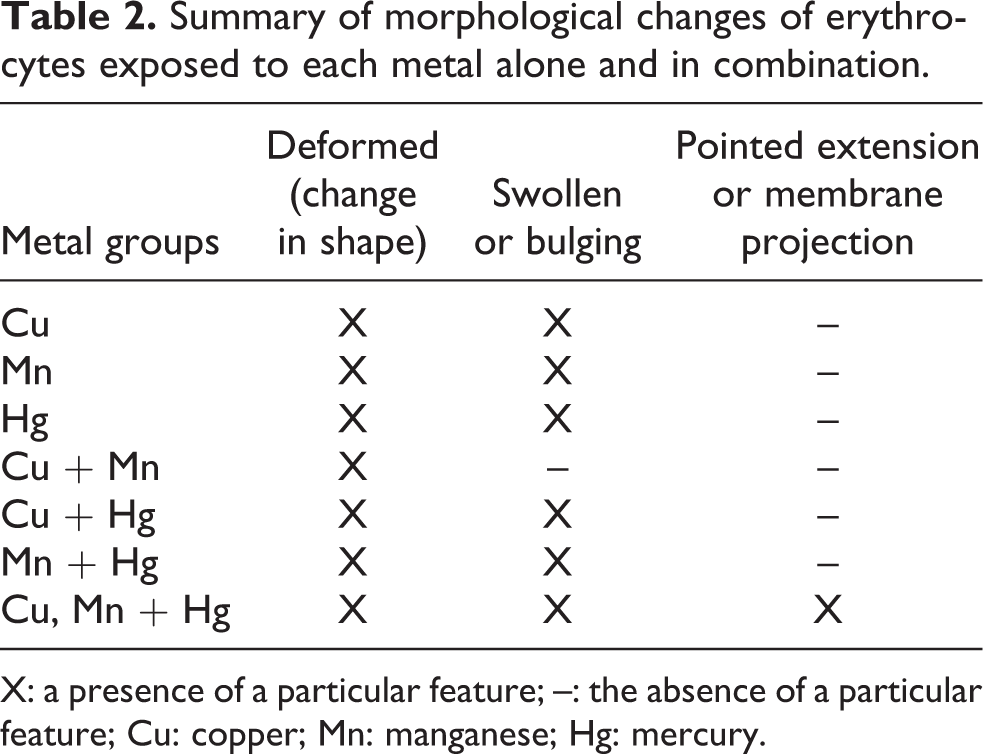
X: a presence of a particular feature; –: the absence of a particular feature; Cu: copper; Mn: manganese; Hg: mercury.
Figure 4 shows representative micrographs of platelets acquired from whole blood smears prepared without thrombin. Figure 4(a) presents the platelet control group (isoPBS) and shows normal morphology of a spherical platelet with some pseudopodia. The open canalicular system of the platelet can also be seen (thick grey arrows). Figure 4(b) to (h) shows platelets exposed to the WHO safety level concentrations, of the metals Cu, Mn and Hg, alone and in combinations. Overall, all the metals induced platelet activation through an increase in platelet pseudopodia (thick white arrows) – (b) to (g), an increase in platelet spreading (thin white arrows) – (b), (f) and (h), an increase in platelet interaction (thin grey arrows) – (b), (d), (e) and (g) and an increase in platelet aggregation (dashed white arrows) – (g). A summary of the findings on platelet morphology is shown in Table 3.

Scanning electron micrographs of whole blood without thrombin exposed to Cu, Mn and Hg, alone and in combinations, showing platelet morphology; Scale bars = 2 µm. (a) Control, (b) Cu, (c) Mn, (d) Hg, (e) Cu + Mn, (f) Cu + Hg, (g) Hg + Mn and (h) Cu, Mn + Hg. Dashed white arrows: platelet aggregates; thick grey arrows: OCS; thin grey arrows: platelet interaction; thick white arrows: pseudopodia; and thin white arrows: platelet spreading. Cu: copper; Mn: manganese; Hg: mercury; OCS: open canalicular system.
Summary of morphological changes of platelets exposed to each metal alone and in combination.

X: a presence of a particular feature; –: the absence of a particular feature; Cu: copper; Mn: manganese; Hg: mercury.
Figure 5 shows fibrin network images acquired from whole blood smears prepared with the addition of thrombin. Figure 5(a) shows the control group (isoPBS) with very few thin (thin white arrows) and thick (thick white arrows) fibres being formed around the erythrocytes. Figure 5(b) to (h) shows whole blood with thrombin where all the experimental groups showed some alterations in the fibrin networks formations, which include an increase in less taut fibrin fibres (thin light grey arrows) and less organized, that tend to wrap around deformed erythrocytes (thick light grey arrows), with some groups showing formations of thin fibre net-like coverings (thin black arrows) – (c) and (f), areas of fused fibrin fibres (thick dark grey arrows) – (c), (d) and (f), thick fibre sticky masses (thick black arrows) – (c), (f) and (g). A summary of the findings on whole blood with thrombin is shown in Table 4.

Scanning electron micrographs of whole blood with thrombin exposed to Cu, Mn and Hg, alone and in combinations, showing fibrin network formation together with erythrocytes; Scale bars = 2 µm. (a) Control, (b) Cu, (c) Mn, (d) Hg, (e) Cu + Mn, (f) Cu + Hg, (g) Hg + Mn and (h) Cu, Mn + Hg. Thin black arrows: net-like covering of thin fibres; thick black arrows: sticky mass of fibrin fibres; thick dark grey arrows: fused fibrin fibre areas; thin light grey arrows: bending, less taut fibres; thick light grey arrows: deformed erythrocytes; thin white arrows: thin minor fibres and thick white arrows: thick major fibres. Cu: copper; Mn: manganese; Hg: mercury.
Summary of morphological changes for whole blood with added thrombin exposed to each metal alone and in combination.

X: a presence of a particular feature; –: the absence of a particular feature; Cu: copper; Mn: manganese; Hg: mercury.
Thromboelastography
Figure 6 shows various TEG tracings which demonstrate all the blood parameters in numerical and graphical form. Figure 6(a) and (b) shows all the representative tracings for each metal group and the control (blue). All the metal groups at this concentration show a potential to increase the coagulability of the whole blood, as they vary from the control’s tracing. Cu and Mn + Hg showed the greatest variation in waveform compared to the control. The various waveforms depicted are representative of the following whole blood parameters: R, K, α and MA.

The graphical waveform representation of various TEG tracings. (a) Representative tracings of the single metal groups versus the control. (b) Representative tracings of the combination metal groups versus the control. Standard parameters used for TEG are indicated on the control tracing. R: reaction time; K: clotting time; α: angle; MA: maximum amplitude; TEG: thromboelastography.
A summary of the control and metal exposed group’s viscoelastic profiles after exposure to Cu, Mn and Hg, alone and in combinations, is presented in Table 5. Statistical analyses on each experimental group versus the control, for each parameter with the Mann–Whitney U test, revealed no significance (p < 0.05). Although no significant difference was seen in any of the experimental groups, certain trends were evident in Table 5. All the metal groups, except Hg and Cu, Mn + Hg show a decrease in R (min) as compared to the control. Cu alone had the lowest R value compared to the other metal groups. For the Mn + Hg combination, lower values were also found when compared to Mn and Hg alone.
Summary of the effects of Cu, Mn and Hg, alone and in combinations, on the various parameters of whole blood.a

SD: standard deviation; Cu: copper; Mn: manganese; Hg: mercury; MA: maximum amplitude; MRTG: maximum rate of thrombus generation; TMRTG: time to MRTG.
a p Value of ≤0.05 is statistical significance.
All the metal groups showed a decrease in K (min) as compared to the control and the lowest values were measured for Cu alone and Mn + Hg. An increase in α angle (°) was observed for Cu and to a lesser degree for all other metal combinations except Mn and Cu + Hg where the increase was minimal. All the metal groups show an increase in MA (mm) compared to the control. The maximum rate of thrombus generation (MRTG) of all groups was increased compared to the control especially for Cu and Mn + Hg. For Time to MRTG (TMRTG; min), values were reduced for Cu but slightly increased for Cu + Hg and Cu, Mn + Hg. All the metal groups showed an increase in total thrombus generation (TTG; dynes/cm2/s) as compared to the control with the highest values observed for Mn + Hg and Cu, Mn + Hg.
Discussion
Metals, as part of mixtures of metals or in combination with other contaminants, have been identified as environmental toxins. Bioaccumulation in aquatic products such as fish is also of concern, especially if fish is an important component of traditional diets. Kenston et al. evaluated the effects of a single dosage of an eight-metal mixture consisting of zinc (Zn), Cu, Mn, Cr, nickel (Ni), Cd, lead (Pb) and Hg in rats. The levels of each metal were based on the estimated levels found in aquatic products. Findings of this study were that these metals, caused haematological abnormalities, altered kidney and liver function and altered electrolyte balance. 25 Lebrun et al. evaluated the behavioural and biochemical effects of Cd, Cu, Ni, Pb and Zn alone and in mixtures on Gammarus fossarum at 1× and 2×, the EQS concentrations, that is, 5 µg/L Cd, 2.8 µg/L Cu, 8.0 µg/L Ni, 2.4 µg/L Pb and 15.6 µg/L Zn. Bioaccumulation occurred at 1× EQS, while toxic effects were observed at 2× EQS. Metal toxicity was Cd > Pb > Zn > Cu > Ni and Cu caused a decrease in respiratory activity, moulting and inhibited the activity of β-glucosidase, β-galactosidase and chitobiase. Antagonistic interactions were observed at the highest concentration for the metal mixture. 20 Agrawal et al. identified that the triple combination of arsenic, Pb and Hg resulted in increased oxidative stress in the blood, liver and kidneys and changes in brain biogenic amines in Wistar rats exposed for 6 months to the metals, alone or in combinations at 15 ppm. 26 These studies identify the toxicity of metal combinations; however, information on human toxicity is lacking.
To address this limitation, the aim of the present study was to further evaluate the toxicity of Cu, Mn and Hg in a physiologically relevant human ex vivo blood model. The relevance of using an ex vivo blood model is that in previous studies, it was found that metals such as Cd, Cr and Hg compromise rat blood vessel wall integrity, rat blood haemostasis and human blood haemostasis, which indicate that these effects can increase the risk for thrombosis and CVDs. 18,19 In a novel approach, in this study, heavy metal concentrations based on the WHO limit for drinking water were evaluated. These levels are physiologically relevant and results can provide information on the robustness of established limits, that is, levels should be reduced. Although the WHO limits were used, the relevance of these levels related to systemic exposure may be questioned. Normal blood Cu, Mn and Hg levels in males are 1.048 ± 0.02 mg/L, 4–15 µg/L and < 10 µg/L, respectively, and therefore exposure of blood to 2 mg/L Cu represents relevant blood levels. 27 –29 Mn levels used in the present study are 33 times higher than normal levels but still represent the levels of 0.615–1.840 mg/L measured in infants, receiving long-term parental nutrition. 28,30 Whole blood levels of Hg are usually lower than 10 µg/L, although the levels of 20 µg/L are still considered as normal and exposure of blood to 1 µg/L is also relevant. 29
In this study, the ability of Cu, Mn and Hg, alone and in combination, to act as catalysts of the Fenton reaction and to deplete GSH levels by binding to the cysteine residues of GSH was evaluated. Concentrations at 100×, the WHO safety limits for drinking water, were selected based on the detection limit of the methods used. Cu and, to a lesser degree, Mn catalysed the Fenton reaction. All combinations containing Cu effectively catalysed this reaction. Cu and Cu-containing combinations bound to the GSH, thus reducing GSH levels. This study confirms the findings of Hansen et al., where Cu was reported to cause GSH oxidation, while Hg had no effect; therefore, at the concentrations evaluated, Cu had the greatest oxidative potential. 31
The effect of each metal, alone and in combination, on erythrocytes and platelets ultrastructure was evaluated. No calcium (Ca2+) or thrombin was added, and consequently observed morphological effects are the consequence of direct exposure to these metals. In the erythrocytes, Cu would cause ROS formation and depletion of GSH subsequently that will result in the inability of the antioxidant pathways to scavenge ROS. Erythrocytes do not contain mitochondria and so Mn cannot cause disruption in the phosphorylation pathway. Thus, Mn affects erythrocytes through other unidentified mechanisms and these could include the inhibition of the antioxidant enzymes and possible membrane effects which should be further investigated. The effect of Hg on erythrocyte structure is not the result of ROS formation or GSH binding and depletion as shown in the present study but rather due to the bivalent mercuric cations having a high affinity for the proteins or the anionic heads, containing phosphate and glycerol, of the phospholipids of the erythrocyte membrane. 32 The binding of the mercuric ions to membrane proteins, such as aquaporin-1, can disrupt carbon dioxide transport. 33 In addition, the binding of the mercuric ions to the phospholipid groups on the outer and inner layers of the erythrocyte plasma membrane disrupts the membrane’s structural integrity. 34 For the metal combinations, the effect of Cu + Mn was reduced where only deformed erythrocytes were observed, compared with Cu, Mn + Hg where the erythrocytes were deformed, with bulging and abnormal membrane morphology. These observed effects were not due to increased metal concentration but rather due to the interactions between these metals.
Platelets contain GSH, and the ability of Cu to form ROS via the Fenton reaction and to bind GSH may be responsible for the observed platelet activation and associated pseudopodia formation and spreading. 35 Mn can disrupt platelet mitochondrial oxidative phosphorylation resulting in ROS formation, which can cause activation and associated pseudopodia formation. However, at the concentrations evaluated, Hg did not induce ROS and bind GSH, but did cause platelet activation. Mn, Hg, Cu + Mn and Mn + Hg favoured increased pseudopodia formation, while Cu, Cu + Hg and Cu, Mn + Hg caused increased platelet spreading which may be a function of concentration and/or metal targeting such as inhibition or activation of platelet associated pathways and/or factors. Alternative mechanisms such as effects on clotting enzymes and factors should be considered including an increase in factor VIII, platelet factor IV and thrombin and a decrease in protein C and prostaglandin E. 36 Interestingly, Mn and Cu in combination showed the absence of spreading and only the presence of pseudopodia. This implies that Mn as observed for the erythrocytes may alter the toxicity of Cu. The mechanism involved should be further researched.
Mn increased the formation of fibrin networks with net-like coverings of minor thin fibres as well as masses of thick and fused fibres, indicating that Mn may accelerate the clotting process, thereby increasing the risk for thrombosis. 36 However, together with Cu and as part of the Cu, Mn + Hg mixture, this effect is reduced. Both Cu and Hg exposure resulted in less taut fibrin formation, although fused areas were also observed for Hg. In addition to the effects of individual metals, the presence of a net-like covering of minor thin fibres, masses of thick fibres and fused areas was found, which indicates that Cu and Hg together increase the risk for thrombosis. The actual biochemical targets of these metals are unknown and will be the focus of future research.
For TEG, no statistical significant difference was found when comparing the experimental groups to the control group. However, several trends were observed and may indicate the possible risk for thrombosis. A decrease in the R value suggests an increase in the levels of initiator coagulation factors which potentially results in a hypercoagulable state of blood and potentially an increased risk for thrombosis as was observed for Cu alone and Mn + Hg. 23 The amplification (K value) and propagation (α angle) of the clot development are determined more by fibrinogen levels, which increase with increased thrombin levels, and to a lesser degree by platelet activation. 23,37 Cu and Mn + Hg had lower K values compared to the control and thus a delayed clot formation which implies an increase in thrombin and fibrinogen levels and platelet functioning. 23 For Cu and to a lesser degree for Hg, Cu + Mn, Mn + Hg and Cu, Mn + Hg, the α values were increased as compared to the control. These results correlate well with the fibrin formation (net-like coverings and sticky masses formed), observed following the addition of thrombin to whole blood (Figure 5).
The clot strength (MA) is determined mainly by platelet functioning (80%) and slightly by fibrin involvement (20%). 38 All the experimental groups showed an increase in MA (mm), compared to the control. An increase in clot strength can represent a hypercoagulable state. 23 The increase in MA for all the experimental groups correlates with the scanning electron micrographs (Figure 4), showing a form of platelet activation for all groups and an increase in fibres, as compared to the control. The speed of clot formation (MRTG) is related to K and α. 39 All the experimental groups showed an increase in MRTG (dynes/cm2/s), especially for Cu and Mn + Hg, compared to the control. An increased MRTG favours clot propagation and thus thrombosis. For TMRTG (min), values were reduced for Cu but slightly increased for Cu + Hg and Cu, Mn + Hg. Recent studies have shown a correlation between TMRTG and thrombin/anti-thrombin levels where a decrease in TMRTG represents a hypercoagulable state, while an increase indicates a reduce ability to coagulate. 40,41 All the metal groups showed an increase in TTG (dynes/cm2/s) as compared to the control. The final clot strength (TTG) is related to MA but is the better measurement as it takes into account both platelet and enzymatic roles in clot formation. 40,42,43 All the experimental groups showed an increase in TTG (dynes/cm2/s) and levels were the highest for Mn + Hg as well as Cu, Mn + Hg compared to the control, and this corresponds with the overall increase in MA by all the experimental groups.
In conclusion, Cu alone and in combination with Mn and Hg induces hydroxyl radical formation and binds GSH, indicating the ability of both metals to induce oxidative damage. Although the TEG findings were not statistically significant, the trends indicate that the exposure to the metals especially Cu and Mn +Hg adversely affects thrombus formation, increasing the risk for CVD. This study shows that WHO limits of Cu, Mn and Hg in water can adversely affect human blood haemostasis and that oxidative stress is only partially responsible for these effects.
Footnotes
Acknowledgements
The authors would like to thank the National Research Foundation and staff of the Department of Physiology of the University of Pretoria, specifically Dr C Grobbelaar and Dr P Soma with their assistance with the phlebotomy. The authors also thank all the volunteers who generously donated blood required for this study.
Declaration of Conflicting Interests
The author(s) declared no potential conflicts of interest with respect to the research, authorship, and/or publication of this article.
Funding
The author(s) disclosed receipt of the following financial support for the research, authorship, and/or publication of this article: This work was supported by the National Research Foundation under grant number 92768.