
Abstract
Methomyl toxicity has been reported as a cause of several accidental and suicidal fatalities. The study is evaluating the effect of lethal methomyl toxicity on fortilin and S100A1 in serum and cardiac tissues. Adult 96 female Sprague-Dawley rats were divided equally into a control (euthanized by cervical dislocation) and a study group (overdosed with methomyl). The levels of fortilin and S100A1 in serum were measured antemortem (to establish the basal levels in serum) and postmortem (to evaluate changes after methomyl exposure) using enzyme-linked immunoassay. S100A1 was immunostained in sections from cardiac tissues. Both proteins in the control were not significantly different (p > 0.05) compared with the antemortem levels. On the contrast, both biomarkers levels in the intoxicated group were remarkably higher (p < 0.001) than the control and the antemortem levels. Ventricular tissues from the intoxicated rats presented depleted S100A1 immunostain in cardiomyocytes localized mainly in the epicardium with deeply stained adjacent cardiac fibroblasts. The cardiomyocytes were damaged with a prominent loss of striations compared to normal cardiac tissues from the control. The present outcomes explain to a certain degree the potential toxic effect of methomyl poisoning on the cardiac tissue. Both proteins could be added to the currently available battery of markers for assessing methomyl toxicity.
Introduction
Methomyl (Lannate), N-[[(methylamino)carbonyl]oxy]ethanimidothioate, is a widely used insecticide in agriculture, 1 and the residue tolerance in food crops is 0.1–6.0 ppm. 2 Methomyl is classified by the United States Environmental Protection Agency (US EPA) as highly toxic to humans via oral exposures, moderately toxic via inhalation, and slightly toxic via dermal exposure. 3 There are several reported cases of methomyl toxicity in humans, with major cholinergic signs (i.e. SLUDGE/BBB: Salivation, Lacrimation, Urination, Defecation, Gastrointestinal symptoms, Emesis/Bronchorrhea, Bronchospasm, Bradycardia). 4 In fact, autopsy reports of methomyl intoxication incidents in humans have recorded blood methomyl concentrations of 0.85–1.59 µg g−1, making this substance a frequent cause of death that could be encountered at pathological laboratories. 5 –8 The effect of methomyl toxicity on the cardiac tissue has yet to be elucidated using two biomarkers, fortilin as an apoptosis biomarker, and S100A1 as a cardiac biomarker.
The wide distribution of the protein fortilin, predominantly, in the nucleus with its high sequence conservation among species is suggesting its potential crucial role in essential cellular functions. 9 Since it can be secreted extracellular by exosomes in an endoplasmic reticulum/Golgi-independent pathway, the hydrophilic 172-amino acid protein (∼22 kDa) 10 was found in the normal circulation of human and mouse. 9,11 Extracellular release of fortilin (i.e. via exosomes and apoptotic bodies) occurs during the very early stage of autolysis, even before the disruption of the cellular membrane. 9 It has been reported as the most robust and sensitive apoptosis protein compared to the previously reported proteins (e.g. nucleosomal DNA and cytochrome c) that reflect the degree and extent of cellular damage. 9 The protein is also known as a transitionally controlled tumor protein (TCTP) which is elevated in cancer patients after chemotherapy or radiotherapy. 9 The abovementioned characters have inspired the current study to investigate the alterations of this protein in serum before and after exposure to a lethal methomyl overdose.
The family of S100 protein has been considered as an endogenous alarm that is released from necrotic cells with an active dual role in tissue inflammation and regeneration. 12 The member S100A1 with a low molecular weight (approximately 10.5 kDa) is the highest abundant isoform in the cardiac muscles, preferentially in the ventricular cardiomyocytes, and is a ubiquitous nonhistone nuclear protein that acts in transcriptional control. 12 The dimeric calcium binding protein is rapidly released from necrotic cells into the interstitial space, specially the damaged cardiomayocytes, causing high levels in serum. 12 It is known that cardiac death is considered as an individual end point, thus measuring this cardiac protein would explain the severity of methomyl effects on this vital organ.
In total, the present study is revealing the effect of lethal methomyl intoxication on the levels of both markers in serum and on the distribution of S100A1 in the cardiac tissue. The outcomes of this work would contribute to further understanding of the role of methomyl in the injury of the heart. Furthermore, these proteins could be a part of a biomarkers battery for identification and evaluation of methomyl toxicity.
Materials and methods
Animal conditions
A total of 96 female Sprague-Dawley rats (aged 5 months; weighing 170–190 g) were housed in the Animal Care Unit at the Jordan University of Science and Technology. On a regular basis, the general health conditions of the rats were checked by an assigned veterinarian. The animals were kept 1 week for acclimatization in stainless steel wire cages, with three rats per cage (L × W × H = 37 × 22 × 25 cm3). The cages were placed in a room at 22 ± 2°C, 15% humidity, and 12-h light:12-h dark conditions (lights on at 7:00 pm). The animals had free access to tap water and a standard chow diet. The bedding was hardwood chips. All experimentations on animals were compiled with the National Guide for the Animal Care and Use of Laboratory Animals, provided by the Animal Care and Use Committee (ACUC) at the Jordan University of Science and Technology (approval no. 107/3/3/16).
Experimental design
Rats were distributed randomly into two groups (n = 48): the control (euthanized by cervical dislocation) group and the methomyl-intoxicated group. Cervical dislocation was performed according to Waynforth and Flecknell by rapidly and forcefully retracting the base of the tail at a 30° angle, while the head was immobilized with the thumb and the index finger. 13 The animal died instantaneously. Methomyl intoxication was accomplished according to Kaplan and Sherman by oral gavage of 1.5 ml of 20 mg kg−1 methomyl 2 (Sigma-Aldrich, St Louis, Missouri, USA). The median lethal oral dose (LD50) of methomyl in rats is 17–24 mg kg−1. 3 Death occurred within 1–4 min. Generally, death was confirmed by the last gasp. All experiments were conducted between 9:00 am and 3:00 pm.
Blood sampling of 1 ml (n = 12 randomly selected rats per group) was performed antemortem via the femoral vein to establish the basal level for both proteins. Postmortem blood sampling (n = 48 per group) was performed via cardiac puncture to ensure that the collected samples would contain fortilin and S100A1 released mainly from the surrounding cardiac tissue. Then, the samples were immediately centrifuged at 2000 × g for 10 min to collect the serum and stored at −80°C for later enzyme-linked immunosorbent assay (ELISA). After blood sampling, whole hearts were collected in 10% neutral-buffered formalin (Sigma-Aldrich) for later immunohistology.
Measuring fortilin concentration using immunoassay
Fortilin concentration was measured in the serum samples using a sandwich ELISA developed by Sinthujaroen et al. with minor modifications. 9 A polystyrene 96-well plate (no. 32296, SPL life Science, Korea) was coated with 50 μl of 2 μg ml−1 capture anti-fortilin antibody (no. H00007178-M03, Abnova, Taiwan), which was prepared in 1× phosphate-buffered saline (PBS), and incubated at 4°C overnight. The wells were washed three times with a washing buffer (PBS with 0.1% Tween 20) and then were blocked with 100 μl of blocking buffer (PBS with 1% bovine serum albumin (BSA)) for 1 h at room temperature. Afterward, the wells were washed three times with the washing buffer. A total of 100 μl of the 1:10 diluted serum samples were added in duplicates to the corresponding wells and incubated at 37°C for 3 h. Recombinant mouse TCTP protein (ab202247, Abcam, Burlingame, California, USA) was used as the protein standard for construction of the standard curve: 0, 3.905, 7.81, 15.62, 31.25, 62.5, 125, 250, 500, and 1000 ng ml−1. The wells were washed three times with a washing buffer (PBS with 0.1% Tween 20). Biotinylated anti-fortilin detection antibody (no. H00007178-M06, Abnova, Taiwan) was diluted to 1 µg ml−1 in a dilution buffer (PBS with 0.1% BSA), then added as 100 μl per well. The plate was incubated 2 h at 37°C. Then, the wells were washed three times with the washing buffer. Avidin–horseradish peroxidase (HRP; no. 18-4100-51, eBioscience, San Diego, California, USA) was diluted to 1:500 in the dilution buffer and then added as 100 μl per well. Again, the wells were washed three times with the washing buffer. To detect bound antibodies, 100 μl of Strep™ Ultra TMBELISA (no. 34028, Thermo Fisher Scientific, Waltham, Massachusetts, USA) were added per well. The plate was incubated at room temperature for 30 min. Then, 50 μl of 2-M sulfuric acid were added to stop the reaction. Finally, the optical density of each well was measured by an ELISA reader (ELx800, BioTek, Winooski, Vermont, USA) at a wavelength of 450 nm. The sensitivity limit of the assay was 0.8 ng ml−1. To minimize the risk of bias, measuring fortilin and data recording were performed by a blinded laboratory technician.
Measuring S100A1 concentration using immunoassay
The S100A1 protein concentration was measured using a modified sandwich ELISA according to the method of Rohde et al. 12 A polystyrene 96-well plate (no. 32296, SPL life Science, Korea) was coated with 100 µl of anti-S100A1 rabbit polyclonal (ab11428, Abcam) diluted in 1× PBS to 2 µg ml−1 and incubated overnight at 4°C. After 24 h, the wells were washed three times with a washing buffer (PBS with 0.1% Tween 20) and they were blocked with 300 μl of a blocking buffer (PBS with 1% BSA) for 1 h at room temperature. Thereafter, the wells were washed three times with the washing buffer. Then, 100 μl of the 1:10 diluted plasma samples were added in duplicates to the corresponding wells and incubated at 4°C overnight. To create the standard curve, the following concentrations of the standard recombinant mouse S100A1 protein (ab108117, Abcam) were prepared: 0, 1.952, 3.905, 7.81, 15.62, 31.25, 62.5, and 125 ng l−1. After 24 h, the wells were washed three times, and then, 100-µl anti-S100A1 polyclonal sheep immunoglobulin G (IgG; no. AF4476, R&D System, Minneapolis, Minnesota, USA) was diluted to 1:5000 in a dilution buffer (PBS with 0.1% BSA). Then, 100 µl of the antibodies were added per well and incubated for 3 h at room temperature. The wells were washed three times and 100 µl of donkey anti-sheep IgG HRP (no. ab97125, Abcam) diluted to 1:10,000 in 1× PBS were added per well. The plate was incubated for 2 h at room temperature. Then, the wells were washed three times and 100 μl of Strep™ Ultra TMBELISA (no. 34028, Thermo Fisher Scientific) was added to each well to detect the bound antibody. The plate was incubated at room temperature for 30 min. Subsequently, 50 μl of 2-M sulfuric acid was added per well to stop the reaction. Finally, the optical density of each well was measured by the ELISA reader (ELx800, BioTek) at a wavelength of 450 nm and corrected at a wavelength of 570 nm (as a reference wavelength to minimize well imperfections, optical density (OD) = OD450 − OD570). The sensitivity limit of the assay was 1.6 ng l−1.
Immunohistochemical staining for S100A1
Immunohistochemical (IHC) staining for S100A1 was performed according to Bi et al. 14 using the two-step IHC Detection Reagent (ZSGB-BIO, China). Following cross sectioning the cardiac ventricular tissue into 5-µm thickness, the sections were treated for 5 min with microwave antigen retrieval using 0.1-M citrate buffer solution at pH 6.0; then, the sections were treated for 30 min with 0.3% hydrogen peroxide in methanol to inhibit endogenous peroxide activity. To minimize nonspecific staining, 10% goat serum (Boster, Pleasanton, California, USA) was added to the sections for 30 min at room temperature. Then, polyclonal rabbit anti-S100A1 (ab11428, Abcam) was diluted to 1:600 and added to the sections for an overnight incubation at 4°C. PBS was used to replace S100A1 antibody as the negative staining control. For labeling the bound protein, goat anti-rabbit IgG HRP (ab7090, Abcam) was added to sections and incubated for 30 min at 37°C. Subsequently, the sections were rinsed with PBS to end the reaction. Finally, the sections were dehydrated, mounted with aqueous-based medium (ab128982, Abcam), and examined under the digital light microscope B-290 TB (Optika®, Italy).
Statistical analysis
The concentration of fortilin and S100A1 was expressed as mean ± standard deviation. Data were analyzed using package “Rcmdr” within the statistical software R version 3.4.2 (R Development Core Team, 2017). 15,16 Using one-way analysis of variance with Tukey contrasts for specific comparisons of means, the average levels were compared between the groups. Shapiro–Wilk normality test was used to test normality. The value of p < 0.05 was considered significant.
Results
The ELISA results for the control and the methomyl-intoxicated group are presented in Figure 1, fortilin (Figure 1(a)) and S100A1 (Figure 1(b)). The average antemortem serum fortilin was 22.96 ± 15.77 ng ml−1 (Figure 1(a)). Compared to antemortem levels, the average fortilin concentration for the control group insignificantly increased (p > 0.05) to 26.96 ± 13.14 ng ml−1, while for the methomyl-treated group remarkably peaked (p < 0.001) to approximately26.2 folds to 602.30 ± 225.45 ng ml−1.
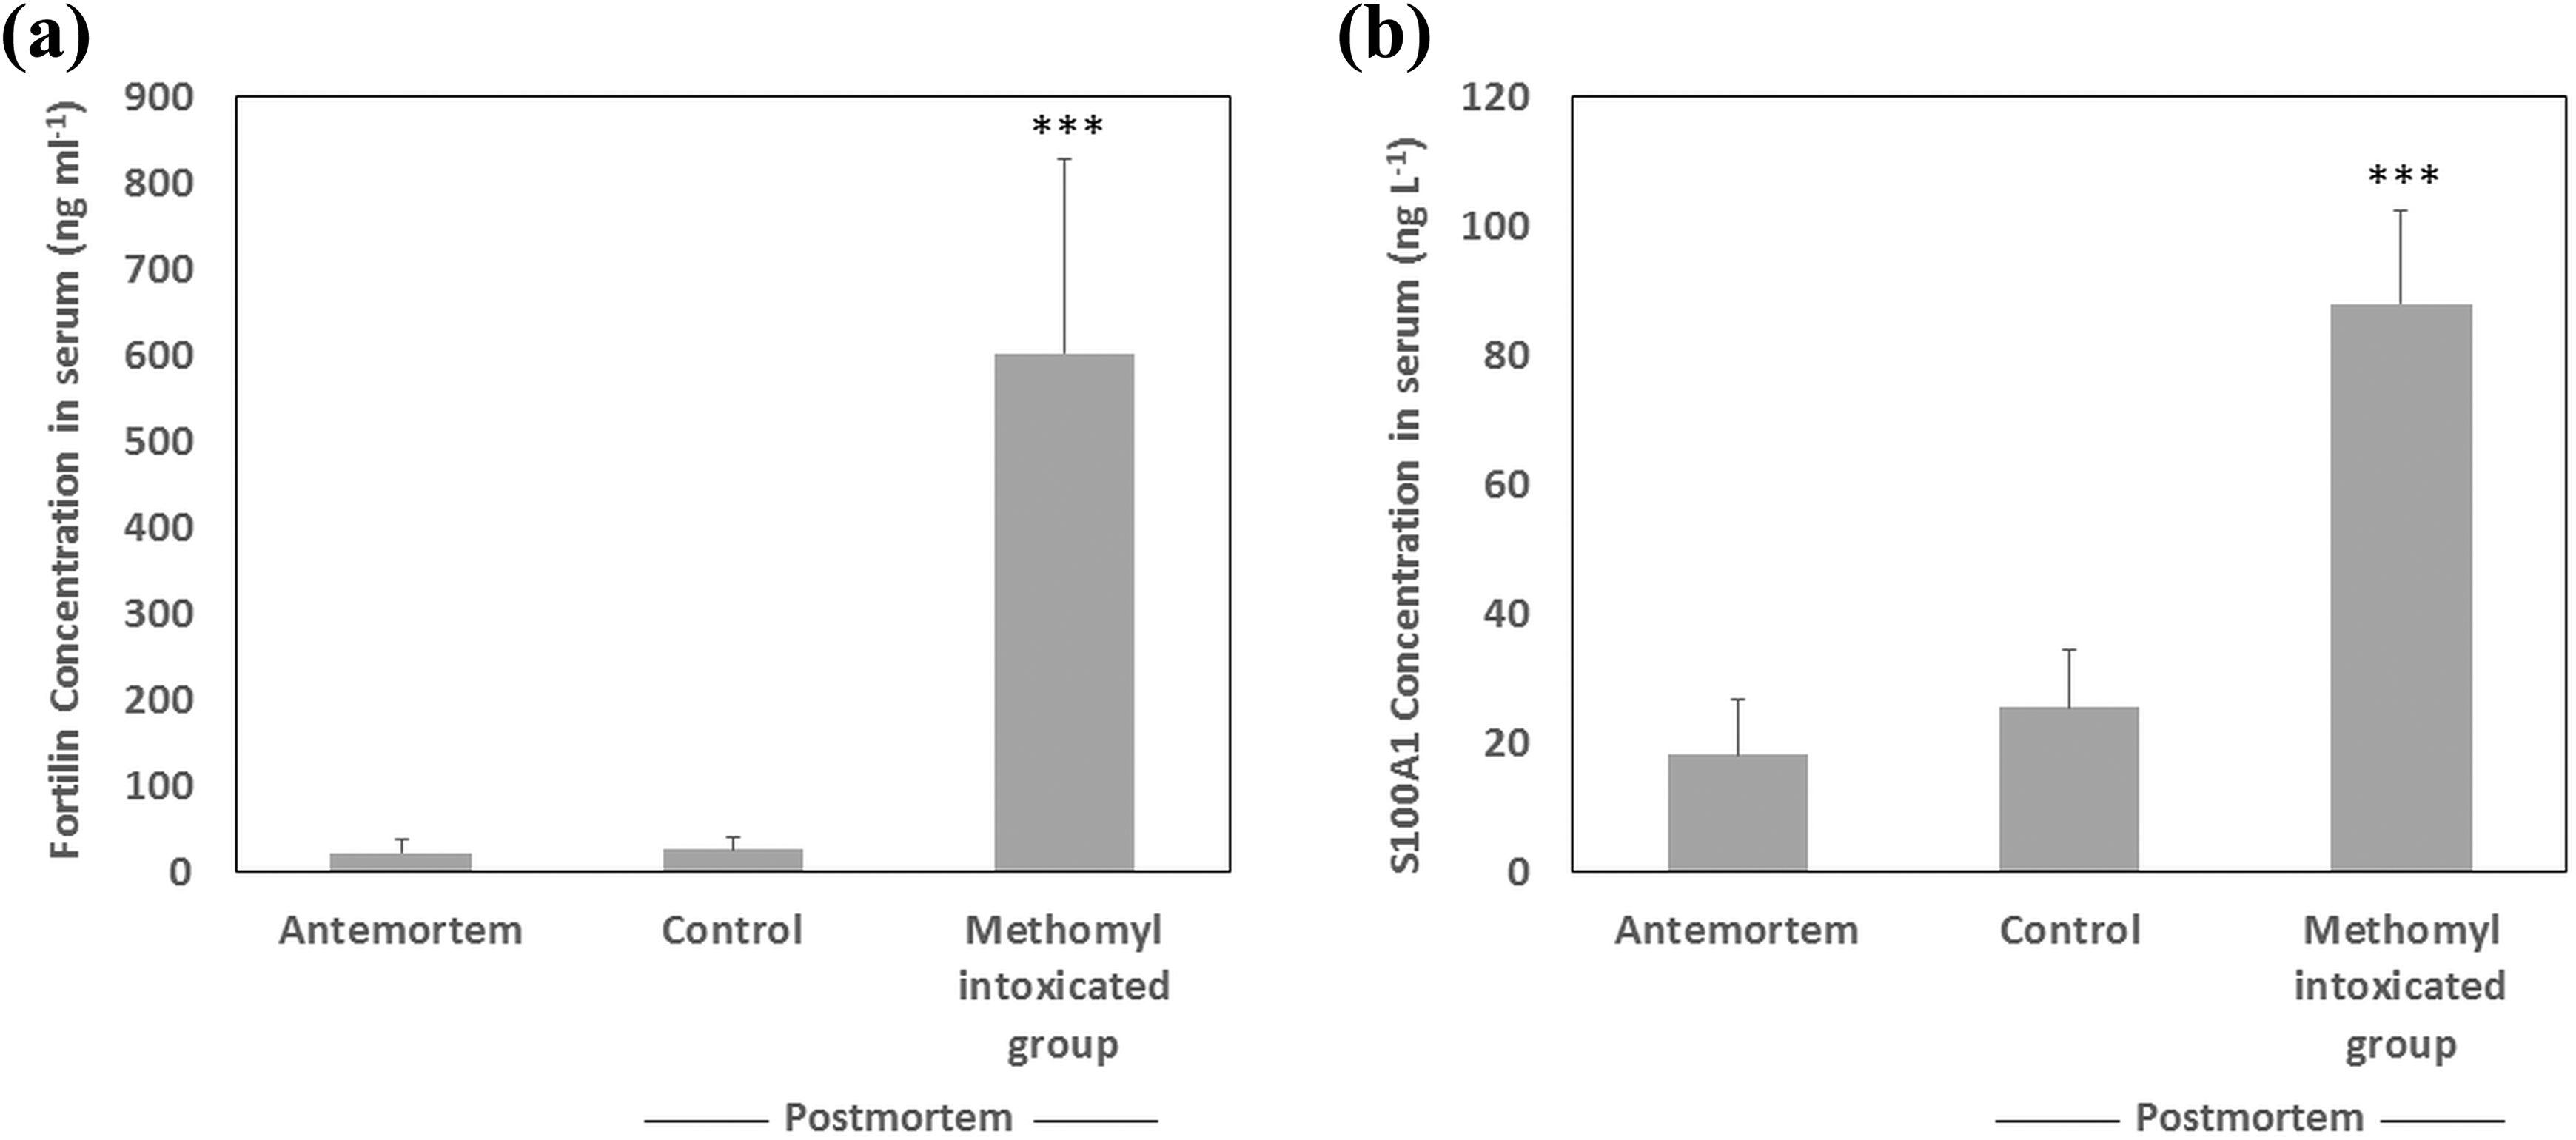
The average antemortem and postmortem (a) serum fortilin in ng ml−1 and (b) serum S100A1 in ng l−1 from the control group following cervical dislocation, and the study group following lethal methomyl intoxication. The whiskers are representing 1 SD. ***p < 0.001. SD: standard deviation.
The average levels of serum S100A1 (Figure 1(b)) for the antemortem and the control were 18.20 ± 8.51 ng l−1 and 25.6 ± 8.74 ng l−1, respectively, with no significant differences (p > 0.05). On the contrast, the serum levels of the intoxicated animals significantly increased (p < 0.001) approximately 4.8 folds to 88.0 ± 14.29 ng l−1.
Immunohistochemistry images in Figure 2 display the histological immunostaining of S100A1 in the ventricular tissue from the control (Figure 2(a)) and the intoxicated group (Figure 2(b)). The control tissue showed a clear intense and evenly diffused positive stain of normal myocardiocytes (arrow) through all of the three layers of the heart tissue: endocardium (Endo), myocardium (Myo), and pericardium (Peri). The S100A1 depleted areas were obvious (wide arrow) for the methomyl-intoxicated group compared with the control group. Wavy pattern (circle) appeared mainly in the pericardium due to an intensified stain in the adjacent cardiac fibroblasts (narrow arrow). Additionally, the intoxicated cardiac tissue displayed general loss of normal cardomyocyte striation with structure interruption due to the formation of necrotic debris.

Imunohistological sections of cardiac ventricular tissue from (a) a control rat and (b) a methomyl-intoxicated rat. The arrow in section (a) points to normal cardiomyocytes with adjacent normal cardiac fibroblasts in the three layers of the heart; endocardium (Endo), myocardium (Myo), and pericardium (Peri). The wide arrow in section (b) indicates negatively S100A1-stained cardiomyocytes with obvious loss of striation and disintegrated cardiac cells. The narrow arrow indicates positively S100A1 immnuostained cardiac fibroblasts that form a wavy pattern prominent in the pericardium (circle). The scale bar is 50 µm, and the total magnification is ×400.
Discussion
There are two innovations in the present study. First, the work illustrates the effect of methomyl toxicity on the serum levels of both markers and on the distribution of S100A1 in the ventricular cardiac tissue. Second, the study utilizes the apoptosis protein fortilin and the cardiac protein S100A1 as potential markers of methomyl toxicity.
The measured levels of fortilin after overdosing animals with methomyl were significantly higher than the levels in the control as well as the antemortem levels. A previous study on liver damage induced by injecting C57BL/6J mice with CD95 antibody found that fortilin levels significantly increased post injection (control: 86.18 ± 27.71 ng ml−1 vs. treated: 226.31± 48.51 ng ml−1). 9 The study concluded that serum fortilin levels reflect the degree and extent of in vivo apoptosis in the living mice. 9 Similarly, the present study has indicated that serum fortilin levels increased post lethal methomyl toxicity, which could reflect the degree and extent of apoptosis in response to toxicity. Based on this, overdose by methomyl could accelerate postmortem autolysis and cellular damage. This is valuable for the pathologist to compare with normal autolysis and to further understand the alterations due to toxic exposure. The significant alterations could reflect the stress triggered by the toxicity process as fortilin is a protein released in response to stress. 17
In parallel to fortilin, S100A1 peaked following the lethal dose. In fact, a previous experiment found that S100A1 significantly concentrated in serum following acute myocardial infarction (AMI) in Sprague-Dawley rats. 14 This indicates the degree of cardiac damage due to methomyl exposure. Such biomarker could serve as a toxicity biomarker in addition to its role as an AMI biomarker. 18
Based on the fact that the blood was taken from the heart, the present results disclose that serum fortilin could generally reflect the extent of damage in the body tissue, and particularly, estimate the degree of damage in the cardiac tissue. This is also plausible since fortilin is an apoptotic protein. 11 It is known that DNA degradation is part of the cellular damage process, and fortilin is a nuclear protein that binds the microtubules in the α-helical region of its structure. 11 Consequently, increased serum fortilin could be correlated with tissue damage, toxicity, and autolysis process.
Regarding S100A1, the current levels of serum S100A1 could mirror cardiac damage. As a result, the damage was greater in the cardiac tissue of the intoxicated rats compared to control. This was further confirmed by the immunohistological findings. Up to date, this is the first investigation that reports the alterations of S100A1 levels in serum and illustrates the marker distribution in cardiac tissues following a methomyl overdose. Such findings could serve as a platform for future research in the field of dose–response effects of methomyl on the selected proteins.
Examining the involved mechanisms of methomyl toxicity has revealed a number of factors that could interpret the present levels of serum fortilin and S100A1. Methomyl is a potent inhibitor of acetylcholine esterase by carbamylation, leading to accumulation of the acetylcholine at the nerve synapses or at the neuromuscular junctions. 19 The developed cholinergic crisis leads to death via respiratory arrest. 20 Methomyl also promotes oxidative damage by enhancing lipid peroxidation in the cellular membranes, which ultimately induces apoptosis. 21 Eventually, the cells dissolve from the inside out via releasing autolytic lysosomal enzymes and free radicals. 22,23 Taken together, the toxin induces cellular damage that increases the release of both proteins into serum.
There is a potential association between the fortilin concentrations and the durations of agonal stress. The average duration of agony in rats killed by methomyl ingestion (2.5 ± 1.5 min) was clearly longer than that for the cervical dislocated rats that died instantly. Augmented agony could have contributed to higher postmortem fortilin levels in the methomyl-intoxicated rats compared to the levels in the control rats. It has been reported that acute oral doses in rats induce profuse salivations, lacrimation, bulging eyes, fasciculation, tremors, and death. 2 Similar symptoms were manifested by the currently treated rats, and they exhibited stressful agony periods post methomyl ingestions. Such findings would justify the remarkable increase of both biomarkers in response to methomyl toxicity.
Of note, there was a potentially common alteration of the calcium (Ca+2) homeostasis during methomyl toxicity; the tissue levels of Ca+2 decreased due to leaking membranes. 21 Methomyl reduces the activity of Ca+2 ATPase and alters the Ca+2 homeostasis. 24 Considering the involvement of fortilin and S100A1 in the Ca+2 homeostasis, it is plausible that cellular Ca+2 could have been released in response to toxicity, which triggered further release of fortilin and S100A1 to combat the Ca+2 fluxes. A ruling question to be answered in the future studies is to correlate the levels of Ca+2 in blood with the selected biomarkers.
Considering S100A1 immunostaining in the cardiac tissue, the control ventricular cardiomyocytes were stained brown (positive for S100A1), while the nuclei were stained blue. The stain intensity was uniformly and diffusely distributed in the cardiac sections. The morphology of the cardiomyocytes was well conserved through the three cardiac layers (i.e. endocardium, myocardium, and pericardium).
For the intoxicated rats, there were well-demarcated areas of complete depleted cytoplasmic S100A1 stain. Ischemic cardiomyocytes are mainly obvious in the myocardium and the pericardium, while the stain concentrated in the adjacent cardiac fibroblasts (located between cardiomyocytes). The depleted S100A1 patches contained sparse necrotic cardiomyocytes with prominent loss of striations. The deeply immunostained cardiac fibroblasts produced a wavy pattern that was dominant in the pericardium layer. The wavy pattern is formed because the cardiac fibroblasts endocytose S100A1 from the surrounding necrotic cardiomyocytes. 12 This protein activates a cytokine cascade, which in turn triggers inflammation by Toll-like receptor 4 (TLR4)-dependent activation of mitogen-activated protein kinases and nuclear factor-κB. 12 Inflammation activation would contribute to further cardiomyocyte necrosis and further S100A1 leakage into serum. This scenario has been enhanced following the lethal methomyl dose leading to augmented serum levels of the selected biomarkers.
Conclusion
To recapitulate, the lethal methomyl toxicity in the present study has induced a surge in serum fortilin and serum S100A1. This is promising not only for understanding the role of toxicity in altering the levels of these markers but also for explaining the involvement of other markers like Ca+2 levels. The increase of both proteins in serum has been found to concur with depletion of S100A1 stain in cardiomyocytes. This phenomenal concurrence could reflect the severity of damage in the heart following intoxication and potentially form a battery of biomarkers for the assessment of methomyl toxicity as well as other toxicities.
Footnotes
Declaration of Conflicting Interests
The author(s) declared no potential conflicts of interest with respect to the research, authorship, and/or publication of this article.
Funding
The author(s) disclosed receipt of the following financial support for the research, authorship, and/or publication of this article: This work was supported by the Deanship of Research at the Jordan University of Science and Technology (grant no. 20170091).