
Abstract
Aim:
To examine temporal trends in accesses to the UK’s National Poison Information Service’s TOXBASE database in Britain.
Methods:
Generalized additive models were used to examine trends in daily numbers of accesses to TOXBASE from British emergency departments between January 2008 and December 2015. Day-of-the-week, seasonality and long-term trends were analysed at national and regional levels (Wales, Scotland and the nine English Government Office Regions).
Results:
The long-term trend in daily accesses increases from 2.8 (95% confidence interval (CI): 2.6–3.0) per user on 1 January 2008 to 4.6 (95% CI: 4.3–4.9) on 31 December 2015, with small but significant differences in population-corrected accesses by region (p < 0.001). There are statistically significant seasonal and day of the week patterns (p < 0.001) across all regions. Accesses are 18% (95% CI: 14–22%) higher in summer than in January and at the weekend compared to weekdays in all regions; there is a 7.5% (95% CI: 6.1–8.9%) increase between Friday and Sunday.
Conclusions:
There are consistent in-year patterns in access to TOXBASE indicating potential seasonal patterns in poisonings in Britain, with location-dependent rates of usage. This novel descriptive work lays the basis for future work on the interaction of TOXBASE use with emergency admission of patients into hospital.
Introduction
Toxic exposure is a major contributor to the healthcare workload, with actual or suspected poisoning accounting for approximately 170,000 hospital admissions per year in the United Kingdom. 1 In addition, patients with suspected poisoning call National Health Service (NHS) telephone helplines (NHS24 and NHS Direct), present to primary care, and present to emergency departments without being admitted. 1 The number of poisoned patients who do not get admitted is likely more than those admitted to hospital although national records in Britain only exist for patients admitted to hospital.
The UK’s National Poisons Information Service (NPIS) provides UK clinicians with up-to-date information on the diagnosis, management and treatment of suspected poisoning. 1 This information is provided, in the first instance via an online clinical management database, TOXBASE. If further guidance is required, clinicians can telephone NPIS directly and get advice from a specialist in poisons information. Where the case is particularly complicated, or clinical advice is requested, the call is referred to an NPIS consultant clinical toxicologist.
TOXBASE contains advice on approximately 17,200 different chemicals and toxins, with relevant additions being made as the NPIS become aware of new substances. 2 The database is continually updated, with 4100 entries being updated in the 2014/2015 financial year. 1 It is free to use for all NHS health professionals.
The National Institute of Clinical Excellent has indicated that, for cases of poisoning, the advice contained in TOXBASE should be considered the standard of care. 3 TOXBASE is typically accessed for all patients presenting to hospitals across the Britain. Therefore, the accesses made to TOXBASE should provide some indirect information on patterns of poisoning across the Britain.
Information on each access to TOXBASE is recorded and stored, resulting in a database containing data on the user, the product involved in the access and the date and time that the access was made. Hospitals are the most active users of the TOXBASE system. In 2014/2015, 65% of all user sessions were from hospital departments, with 85% of these coming from emergency departments. 1 It is for this reason that this article focuses on the temporal patterns underlying the use of the TOXBASE database by British emergency departments.
The aim of this article is to investigate the temporal and seasonal trends in accesses to TOXBASE by hospital emergency departments in Great Britain. This will give an overview of how poisoning and the approach to management have changed across the Britain since 2008. Initially, this will focus on the trends in accesses from all emergency departments combined. The variation in use throughout the year will be examined and day-to-day variation will also be assessed, which will determine whether there are any temporally cyclical patterns present in access to TOXBASE. There will also be some examination of whether there are differences in usage pattern depending on regional location.
Methods
Data sources
The data used in this analysis were taken from the TOXBASE access database, which contains routinely collected data. As pages are accessed in TOXBASE, a record is made of the specific page ID involved, the location specific user ID and the date and time that the access was made. This information can be linked with lists of pages contained in the TOXBASE database and the list of registered TOXBASE users. This linkage means that a wide variety of analyses can be carried out.
These collected data cannot be linked back to specific patients, and as such are completely non-identifiable. This linkage was used to extract data on TOXBASE usage by emergency departments in England, Scotland and Wales, which is a pool of 398 user IDs. These data were examined at a daily level between 1 January 2008 and 31 December 2015.
Statistical methods
The models used in this article are of the class generalized additive models. 4 These models were implemented in the R statistical software program 5 (Version 3.2.2) using the ‘mgcv’ package. 4 In addition to linear terms, these models have the capacity to fit flexible curves to suit the data pattern. The smoothness of these flexible terms was determined using generalized cross validation.
Models were fit at two different levels; overall Great Britain and regional. Each of these models examined temporal effects with covariates to examine the long-term trend, the seasonal trend and also a day-of-the-week effect. Each ‘day’ was considered to run from midnight to midnight, which means that, for example, accesses which occur on a Sunday may be in relation to something which happened on Saturday night. The regional models considered an additional covariate for region, where the regions considered were Scotland, Wales and the English Government Office Regions: East Midlands, East of England, London, North East, North West, South East, South West, West Midlands and Yorkshire and the Humber.
The model examining the overall British trends took the form described by the following

Here, β1 represents an average number of accesses, and in this case, it is the average number of accesses made on a Monday. The subscript day(t) represents a specific day of the week so that β day(t) represents a deviation from the β1 value meaning that β1 + β day(t) for a given day represents the average number of accesses for a particular day of the week. The term d(t) represents the day within a year while t is a time indicator. This means that the terms f(d(t)) and g(t) represent the seasonal and long-term trends, respectively, which are represented as smooth functions. The log link is used here as the data are counts, which are positive. Taking the logarithm ensures that the values predicted from the model are positive.
In order to examine regional variation in accesses to TOXBASE, several models were fitted which reflect various ways in which location could impact the way in which TOXBASE accesses are made.
The simplest model would indicate that all regions are the same, and includes no regional effect, as shown in equation (1). The next level of complexity comes from region being considered as an additive term, which would indicate that, while the temporal trends estimated are the same for each region, each region has a different overall average usage. The more complex models use an interaction between region and each of the temporal terms, which would indicate that a particular trend (or set of trends) differs by region. The most complex of these models has the form described in equation (2), which indicates that the overall number of accesses, the weekly trend, the seasonal trend and the long-term trend are all different for each region l

The estimates from the regional level models will take the form of rates of access per 1000 people in the population as determined by the 2015 mid-year population estimates, 6 in order that the observed differences in numbers of accesses are not due to population size. Autocorrelation was accounted for by incorporating regional random effects, or adding an autoregressive moving average autocorrelation structure into the models.
The smooth terms and parameters in these models are estimated via an iterative back-fitting process, where each term is estimated based on the response values minus the current estimates of each other term in the model. Therefore, at each step, in the process, the values being used to estimate are overall centred around zero, but still with some pattern that is to be estimated, herein referred to as the centred response. It is the final values of this iterative process that will be presented and interpreted as the trends in the model.
Due to the nature of these models, the predictions are on the log scale. The results are then presented as percentage increases or decreases. These are calculated by finding the difference between two predictions, along with the corresponding confidence interval (CI) and then transforming to the data scale by taking the exponent of the resulting interval. This is valid, since the exponential function is one-to-one and hence adheres to the invariance principle.
First derivatives were computed using finite differences, with CIs for these being constructed as seen in the paper by Curtis and Simpson (see also) 7,8 . Since the first derivative of a function represents the gradient, this was used to identify periods of no change, which includes any peaks and troughs in the estimated trends, by seeking out periods for which zero was within the CI for the derivative.
Results
Overall
Figure 1 shows the number of accesses per registered user for each day between 1 January 2008 and 31 December 2015. From this plot, it can be seen that the number of accesses made to TOXBASE has been increasing overall since 2008, although the increase seems to become less dramatic in the more recent years. From this, it is difficult, however, to pick out any strong seasonal variation or day-of-the-week effect, although a consistently low level of accesses is recorded on Christmas Day each year.

Daily number of accesses per registered user to TOXBASE between January 2008 and December 2015. Note that the y-axis does not start at zero.
Figure 2 presents the average seasonal and long-term trends in the data. The long-term trend indicates that the daily rate of access per user has increased by 66.7% (95% CI: 56.1–78.0%) over the 8-year period between 2008 and 2015. The first derivative, which describes the rate of change of a function, indicates that the trend in the number of accesses made to TOXBASE has been approximately level since October 2013, where zero first appears in the 95% CI for the first derivative.

Seasonal (left) and long-term (right) trends in access to the TOXBASE database, as estimated from a generalized additive model (dashed lines represent a 95% CI). The y-axis denotes the response values (log rate of access) adjusted for everything other than the term under examination. CI: confidence interval.
The estimated seasonal trend indicates that there are three separate peaks in accesses to TOXBASE. Accesses are initially low in January compared to the rest of the year. There is a 13.8% (95% CI: 9.7–18.2%) increase to the first peak sometime between the 13 and 23 February. There is a subsequent 6% (95% CI: 2.2–9.9%) reduction to a minimum in late March or early April. This is followed by an increase of 9.2% (95% CI: 5.5–12.9%) to the second peak between 11 June and 18 July. Accesses then decreased by 5.3% (95% CI: 1.6–9.0%) to mid-August. There is an incremental increase between the minimum in August and the October peak of 3.4% (95% CI: −0.4 to 7.4%) which is not statistically significant. Accesses then decrease by around 15.9% (95% CI: 11.7–20.2%) between the October peak and the minimum that occurs over the Christmas period, between 17 and 27 December.
The peak, which is evident in summer, is also apparent in the number of accesses to pages related to agrochemicals and drugs of abuse (Figure 3). Interestingly, the number of accesses to pages on antidepressants shows a similar seasonal pattern, although with a more pronounced peak in February.

Seasonal patterns in the number of accesses made to pages related to antidepressants (top-left), agrochemicals (top-right) and drugs of abuse (bottom), as estimated from a generalized additive model. The y-axis denotes the response values (log rate of access) adjusted for everything other than the term under examination.
Figure 4 shows the average number of accesses for each day of the week. This indicates that accesses are generally highest on Sundays, with an average of 4.35 (95% CI: 4.28–4.42) accesses per registered user. Accesses were only slightly lower on Mondays where the average number of accesses per registered user was found to be 4.26 (95% CI: 4.20–4.31). Accesses decrease slightly between Monday and Friday by 4.6% (95% CI: 4.1–6.1%), before increasing into the weekend. However, the percentage difference in accesses from Friday to Sunday is small, at only 7.5% (95% CI: 6.1–8.9%).

Average number of accesses for each day of the week (95% CIs are shown by the vertical lines). Note that the y-axis does not start at zero. CI: confidence interval.
Regional variation
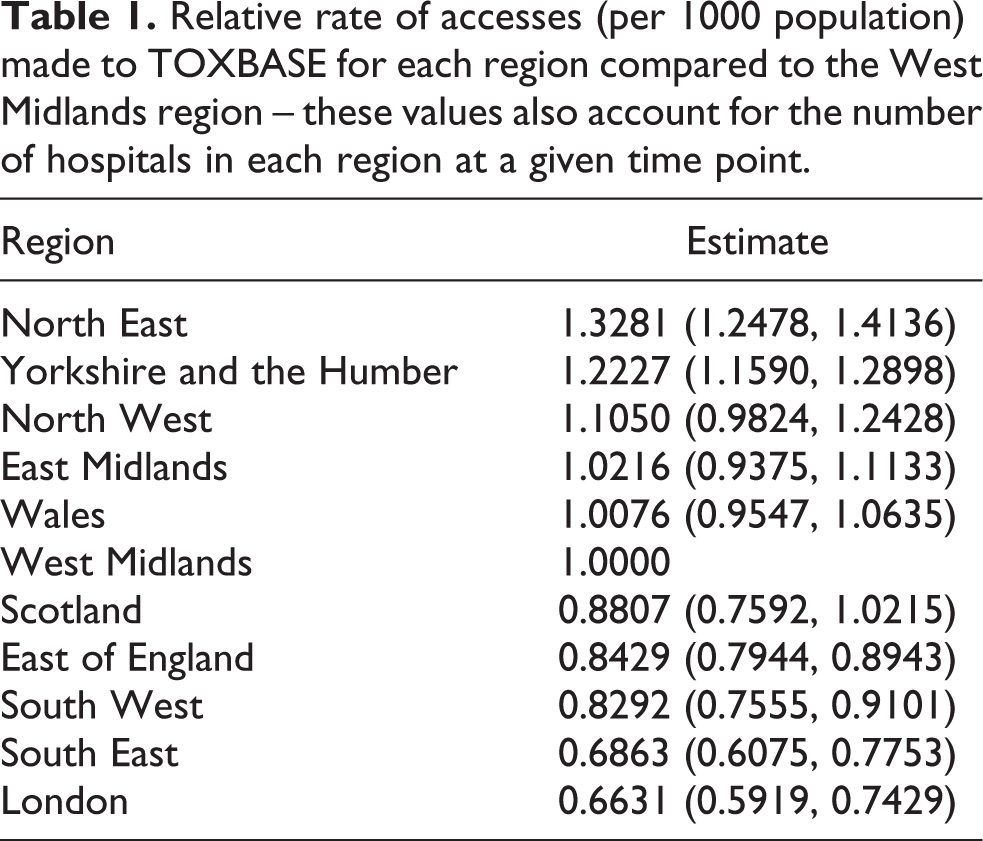
The analysis carried out at a regional level indicated that there was a difference between the overall rates at which different regions use the system (Table 1). Using West Midlands as the baseline, since this was the region with the median average rate of accesses, this shows that the most prolific users of the system, having accounted for the population and the number of registered TOXBASE users in a given region, are regions which lie in the north of England and in particular, the North East and Yorkshire and the Humber. Interestingly, Scotland and Wales use the system at around about the median rate, while the more southern regions of England appear to use the system at a significantly lower rate than average rate.
Relative rate of accesses (per 1000 population) made to TOXBASE for each region compared to the West Midlands region – these values also account for the number of hospitals in each region at a given time point.
There was no evidence of a difference in any of the trends examined, and these were all similar to those for the overall analysis. As shown in Figure 2, the long-term trend indicates that the daily rate of access per user has increased in all regions over the period studied. However, in this case, the CI for the first derivative of the function for the long-term trend is wholly positive at the end of the series, meaning that there is no indication that accesses are levelling off.
The estimated seasonal trend in the regional level model is also similar to that shown in Figure 2, and as before indicates that there are three separate peaks in accesses to TOXBASE, in February, July and October. The day of the week effect is similar to that in Figure 4, with accesses decreasing during the week before increasing from a minimum on Friday to a maximum on Sundays.
Discussion
The analysis carried out indicates that there are consistent trends in usage of the TOXBASE database in British emergency departments. One clear feature is that access to TOXBASE has been increasing since 2008. Indeed it has been increasing since the NPIS first advised online services as the initial point of contact in simple poisoning in 2005. 9 One explanation might be an increase in the incidence of poisoning in Great Britain, but until 2012 trends in drug-related deaths in England and Wales indicated a decrease. 10 Drug-related death in Scotland, however, appears to be following a similar, although perhaps less extreme, increasing trend to those seen in Figure 2. 11 Drug deaths represent a small fraction of all poisoning in Britain.
Trends in admission numbers for Scotland, England and Wales do not suggest increases in the magnitude shown in this study. 12,13 There may be increases in the number of presentations to emergency departments, which are not reflected in the admissions data, or perhaps an increase in the proportion of presentations that result in checking management on TOXBASE. Without data on numbers of presentations, it will be difficult to refute these hypotheses.
The seasonal patterns highlighted appear to suggest that there are three small but clear peaks in TOXBASE accesses, regardless of location, which occur in February, July and October. Meanwhile, two of the minima in the observed trends occur around the two main Christian holidays: Easter and Christmas. This ‘holiday effect’ has been noted previously in a study on self-harm attempts using data collected from across Europe by the World Health Organization. The peak in February is likely related to the fact that it lies between these two holidays, 14 or may be due to Seasonal Affective Disorder, which tends to exhibit depressive symptoms in mid-winter. 15
The small increase in October precedes the normal time that the United Kingdom introduces daylight saving, but is within a few weeks of the start of the new University term. This effect may be to do with the ‘broken promises’ principle outlined in a paper by Gabennesch. 16 This suggests that the disappointment after a new beginning can have a detrimental effect on vulnerable individuals. This peak is, interestingly, more than 2 months after the normal start date for new junior doctors in the United Kingdom, now in early August each year.
That the overall seasonal pattern is somewhat similar to the pattern seen in accesses to pages concerning antidepressants’ supports that accesses may be driven, at least in part, by incidents of self-harm related to depression. The peak in summer could, in addition, be linked to an increase in outdoor activity, and the wide variety of plants and animals which are present in the summer months as suggested in an annual report from the Swedish poisons centres. 17 There is also a clear indication that calls made to poisons centres across the United States peak in summer each year, although this was not formally assessed, 18 (Figure 3 in the report). A study on seasonality in acute illicit drug overdose indicated that there are peaks in both accidental and intentional overdoses in summer, as was found in accesses made to TOXBASE. The authors attribute this to possible higher levels of alcohol consumption in mid-summer as well as the Gabennesch principle. 19 This may also be due to increased drug use during festivals. 20
There has been some research done in relation to seasonality in suicides and attempted suicides. The results found in these differ from study to study, and the patterns found in these are generally different from the patterns found in this analysis. Three studies, two carried out in England and one in the United States, detected a peak in the cases of suicides in spring and early autumn. 21 –23 This was corroborated by a literature review specifically focusing on suicide by drowning. 24 Meanwhile, a study on suicide in Ireland found, similarly to the other studies, a spring peak. However, in contrast to the other studies, there was an autumn trough. 25 An Australian study found that, while there was a seasonal trend in violent methods of suicide, non-violent methods such as poisoning displayed no seasonal effect. 26 While these are in contrast to the results presented here, a Norwegian study found a seasonal pattern in non-fatal opioid overdoses, which approximately corresponds to the results of this analysis. They found that incidence rates were lowest in April, with a peak in August. 27
The weekly patterns found suggest that, again regardless of location, accesses to the database peak on Sundays, decrease during the week and then a small increase at the weekend by 7% from Friday to Sunday. A similar pattern was found in the number of self-harm presentations in a study using the National Self-Harm Registry Ireland. 28 This was also found in a study on attempted suicides in Helsinki, where suicide attempts were found to cluster around the weekend. 29 This sudden increase may also reflect recreational drug use over the weekend. 30 It has been noted previously that presentation of poisoned patients to emergency departments is higher between Friday evening and Tuesday night. 31 More recently, in their 2014 annual report, the Irish National Poisons Information Centre indicated that calls to their service were higher earlier in the week than later in the week, 32 which is in contrast to the findings presented here.
These data indicate that there are some consistent trends in the incidence of poisoning in Britain, as shown by the higher number of TOXBASE accesses at the weekend, and at particular times of the year. However, the impact of this on the National Health Service, particularly in terms of comparisons of hospital admissions and TOXBASE accesses is unclear, as are the implications of the north–south trend in access rates across England and Wales. This work thus provides a firm basis for further work which will examine how usage of TOXBASE might impact the rate of admission to hospital due to poisoning.
Footnotes
Declaration of Conflicting Interests
The author(s) declared no potential conflicts of interest with respect to the research, authorship, and/or publication of this article.
Funding
The author(s) disclosed receipt of the following financial support for the research, authorship, and/or publication of this article: This work was supported by the National Poisons Information Service.