
Abstract
The antidiabetic agent metformin was shown to further possess chemopreventive and chemotherapeutic effects against cancer. Despite the advances, the underlying molecular mechanisms involved in decreasing tumor formation are still unclear. The understanding of the participation of oxidative stress in the action mechanism of metformin and its related effects on p53 and on DNA base excision repair (BER) system can help us to get closer to solve metformin puzzle in cancer. We investigated the effects of metformin in HepG2 and H2009 cells, verifying cytotoxicity, oxidative stress, antioxidant status, and DNA BER system. Our results showed metformin induced oxidative stress and reduced antioxidant capacity. Also, metformin treatment with hydrogen peroxide (H2O2) enhanced these effects. Although DNA BER enzyme activities were not changed accordantly together by metformin as a single agent or in combination with H2O2, activated p53 was decreased with increased oxidative stress in H2009 cells. Our study on the relationship between metformin/reactive oxygen species and DNA BER system in cancer cells would be helpful to understand the anticancer effects of metformin through cellular signal transduction pathways. These findings can be a model of the changes on oxidative stress that reflects p53’s regulatory role on DNA repair systems in cancer for the future studies.
Introduction
The association of diabetes and cancer was previously reported in several studies. Their initiation and progression share potential risk factors such as diet, age, obesity, physical activity, hyperglycemia, and insulin resistance. 1 Metformin is a biguanide widely prescribed in the treatment of type 2 diabetes which got attention because the use of metformin was associated with a 23% decreased risk of any cancer in diabetic patients. 2 Also, retrospective epidemiologic data reveal that metformin using type 2 diabetes patients had lower cancer incidence and mortality than those not using metformin. 3 –5
There are several suggestions that explain the mechanism of action, chemopreventive, and antineoplastic activities of metformin both in vivo and in vitro. The indirect mechanism was initially attributed to insulin and glucose regulating actions which involves the reduction of hyperglycemia in liver. By regulating glucose and insulin metabolism which is generally upregulated in malignant tissues, metformin acts as an anticancer agent. 6 Also, metformin was shown to decrease circulating insulin-like growth factor-I levels. 7 The direct mechanism involves the inhibition of oxidative phosphorylation enzymes and thus the generation of increased adenosine monophosphate/adenosine triphosphate (AMP/ATP) ratio, 8,9 which leads to the AMP-activated protein kinase (AMPK) activation 10 and adenylate cyclase inhibition in response to energetic stress. 11 The AMPK activation leads to reduction in several cellular metabolic events, such as growth factor signaling, protein and lipid synthesis, and growth by mammalian target of rapamycin (mTOR) inhibition. 12 Also, extracellular signal-regulated kinase (ERK) signaling pathway was shown to interfere with metformin’s antitumor effects 13 as well as apoptosis- and autophagy-associated protein modulations. 14 G1 cyclin expressions were decreased with metformin resulting in G1 arrest. 15
The AMPK signaling pathway coordinates cell growth, autophagy, and metabolism. 16 In normal cells, AMPK induces energy conservation that promotes survival under stress conditions. In cancer cells, AMPK restricts energy consumption, thereby reducing proliferative capacity. 16 –18 Via AMPK-TSC2(Tuberous Sclerosis 2) activation, metformin is thought to inhibit mTORC1 which regulates proliferation and metabolism of the cancer cell. 19
p53, the guardian of the genome, has several key roles in regulating cell metabolism and cycle. It has been shown that p53 can be phosphorylated on serine 15 and activated by AMPK. 20 The antitumor effects of metformin are usually associated with AMPK-dependent activation of p53. 21 –23 On the other hand, in a study performed with the p53 mutant and wild-type colon cancer cells, the apoptotic rate in p53 mutant cells treated with metformin was increased compared with the p53 wild-type colon cancer cell lines. 24 Also, it was emphasized that AMPK and p53 genotype whether wild type or mutant do not alter the cellular effects of metformin through a study demonstrating that metformin treatment decreased radiotherapy resistance independent from the AMPK and p53 status. 25 So, it is still complicated that metformin acts through AMPK or p53 signaling.
Reactive oxygen species (ROS) accumulation, which is generally observed in cancer cells, can cause mutations in oncogenes and tumor suppressing genes, thus inducing cell proliferation and malignant transformation, further causing angiogenesis and metastases. 26 Oxidative stress, hypoxia, and oncogene activation can induce p53 activation. If the intensity of stress is abundant, p53 would act as a proapoptotic molecule and activate cellular death and senescence pathways. However, p53 would act as an antioxidant molecule and reduce ROS accumulation if stress is scarce. 27 The imbalance between ROS and p53 is especially noteworthy in the progression of cancer. Metformin inhibits endogenous ROS production and improves antioxidant status. 28 On the other hand, it has been shown that inhibition of mitochondrial metabolism leads to p53 inactivation. 29 Metformin which is a complex I inhibitor may lead to p53 inactivation and an increase in ROS-related oxidative DNA damage.
There are several types of DNA damage those are repaired by different repair pathways. One of the frontline DNA repair mechanism is base excision repair (BER) that prevents genomic instability and corrects base alterations caused by oxidation or alkylation. Oxidative stress can induce oxidative DNA base modifications which needs to be corrected by BER pathway. 30 The BER system proteins, DNA polymerase beta (DNA pol beta) and X-ray repair cross-complementing gene 1 (XRCC1), protect cells from ROS-induced DNA damage; p53 also interferes BER system by regulating the transcription of XRCC1 and DNA pol beta and by regulating the interaction between DNA and DNA pol beta. 31,32
Here, we hypothesized that metformin activates p53 by through AMPK signaling. However, the antioxidative effects of metformin may overlap p53’s proapoptotic role and may coordinate with several survival pathways such as DNA repair. By clarifying the role of metformin’s contribution on DNA BER system, considering oxidative stress and activated p53 activity in cancer will enable us to understand metformin’s contribution to DNA repair and to highlight its effects on oxidative status. Our study identifies the role of metformin on oxidative and antioxidative status and DNA BER pathway regulatory proteins, such as p53, XRCC1, and DNA pol beta in p53 wild-type H2009 and HepG2 cancer cell lines.
Materials and methods
Cell lines and cell culture
H2009 cell line was purchased from ATCC (Virginia, USA). HepG2 cell line was kindly provided by Prof. Dr Erkan Yurtçu. Cell lines were incubated at 37°C in a 5.0% carbon dioxide atmosphere and maintained in dulbecco’s modified eagle medium (DMEM) media (4.5 g/l glucose with L-glutamine) supplemented with 10% (v/v) fetal bovine serum and 1% antibiotics (100 U/ml penicillium and 100 μg/ml streptomycin). Oxidative stress was induced by (3, 7, 15, 31, 62, 125, and 250 µM) hydrogen peroxide (H2O2) for 1 h to define the accurate level of oxidative status. Proper H2O2 concentration was determined after cell viability (Online Supplementary Figures S1 and S2(a) and (b)) and oxidative capacity detection assays. After H2O2 incubation, media was removed and the cells were treated with metformin containing media. Metformin was dissolved directly into media and cells were treated at the given concentrations (0, 2.5, 5, 10, 20, 40, 80, and 160 mM) for 24, 48, and 72 h. For protein isolation, cells were harvested in cold lysis buffer (Cell Lysis Buffer (10×), #9803; Cell Signaling Technology, Massachusetts, USA) containing protease inhibitors (cOmplete Protease Inhibitor Cocktail; Sigma-Aldrich, Germany) and phosphatase inhibitor cocktail (Phosphatase Inhibitor Cocktail (100×), #5870; Cell Signaling Technology, Massachusetts, USA). Metformin was obtained from Merck Millipore (Massachusetts, USA) and dissolved in culture media right before each treatment. H2O2 was obtained from Merck Millipore and diluted in culture media.
Cell viability
Cell viability was determined by MTT assay. Cells were incubated in DMEM at 2 × 10 4 cells/200 μl per well in 96 well plates for 24 h at 37°C. The cells were treated with metformin (0, 2.5, 5, 10, 20, 40, 80, and 160 mM) for 24, 48, and 72 h. After incubation time, 10-μl MTT solution (0.5 mg/ml) was added to each well. After 4 h of MTT incubation at 37°C, 100 μl of crystal dissolving buffer was added and the plates were gently shaken on an orbital shaker for 5 min. The absorbance at 570 nm was measured with a microplate reader. Each treatment was repeated at least four times. The mean absorbance of four wells was used as an indicator of relative cell growth (ChemWell 2910 Automated EIA and Chemistry Analyzer; Awareness Technology, Palm City, Florida, USA).
Oxidative capacity detection
When 5 × 10⁵ cells were attached after 24 h, cells were first treated with H2O2 (30 µM for HepG2 cells and 60 µM for H2009 cells) to induce oxidative stress for 1 h. After H2O2 incubation, cells were treated with metformin or not. ROS levels were tested from cell lysates using Total Oxidative Status (TOS) Assay kit (Rel Assay Diagnostics, Turkey). Oxidants present in the sample oxidize the ferrous ion—chelator complex to ferric ion. The oxidation reaction is prolonged by enhancer molecules, which are abundantly present in the reaction medium. The ferric ion makes a colored complex with chromogen in an acidic medium. The color intensity, which can be measured spectrophotometrically, is related to the total amount of oxidant molecules present in the sample. The assay is calibrated with H2O2 and the results are expressed in terms of micromolar H2O2 equivalent per liter. 33
Antioxidative capacity detection
The antioxidant status was analyzed to determine how metformin reversed the oxidative effects of H2O2 in the cancer cell lines. Antioxidative capacity was tested using Total Antioxidant Status (TAS) Assay kit (Rel Assay Diagnostics). Antioxidants in the sample reduce dark blue-green colored ABTS radical to colorless reduced ABTS form. The change of absorbance at 660 nm is related to total antioxidant level of the sample. 33
Catalase activity assay
Catalase (CAT) activity was determined by Cayman Chemical CAT Assay kit (item no: 707002; Cayman Chemical, Michigan, USA) which has peroxidatic function. CAT detoxifies H2O2 by catalyzing it to molecular oxygen (O2) and water. The method is based on the reaction of the enzyme with methanol in the presence of an optimal concentration of H2O2. The product is measured spectrophotometrically with 4-amino-3-hydrazino-5-mercapto-1,2,4-trizazole. 34 The absorbance is read at 540 nm by ChemWell 2910 Automated EIA and Chemistry Analyzer (Awareness Technology) and expressed as nanomole per minute per milliliter of protein.
Superoxide dismutase activity assay
Superoxide dismutase (SOD) enzyme activity was measured by the Chemical SOD Assay kit (item no: 706002; Cayman Chemical). The principle of the kit is based on the detection of superoxide radicals which were generated by xanthine oxidase and hypoxanthine by tetrazolium salt. One unit of SOD is defined as the amount of enzyme needed to obtain 50% dismutation of O2 radical. The SOD assay measures all the three types of SOD (copper/zinc (Cu/Zn), manganese (Mn), and iron superoxide dismutase (FeSOD). 35 The absorbance is read at 440 nm by ChemWell 2910 Automated EIA and Chemistry Analyzer (Awareness Technology) and expressed as unites per milliliter of protein.
Glutathione peroxidase activity assay
Glutathione peroxidase (GPx) antioxidant enzymes have peroxidase activity, which catalyzes the reduction of hydroperoxides, including H2O2s, by reduced glutathione, thereby protecting the cell against oxidative stress. The Cayman Chemical GPx Assay kit (item no: 703102; Cayman Chemical) measures GPx activity indirectly by a coupled reaction with glutathione reductase (GR). Oxidized glutathione, produced upon reduction of an organic hydroperoxide by GPx, is recycled to its reduced state by GR and nicotinamide adenine dinucleotide phosphate (NADPH). The oxidation of NADPH to NADP+ is accompanied by a decrease in absorbance at 340 nm. The rate of decrease in absorbance is directly proportional to the GPx activity in the sample. GPx activity was expressed as nanomole per minute per milliliter. 36
DNA pol beta activity assay
DNA pol beta activity was measured by Elabscience DNA pol beta kit (E-EL-H3240; Elabscience Biotechnology, Chevy Chase, Maryland, USA) from in cell protein lysates. The Sandwich-ELISA method involves attachment of capture antibody to a microplate. 37 Standards or samples containing unknown amount of DNA pol beta are added to microplate wells and bound by the capture antibody. In the next step, a biotinylated detection antibody specific for DNA pol beta is added to each microplate followed by avidin-horseradish peroxidase (HRP) conjugate, and then they were incubated. Afterward, free components were washed away. The substrate solution is then added to each well. At this stage, only the wells which contain DNA pol beta, biotinylated detection antibody, and avidin-HRP conjugate will appear blue in color. By adding a sulfuric acid solution, the enzyme–substrate reaction is terminated and the color turns yellow. The optical density (OD) is measured spectrophotometrically at a wavelength of 450 ± 2 nm. The OD value is proportional to the concentration of DNA pol beta. By comparing OD samples to standard curve, the concentration of DNA pol beta in the samples was calculated and this value was expressed as nanogram per milliliter.
XRCC1 activity assay
XRCC1 activity was measured by Elabscience XRCC1 kit (E-EL-H3326; Elabscience Biotechnology). This ELISA kit uses Sandwich-ELISA as the method as described above.
Determination of activated p53
Activated p53 was measured by Elabscience p53 kit (E-EL-H0910; Elabscience Biotechnology). This ELISA kit uses Sandwich-ELISA as the method as described above. The concentration of DNA pol beta in the samples was calculated and this value was expressed as picograms per milliliter.
Statistical analysis
SPSS 20.0 software (SPSS Inc, Chicago, Illinois, USA) was used for statistical analysis. All the units were given below the figures. TAS/TOS levels were provided as micromole per liter. The treatment group enzyme activities, compared with control groups, were demonstrated as % value. Comparisons between normally distributed variables were conducted using one-way analysis of variance and non-normally distributed variables using the Mann–Whitney U test. The value of p < 0.05 was considered statistically significant.
Results
The antiproliferative effects of metformin was observed at 2.5, 5, 10, 20, 40, 80, and 160 mM concentrations in both HepG2 (Figure 1(a)) and H2009 (Figure 1(b)) cell lines by MTT test. Metformin decreased cell viability significantly at 5 mM or higher doses at 24, 48, and 72 h in both cell lines.

The antiproliferative effects of metformin in HepG2 (a) and H2009 (b) cells. Metformin induced cell death significantly at 5 mM or higher doses at 24, 48, and 72 h in both cell lines.
We studied the influence of metformin on levels of total oxidant and antioxidant status in cells treated with H2O2, which acts as an exogenous source of ROS. For this reason, we treated the cells with H2O2 alone, metformin alone, and with H2O2 and metformin combination. The optimum concentration of H2O2 for inducing oxidative stress was determined from the cell viability and oxidative capacity detection assays as 30-µM H2O2 for HepG2 cells and 60-µM H2O2 for H2009 cells after 1 h treatment (Online Supplementary Figure S1). We observed an increase in oxidative stress and decrease in antioxidant status significantly with 5- and 10-mM metformin treatment in HepG2 (Figure 2(a)) and H2009 (Figure 2(b)) cells. Also, the oxidant status was increased and antioxidant status decreased significantly further when both cells were exposed to H2O2 first and then treated with 5- and 10-mM metformin in a dose-dependent manner. In addition to this, oxidative stress index was calculated according to Erel’s method. 38 The results showed that it was increased with metformin and H2O2 treatments in both cell lines (Online Supplementary Figure S2).

Total oxidant and antioxidant status in HepG2 (a) and H2009 (b) cells treated with metformin and H2O2, as a single agent or in combination. Metfromin and H2O2 induce oxidative stress and reduce antioxidant capacity in all treatment groups. *p < 0.05: significant difference between control and treatment group. H2O2: hydrogen peroxide.
To better understand the association of oxidative stress in relation to metformin, the antioxidant enzyme activities were analyzed particularly in all treatment groups in both cell lines. SOD levels were significantly increased in all treatment groups compared to control group in HepG2 cells. The results of GPx activity showed that while 5-mM metformin decreased GPx activity, it was significantly increased with 10-mM metformin treatment in HepG2 cell line. GPx activity was not changed with 30-µM H2O2 exposure. However, 5- and 10-mM metformin after H2O2 exposure significantly reduced GPx activity in HepG2 cells. Quantification of CAT activity levels demonstrated that neither 30-µM H2O2 exposure nor 5- and 10-mM metformin treatment alone or combination could change antioxidant defense of CAT in HepG2 cells significantly (Figure 3(a)). Although SOD activity was increased with 5-mM metformin treatment in H2009 cells, it was significantly reduced with 10-mM metformin treatment. Also, SOD activity was decreased significantly at 60-µM H2O2 which is the oxidative stress inducing concentration for H2009 cells. Although it is not significant, the GPx activity was increased with 5- and 10-mM metformin treatment. On the other hand, 60-µM H2O2 exposure reduced all antioxidant activities as expected. Also, either 5- or 10-mM metformin treatment after H2O2 exposure could not elevate GPx activity levels near control levels in H2009 cells. CAT activity decreased significantly at 10-mM metformin treatment in H2009 cells. Also, 60-µM H2O2 exposure induced oxidative stress and reduced CAT activity significantly. Metformin treatment could not enhance CAT activity significantly after 60-µM H2O2 exposure in H2009 cells (Figure 3(b)). This shows that metformin increased oxidative stress in HepG2 and H2009 cells in a dose-dependent manner. Although specific enzyme activities varied within groups, the overall antioxidative capacity was not able to smoothen the oxidative effects of H2O2 and metformin alone or in combination in both cells.

The antioxidant enzyme activities in HepG2 (a) and H2009 (b) cells treated with metformin and H2O2, as a single agent or in combination. *p < 0.05: significant difference between control and treatment group. H2O2: hydrogen peroxide.
Following these results, we investigated how DNA BER system is altered by metformin and oxidative stress. In HepG2 cells, 5 mM of metformin increased the XRCC1 activity, whereas 10 mM of metformin decreased it significantly. When oxidative stress is induced with 30-µM H2O2 alone or 5- and 10-mM metformin was applied additionally, XRCC1 activity decreased significantly. While DNA pol beta activity increased significantly with 5-mM metformin, 30-µM H2O2, and 30-µM H2O2 + 5-mM metformin, it didn’t change in the other treatment groups in HepG2 cells. Meanwhile, activation of p53 was decreased significantly in the group where 10-mM metformin was applied and increased in the group where 30-µM H2O2 was applied but didn’t change significantly in other groups. These results can be deduced as DNA pol beta activity, and activated p53 levels did not negatively affected by low doses of metformin in HepG2 cells (Figure 4(a)). In H2009 cells, XRCC1 activity decreased significantly in the groups where 10-mM metformin and 60-µM H2O2 + 5-mM metformin were applied. It also increased significantly at 60-µM H2O2 exposure. When the DNA pol activity was examined in H2009 cells, no significant difference was observed between the control group and all of the treatment groups. Also, it was observed that activated p53 was decreased in all groups which were combined or singularly induced by metformin and H2O2 in H2009 cells (Figure 4(b)).
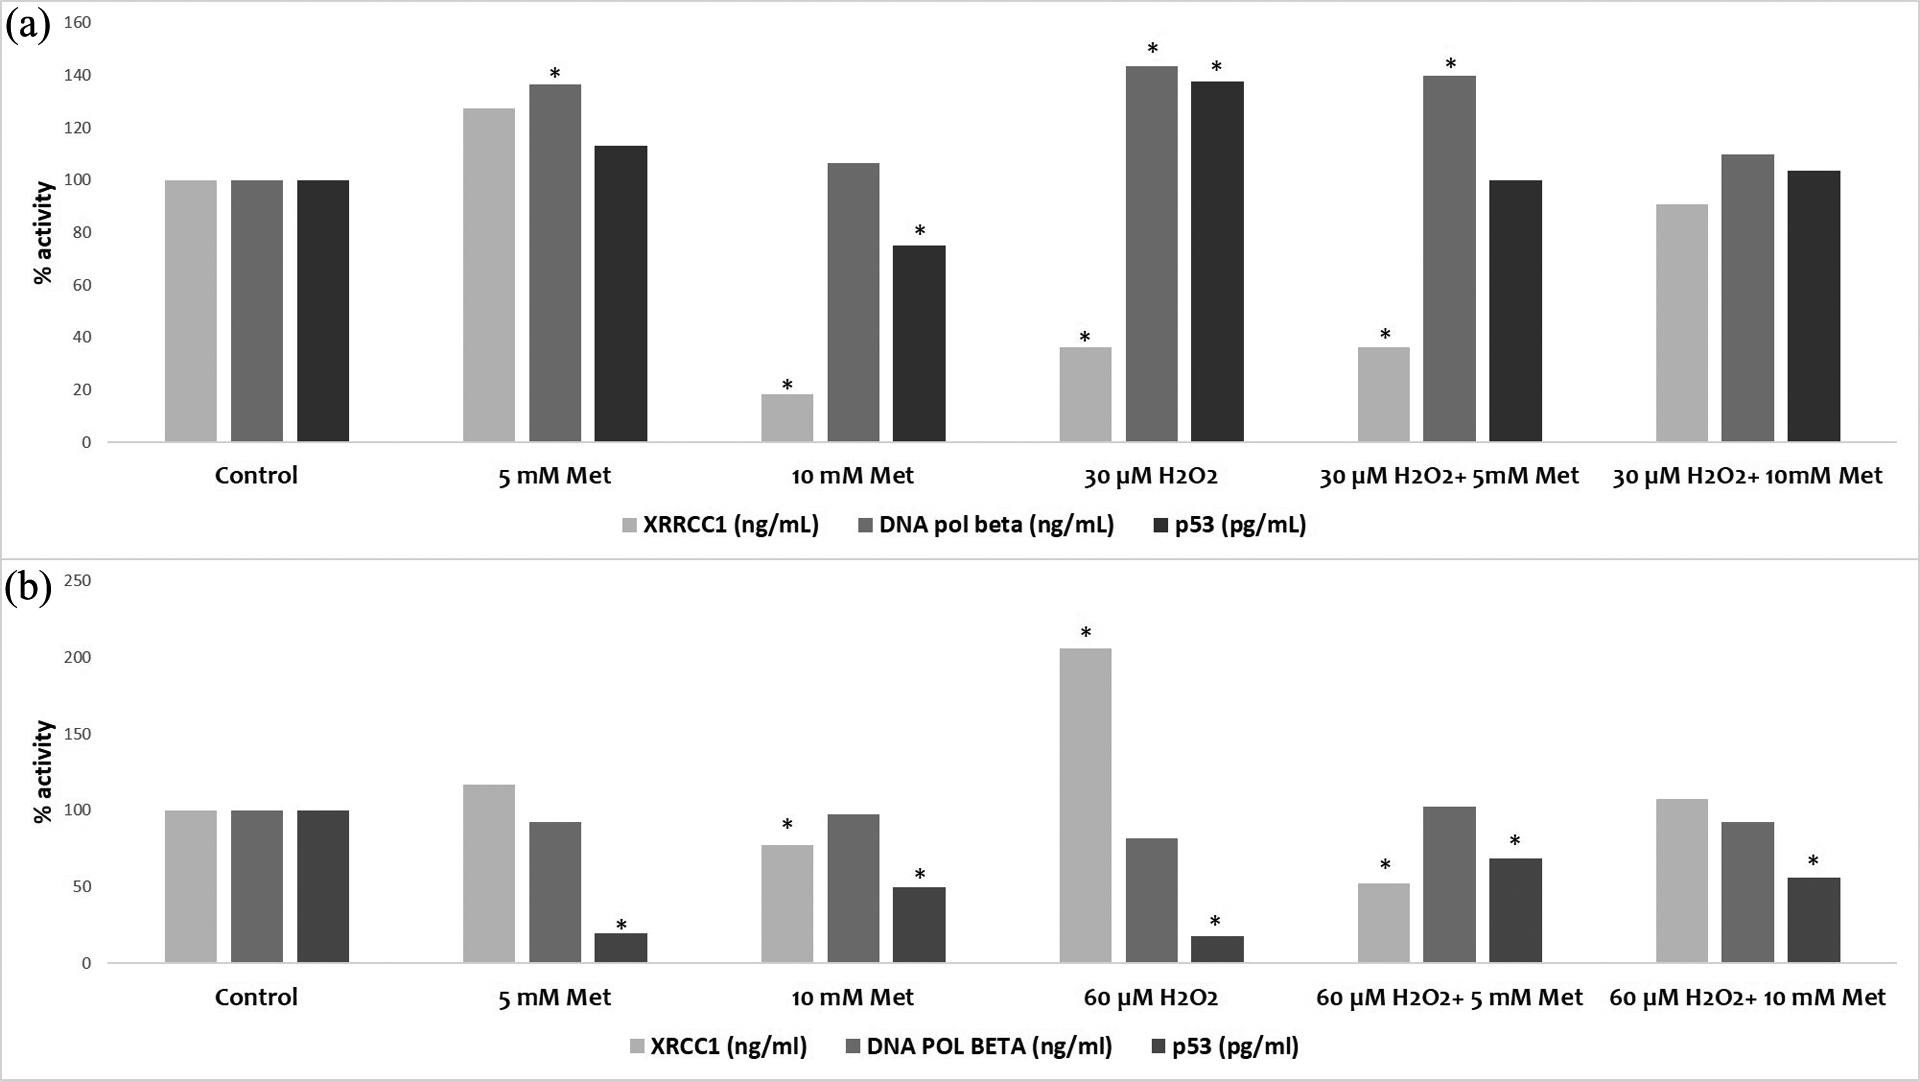
The DNA BER enzyme and p53 activities in HepG2 (a) and H2009 (b) cells treated with metformin and H2O2, as a single agent or in combination. *p < 0.05: significant difference between control and treatment group. BER: base excision repair; H2O2: hydrogen peroxide.
Discussion
The epidemiological and preclinical studies implicated several mechanisms to understand the antitumor effects of metformin in different cancer types. It is quite rational to deduce that AMPK activators like metformin have anticancer effects by activating p53. The literature has many studies about the effects of metformin on AMPK signaling pathway and p53 activity; however, the results of those studies vary according to the dose, the duration of treatment, the disease, or the type of cells. Metformin decreased translation ratio by inhibiting mTOR which is mediated by AMPK in breast cancer cells. 19 It was observed that low concentrations of metformin treatment induce senescence over the AMPK-p53 pathway, whereas the higher doses initiated apoptosis in hepatocellular carcinoma cells. 22 Also, it should be noted that the concentrations used in vitro are higher than the maximally achievable doses in vivo. 39 Additionally, it was demonstrated that metformin increases AMPK and acetyl-CoA carboxylase (ACC) phosphorylation, p53 Lys382 acetylation, and p21 expression. 22 So, metformin activates AMPK that in turn can launch a p53-dependent cellular event such as autophagy, apoptosis, or cell cycle arrest. 20 On the other hand, the AMPK-dependent mechanism of action of metformin is still indefinite. Metformin, independent of AMPK, gets p53 into the game and reduces mTOR and cell cycle progression through regulated in development and DNA damage responses 1 (REDD1). 40 Also, it was shown that metformin selectively suppressed the tumor growth and triggered apoptosis in p53 deficient HCT116 xenografts. 24 So, the requirement of AMPK and/or p53 for metformin’s antitumor activity has become more of an issue.
p53 fulfills antitumor functions by increasing transcriptional expressions of proteins taking part in DNA repair, apoptosis, prevention of cell expansion, alteration, and senescence. When there is an oxidative DNA damage, the intracellular damage recognition signals activate p53 or its transcriptional targets which then protects genome integrity. 41 However, the inhibition of complex I enzymes may provoke cell to reduce the activation of p53 which then may lead to increased ROS levels. Also, the increase in ROS levels can induce the p53 activity and causes the latter to play an antioxidant role, whereas the decrease in ROS levels can result in the inhibition of p53 which is absolutely an unsolicited result for cancer. 29 According to our results, H2O2 increased oxidative stress and decreased antioxidant status, as expected. Co-treatment with metformin and H2O2 also increased total oxidative stress and decreased TAS. Queiroz et al. found the similar oxidative effects of metformin in MCF-7 cells associated with reduced cell number. Also, the cell viability was increased with the addition of SOD and CAT in the presence of metformin. 42 Similar to our findings, Marinello et al. showed that metformin induced oxidative stress which is associated with DNA damage and apoptosis in breast cancer cell lines. 43 When our cell viability and oxidant status results were evaluated together, it can be interpreted that higher oxidative stress is associated with higher cell death which is caused by metformin. Consistent with our results, Algire et al. observed a modest increase in intracellular ROS levels following exposure to metformin in both cell lines. When cells were pretreated with metformin for 48 h, intracellular ROS levels were not affected regardless of AMPK expression. However, they found the opposite effects with paraquat compared with metformin treatment. Also, H2AX positive foci were detected with increased oxidative stress which is a DNA double-strand break indicator. Although metformin did not effect H2O2-induced DNA damage, it reduced paraquat-associated H2AX positive foci in cells.
The involvement of antioxidant enzymes is well-known cellular defense mechanism against oxidative stress. In our study, we could not observe the same increase or decrease pattern in antioxidant enzyme activities in HepG2 and H2009 cells. Quantification of SOD levels demonstrated that metformin significantly induced SOD levels in all treatment groups compared to control group in HepG2 cells. The increased SOD activities can be an example of the defense mechanism against oxidative stress in HepG2 cells. On the other hand, the low levels of GPx activity in 5 mM and 5-mM metformin + H2O2-treated HepG2 cells can associate with high levels of oxidant capacity which may be interpreted as GPx fails to induce the antioxidant activity due to high oxidative stress. The general reduction in antioxidative enzyme activities can be interpreted as the inability to reduce oxidative effects of metformin in both HepG2 and H2009 cells.
In H2009 cells, when p53 results were evaluated with the total oxidative stress parameters, it was observed that activated p53 was decreased with the increasing oxidative stress. For that reason, p53 is a critical regulator of oxidative stress in cells. It can activate several genes following increased oxidative stress which contributes to DNA repair. Also, another asserted suggestion is, p53 can activate several genes that result in increased ROS generation, which contributes to unrepaired DNA damage. Kang et al. showed that increased p53 inhibits CAT activity which drags cell to oxidative stress. 44 Contrary to our results, in the study of Bartesaghi et al., it was assessed that as a result of its antioxidant function, p53 prevented the ROS accumulation under low stress conditions in neural progenitor cells. In other words, the increase in ROS also increases the p53 activity and causes the p53 to act as an antioxidant, whereas the decrease in ROS causes the p53 inhibition. 29 It was previously determined that metformin increased p53 activity. However, our activated p53 results which were obtained in H2009 cells were the opposite of literature. This situation might be developed as a result of p53 prooxidant characteristic. Additionally, it is quite rational that these different results might be due to the genomic profile of the cell lines used in the literature and the mutation differences of our cell lines. Nelson et al. showed that metformin induced activation of AMPK and decreased p53 protein abundance and oxidative stress. In this context, p53 expression is associated with oxidative stress. 23
The relationship between metformin and DNA repair systems is especially studied in chemotherapy and radiotherapy resistance, double-strand break repair, and nucleotide excision repair. Tseng et al. showed that metformin decreased the expression of excision repair cross-complementation 1 (ERCC1) and increased paclitaxel’s cytotoxic effect in small NSCLC cell lines via p38 MAPK pathway. It was suggested that metformin and paclitaxel combination could be useful in human NSCLC cells clinically. 45 In another study, it was observed that metformin application in A549 and H1975 cells decreased thymidine phosphorylase (TP) and ERCC1 protein expression and, depending on the dosage, altered the MEK1/2-ERK1/2 expression. In addition to this, suppressing TP and ERCC1 with siRNA or application of Arachidin-1 (an antioxidant molecule) increased the antiproliferative effect of metformin. 46 In NSCLC cell lines and xenografts, metformin inhibited proliferation and thus made the cells sensible to radiotherapy. When metformin and radiotherapy were applied together, ATM-AMPK-p53/p21 pathway and apoptosis were activated; AKT-mTOR-4EBP1 pathway and angiogenesis were inhibited. 47 On the other hand, in a study showing that metformin has a negative effect on DNA repair, the expression of ERCC1 protein, which is a member of nucleotide excision repair, was related to increased DNA repair and increased resistance to chemotherapy in cancer. 48 Li et al. observed that, with inhibiting double-strand break repair, metformin sensitized the nasopharyngeal carcinoma cells to radiotherapy and had apoptotic effects. 49 In pancreatic cancer cell lines, it was observed that metformin decreased the resistance to radiotherapy and that there is an increase in DNA damage. 50 As it can be seen, the effects of metformin on several types of repair mechanisms and on resistance to chemotherapy and radiotherapy can vary within cancer cell types. It would be better if we would perform our hypothesis on different repair mechanisms or other cancer cell types to see broad spectrum of effects of metformin.
According to our findings, metformin increased the generation of oxidative stress in cancer cell lines; this rise in oxidative stress affected activated p53. While this situation is a good example for showing that p53 has both prooxidant and antioxidant functions, it is also a noteworthy condition for diseases like cancer. Although it is known that metformin has anticancer characteristics, its capability of inducing oxidative stress and thus changing the p53 protein activity will affect the DNA repair in cancer cell. In our study, no dramatic changes were observed in DNA BER system with metformin treatment in terms of considered parameters; however, this effect of metformin needs to be investigated in more detail in vitro and in vivo cancer models. Besides, apart from the DNA BER system, the systems providing DNA repair, which involve p53 protein, are crucial for cancer progression and treatment approaches. It would be enlightening to discover the relationship between the oxidative stress/p53 activity and DNA repair in other repair systems by designing a similar study to ours and in animal models.
Supplemental material
Supplemental Material, Supplementary_content - Role of metformin on base excision repair pathway in p53 wild-type H2009 and HepG2 cancer cells
Supplemental Material, Supplementary_content for Role of metformin on base excision repair pathway in p53 wild-type H2009 and HepG2 cancer cells by Irem Dogan Turacli, Tuba Candar, Berrin Emine Yuksel, and Selda Demirtas in Human & Experimental Toxicology
Footnotes
Acknowledgment
The authors thank Prof. Dr Erkan Yurtçu for providing HepG2 cells.
Declaration of Conflicting Interests
The author(s) declared no potential conflicts of interest with respect to the research, authorship, and/or publication of this article.
Funding
The author(s) disclosed receipt of the following financial support for the research, authorship, and/or publication of this article: This study was supported by the Turkish Research and Technology Council (TUBITAK; grant no 115S015).
Supplemental material
Supplementary material for this article is available online.
References
Supplementary Material
Please find the following supplemental material available below.
For Open Access articles published under a Creative Commons License, all supplemental material carries the same license as the article it is associated with.
For non-Open Access articles published, all supplemental material carries a non-exclusive license, and permission requests for re-use of supplemental material or any part of supplemental material shall be sent directly to the copyright owner as specified in the copyright notice associated with the article.