
Abstract
Urinary bladder cancer (UBC) is one of the most common malignancies worldwide. The etiology of UBC is multifactorial and includes both exogenous and endogenous factors. Exogenous risk factors include exposure to heavy metals, aromatic amines, and environmental pollutants including pesticides such as organochlorine pesticides (OCPs). Environmental factors alone are incapable of directly producing DNA damage and may require activation by phase I metabolizing enzymes like cytochrome P450 in order to become active carcinogen. The present study is designed to study CYP1A1 gene expression, OCP level in cases of UBC, as well as to explore the plausible role of gene–environment interaction in the etiology of UBC among North Indian population. A total of 60 cases with equal number of controls were enrolled under this study, the OCP levels were estimated using gas chromatography, CYP1A1 mRNA expression was quantified by real-time quantitative polymerase chain reaction, and fold change was calculated using the ΔΔCt method. In the present study, the levels of OCP were found to be significantly higher with the upregulation of CYP1A1 mRNA expression among UBC cases as compared to controls. While putting multiple linear regression, it has been observed that there is a significant interaction between the levels of OCPs and ΔCt value of CYP1A1 gene taken into account hematuria episodes as dependent variable. The study concludes that when there is predisposition of OCPs and upregulation of CYP1A1 gene, then the result will be an increment in hematuria episodes which indicates that gene–environment interaction plays a significant role in the causation of UBC among North Indian population.
Introduction
Urinary bladder cancer (UBC) is one of the most common malignancies worldwide. At any point in time, 2.7 million people have a history of UBC. More than 12 million new cases of cancer occur annually worldwide. Of these, 5.4 million occur in developed countries and 6.7 million occur in developing countries. 1 UBC ranks ninth in worldwide cancer incidence. It is the seventh most common malignancy in men and seventeenth in women. 2 The incidence of UBC varies worldwide, with highest rates in developed communities. But the burden of UBC is increasing less in developed countries. These changes can be attributed to a global increase in risk factors for UBC and growth and aging of the world population. In middle-aged and elderly men, bladder cancer is the second most prevalent malignancy after prostate cancer. 2 The etiology of UBC is multifactorial and includes both exogenous and endogenous (patient related) factors. Exogenous risk factors include exposure to heavy metals, aromatic amines, environmental pollutants including pesticides such as organochlorine pesticides (OCPs), and smoking. In addition, dietary factors may have a causative or protective role in the genesis of UBC. 3 Environmental factors are incapable of directly producing DNA damage and require activation by phase I metabolizing enzymes like cytochrome P450 in order to become active carcinogen. On the other hand, phase II metabolizing enzymes such as glutathione S-transferases (GSTs), N-acetyltransferases (NATs), and epoxide hydrolases are involved in the detoxification of chemical carcinogen and are protective. Exposure to tobacco smoke and other environmental and occupational chemicals, for example, benzidine and 2-naphthylamine, has been described as a risk factor for bladder cancer in numerous epidemiological and laboratory studies. 4 Genetic variation in the detoxification metabolism of xenobiotics is thought to play a major role in individual’s susceptibility to environmentally induced cancer. The mechanism by which exogenous toxins cause bladder cancer has been extensively researched in the past two decades. These researchers have identified a few genes of particular interest such as CYP1A1, GSTM1, GSTT1, GSTP1, NAT1, and NAT2. 5 CYP1A1 is a member of the cytochrome P450 group of genes. CYP1A1 is also known as aryl hydrocarbon hydroxylase. CYP1A1 is involved in phase I xenobiotic and drug metabolism. CYP1A1 gene is expressed in the epithelium and plays a key role in the activation of many pro-carcinogens including polycyclic aromatic hydrocarbons (PAHs) and aromatic amines arising from tobacco-related products. 6 The expression of CYP1A1 has been found to be associated with UBC. Only a few studies which have studied the association of CYP1A1 gene expression and UBC in Indian population are available. A study of CYP1A1 gene expression in combination with OCP exposure is likely to provide a useful correlation between environmental and genetic interactions in cases of UBC.
Material and methods
The present study was conducted in the Department of Surgery in collaboration with Environmental Biochemistry and Molecular Biology Lab, Department of Biochemistry and Department of Pathology at the University College of Medical Sciences (University of Delhi) and Guru Teg Bahadur Hospital, Delhi, India, between November 2012 and April 2014. The present research work has been carried out under the MS thesis as part of a course curriculum and as per the frequency of number of cases in our hospital in a defined period of time; a total of 60 cases with equal number of controls were enrolled for the study. The study got clearance from the Institutional Ethical Committee. On the basis of clinical examination, imaging and histopathological diagnosis, all the cases of UBC were enrolled. Simultaneously, the control group consisted of age-matched individuals who did not have UBC on the basis of history, clinical examination, urine examination, and ultrasonography. For each case, an age-matched individual who underwent cystoscopy for some urinary symptoms but did not have UBC was taken as control. All patients with diabetes mellitus or any chronic disease of genetic origin were excluded from both control and study groups.
A total of 3 ml of peripheral venous blood from antecubital vein of both UBC patients and controls was collected in Ethylenediaminetetra acetic acid (EDTA) vial, of which a 1 ml blood sample was used for OCP analysis, 1 ml blood was used for CYP1A1 gene expression, and 1 ml blood was used for other investigations.
Estimation of CYP1A1 gene expression
All the molecular biological studies were performed in a laminar air cabinet (Toshiba, India). Estimation of CYP1A1 gene expression in blood was performed using CFX Connect Bio-Rad two-color High-Resolution Melt (HRM) Real-Time PCR in the following steps:
Step 1: Extraction of RNA from blood sample
RNA was isolated from whole blood using TRIzol BD (Ambion; Invitrogen) as per manufacturer’s protocol. The concentration and purity of samples was determined using spectrophotometer (NanoDrop1000; Thermo Fisher, USA). All the samples had ratio of absorbance at 260/280 between 1.8 and 2.0. The quality of isolated RNA was checked by agarose gel electrophoresis. RNA loading dye (Fermentas, USA) and isolated RNA were mixed properly in a ratio of 1:1. The mixture was kept at 80°C for 10 min and then immediately placed on chilled ice and loaded on 1.5% agarose gel. Whole blood was used for isolating RNA using TRIzol reagent as per the protocol described by manufacturers. Briefly, 0.75 ml of TRIzol reagent was added per 0.25 ml of blood and homogenized by vortexing for 15 s, and then incubated for 5 min at room temperature to permit complete dissociation of the nucleoprotein complex. The homogenized samples were stored at −20°C until further use. TRIzol homogenized samples were used for RNA extraction where 0.2 ml of chloroform was added per 1 ml of TRIzol reagent used for homogenization. The tubes were capped securely. The tubes were shaken vigorously by hand for 15 s and incubated for 2–3 min at room temperature, and the homogenate was centrifuged at 12,000 × g for 15 min at 4°C. The mixture separated into a lower red phenol–chloroform phase, an interphase, and a colorless upper aqueous phase. RNA remains exclusively in the aqueous phase. The upper aqueous phase is approximately 50% of the total volume. The upper aqueous phase containing RNA was collected in a fresh tube and mixed with 0.5 ml of 100% isopropanol. The mixture was allowed to stand for 10–15 min at room temperature followed by centrifugation at 12,000 × g for 10 min at 4°C. The RNA pellet thus obtained was washed with 1 ml of 75% ethanol twice at 7500 × g at 4°C. Then, the pellet was air dried for 5–10 min and resuspended in 25 µl nuclease-free water. The purity and concentration of isolated RNA was measured by spectrometry on the basis of optical density (OD) measurements at 260 and 280 nm using ND 2000 Spectrophotometer (Thermo Scientific, USA) with OD 260/280 ratio of RNA samples ranging from 1.8 to 2.0. The integrity of total RNA samples was assayed performing agarose gel electrophoresis by determining the quality of 18 S and 28 S rRNA bands.
Step 2: Synthesis of complementary DNA
From the total RNA extracted, mRNA was used as a template for the synthesis of complementary DNA (cDNA). On the same day preferably, total RNA (1 µg) was converted into first strand cDNA using the Maxima First Strand cDNA Synthesis Kit (Thermo, USA) according to manufacturer’s protocol. An equal amount of total RNA was calculated for the conversion of RNA into cDNA. The product of the first strand cDNA synthesis reaction was diluted four times in nuclease-free water and used in quantitative polymerase chain reaction (qPCR). The volume of first strand cDNA synthesis reaction mixture did not comprise more than 1/10 of the total PCR reaction volume. cDNA was diluted four times and stored at −80°C until expressional quantification using HRM two-color real-time PCR.
Reverse transcription was carried out using a Thermo Scientific Verso cDNA synthesis kit. From each RNA sample, 1 µg of total RNA was used in a volume of 20 µl reaction containing 4 µl of 5X cDNA synthesis buffer, 2 µl of 5 mM dNTPs, 1 µl RT enhancer (added to remove contaminating DNA, eliminates the need of DNase treatment), 1 µl of Verso enzyme mix (contains RNase inhibitor) and 1 µl of random hexamer, and nuclease-free water was added to the volume and briefly centrifuged to collect the volume at the bottom. Reverse transcription was carried out in a thermal cycler (Bio-Rad, USA) at 42°C for 30 min followed by 95°C for 2 min (inactivation of reverse transcriptase).
Step 3: Quantification of CYP1A1 gene expression by two-color HRM real-time PCR
A real-time quantitative polymerase chain reaction (RT-qPCR) experiment was conducted to measure the expression of CYP1A1 gene in blood samples of subjects. The qPCR reactions were performed on CFX Connect Bio-Rad two-color HRM real-time PCR.
Briefly, the PCR amplification master mix of 45 µl contained 6.75 µl of diluted cDNA, 10 µl of Eva green master mix (Bio-Rad, USA), 10 pmole of each forward and reverse specific primer pairs, and 4 µl of nuclease-free water, and finally 20 µl of master mix was dispensed into two PCR tubes. Duplicate of each samples along with no-template control wells were placed into the chamber and kept into the machine. The PCR profile consisted of the initial denaturation of 3 min at 95°C, 40 cycles of 30 s at 95°C denaturing, 30 s at 62°C, and 20 s at 72°C extension.
Cumulative fluorescence was measured at the end of the extension phase of each cycle. The product of specific amplification was confirmed by melt curve analysis. The gene-specific primer sequence was used for amplification. Conformation of gene specificity of primer nucleotides was performed using the NCBI BLAST search program and additionally the amplified product was run on 2% agarose gel. Primer sequences used are as follows: GAPDH: (forward) 5′-AAGGGTCATCATCTCTGC-3′; (reverse) 5′-TAAGCAGTTGGTGGTGCA-3′ and CYP1A1: (forward) 5′-GAA CTG CCA CTT CAG CTG TCT-3′; (reverse) 5′-CAG CTG CAT TTG GAA GTG CTC-3′.
In the present study, RT-qPCR was performed to study the fold change (FC) analysis for evaluating the differential expression of genes. In this, gene expression normalization was done using GAPDH constitutive genes by determining delta Ct (cycle threshold). In a real-time PCR assay, a positive reaction is detected by the accumulation of a fluorescent signal, and the Ct is defined as the number of cycles required for the fluorescent signal to cross the threshold (i.e. exceeds background level). The Ct levels are inversely proportional to the amount of target nucleic acid in the sample, that is, lower the value of Ct, higher the amount of target nucleic acid in the sample. Then, the delta Ct was evaluated which is the difference of average Ct of target gene (CYP1A1) and normalizer gene (GAPDH gene): ΔCt = average Ct_target − average Ct_normalizer. Again, the difference of mean Ct values of control and cases was determined, which is delta delta Ct: ΔΔCt = ΔCt_control − ΔCt_test. After this, true FC was represented to compare the expression of genes between cases and controls by the following: FC = 2ΔΔCt If FC > 1, true FC = FC and If FC < 1, true FC = −1/FC.
Estimation of OCPs residue level
The estimation of the pesticide level was done by gas chromatography in following steps:
Step 1: Extraction of OCPs residue from blood
It was done according to the method of Sharma et al. (2013). One milliliter of blood was taken in a 100 ml flask for the extraction of OCPs; 12 ml of hexane and 6 ml of acetone were added and the contents were shaken at room temperature for 60 min in a mechanical shaker. The extract was centrifuged for 10 min at 2000 r/min and the clear top layer of hexane was collected in a clean test tube. The remaining portion was again extracted twice using the same process and the hexane fraction was added to the previous solvent fractions.
Step 2: Cleanup of the OCPs residue
Cleanup was done by the USEPA method using Florisil (Sigma) columns. This column was packed by a 0.5-cm layer of glass wool, with a 20-cm layer of activated Florisil and a 1-cm layer of anhydrous sodium sulfate. The column was pre-wetted with 15–20 ml of HPLC n-hexane. Sample was allowed to pass through the column from the top of the column. Further 20 ml of hexane was added for complete elution of samples. This process was repeated three times for the remaining residues. Finally, all the elute was collected in a beaker and hexane was evaporated in an evaporator to concentrate the sample. The concentrated residue was dissolved in 1 ml of hexane and packed for further analysis.
Step 3: Quantification of the levels of OCPs
The quantification of organochlorine residue levels was done by PerkinElmer Gas Chromatograph equipped with a 63Ni selective electron capture detector (PerkinElmer Pvt. Ltd., Singapore). Final extract (2 µl) was injected at a temperature of 170°C with a hold time of 1 min. The temperature was raised from 170°C to 225°C at a rate of 5°C/min with a hold time of 5 min and finally from 225°C to 275°C at a rate of 6°C/min with a hold time of 15 min.
Quantitative analysis of OCPs residue in each sample was affected by comparing the peak area with those obtained from a chromatogram of a mixed organochlorine standard of known concentration. Further, a quality check sample was run with each set of samples for pesticide analysis to maintain accuracy.
Statistical analysis
All the qualitative parameters are compared using χ2 test. An independent t-test was used to calculate the p value while comparing mean values of OCP levels among cases and controls and among high- and low-grade type of tumor. An independent t-test was also performed while comparing the mean values of ΔCt among cases and controls and among high- and low-grade type of tumor. To assess the role of gene–environment interaction in the etiology of UBC, a multiple linear regression model testing was done taken into account hematuria episode as dependent variable and gene expression and OCP levels as independent variables.
Results
Table 1 explains the demographic variation between the cases and control groups. The mean age of UBC patients was 52.76 ± 13.58. Smoking was significantly associated with the cases of UBC (p = 0.047). Alcohol intake was not found to be significantly associated with UBC cases.
Sociodemographic characteristics of study subjects.a
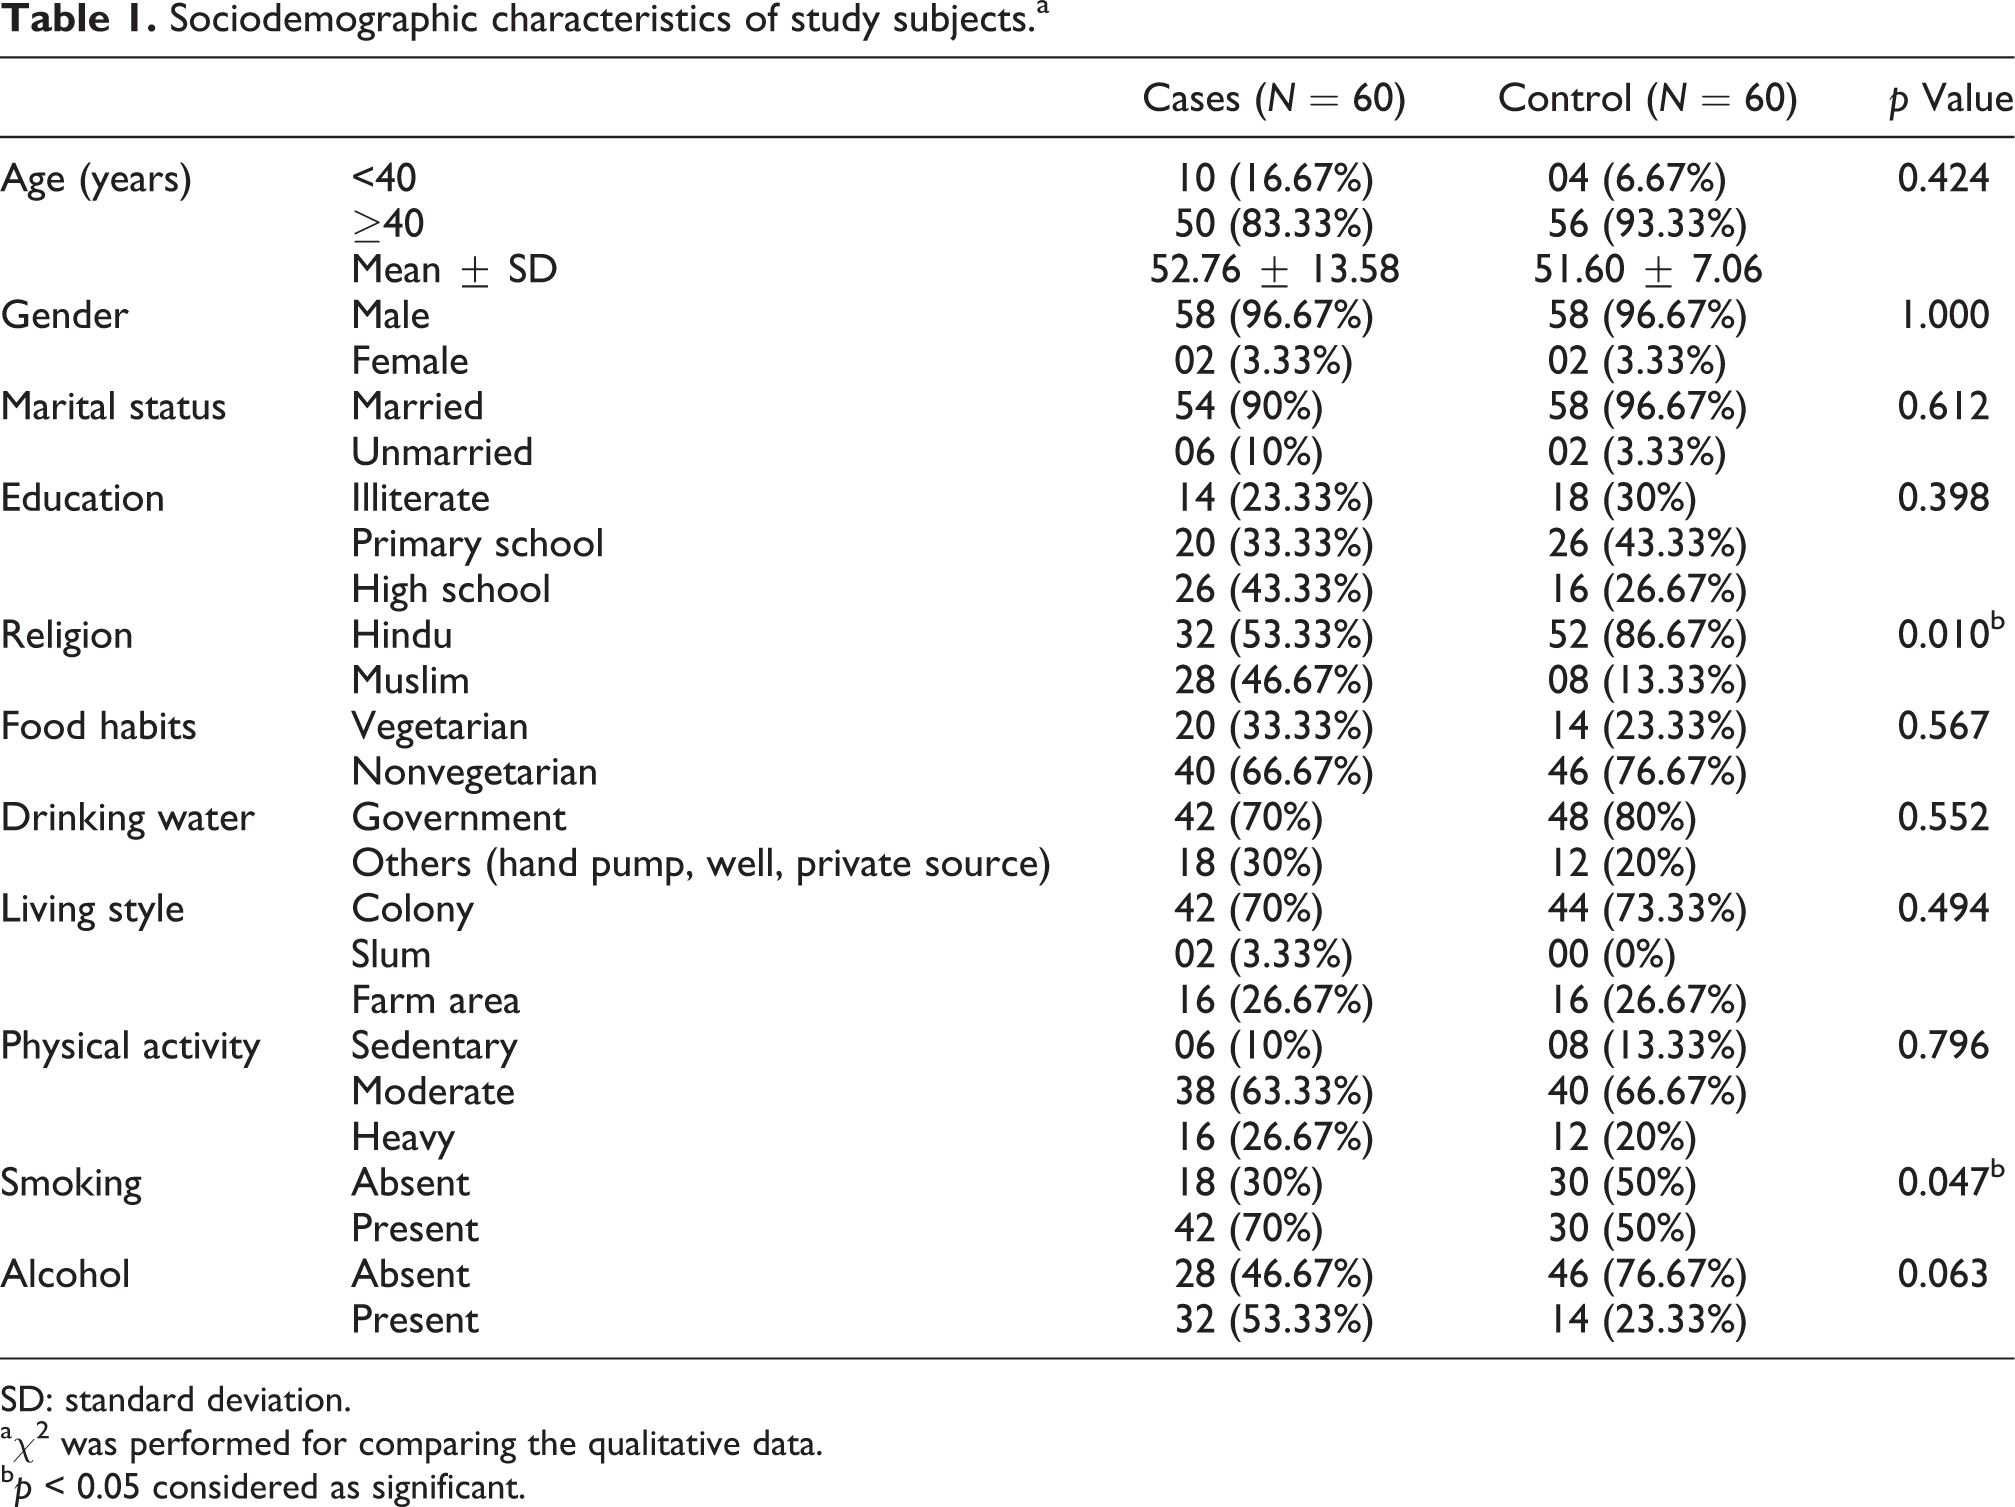
SD: standard deviation.
aχ2 was performed for comparing the qualitative data.
bp < 0.05 considered as significant.
Table 2 compares the level of different OCPs between the controls and UBC cases. β-HCH (p < 0.001), γ-HCH (p < 0.001), T-HCH (p = 0.017), and p,p′-DDT (p = 0.014) were found to be significantly associated with UBC cases.
OCP level in UBC cases and controls.a

OCP: organochlorine pesticide; SD: standard deviation.
aIndependent t-test was applied to compare mean value.
bp < 0.05 considered as significant.
Relative mRNA expression of CYP1A1 gene in UBC cases and controls was analyzed by the ΔΔCt method. It was found that mRNA expression of CYP1A1 gene is 5.80 folds higher in UBC cases as compared to controls. It means that the CYP1A1 gene is upregulated in cases of UBC as compared to controls. This result is depicted in Table 3 and Figure 1.

Comparison of CYP1A1 gene expression in UBC cases and controls.
mRNA expression of CYP1A1 gene among cases and controls: Comparison of mRNA expression of CYP1A1 gene in UBC cases and controls.a

UBC: urinary bladder cancer; SD: standard deviation.
aIndependent t-test was applied to compare the mean value of CYP1A1 ΔCt values.
bp < 0.05 considered as significant.
Table 4 shows the association of the grade of carcinoma urinary bladder to various parameters. Pelvic pain was significantly associated with the high grade of UBC (p value = 0.004). Smoking was found to be significantly associated with the high grade of UBC (p value = 0.037). Other parameters did not show any significant association with the grade of UBC.
Association of qualitative parameters with grade of UBC.a
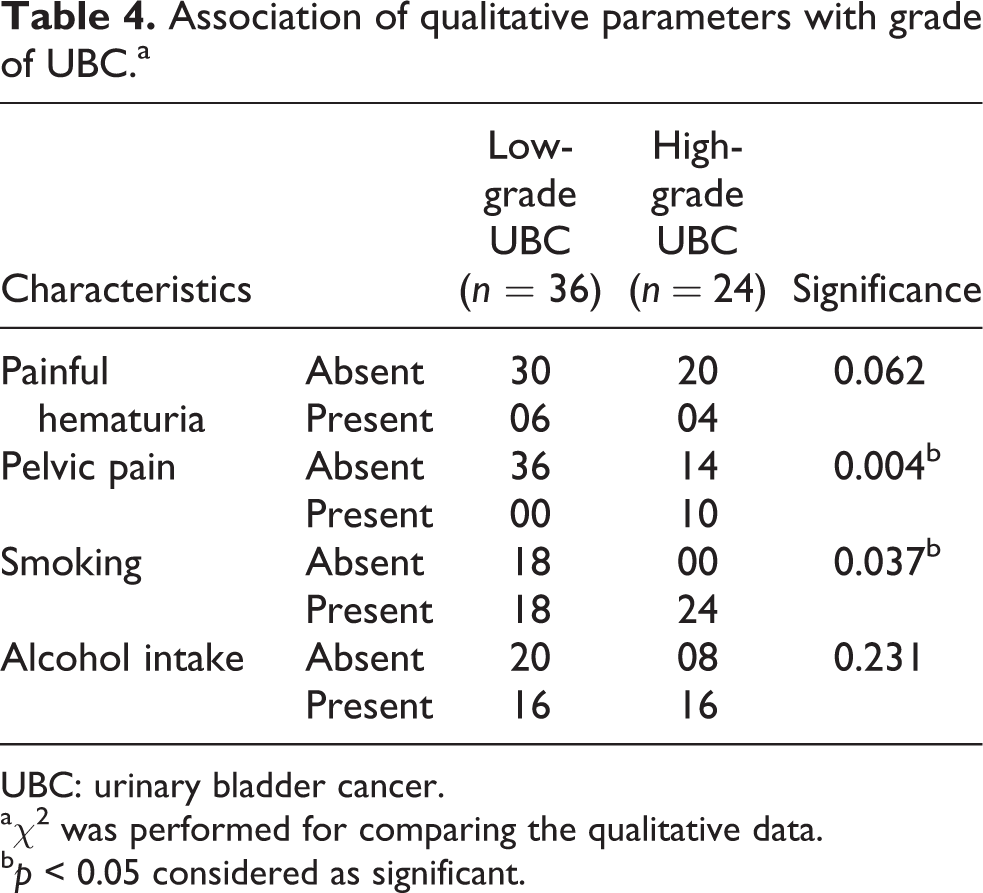
UBC: urinary bladder cancer.
aχ2 was performed for comparing the qualitative data.
bp < 0.05 considered as significant.
Higher serum levels of β-HCH, T-HCH, and p,p′-DDT were significantly associated with the high grade of UBC (p values < 0.001, 0.028, and 0.019, respectively). γ-HCH showed a marginal association with the high-grade cancer with a p value of 0.05. The rest of pesticides did not show significant association with the grade of UBC. This result is shown in Table 5.
Association of OCP levels with grade of UBC.a

UBC: urinary bladder cancer; SD: standard deviation; OCP: organochlorine pesticide.
aIndependent t-test was applied to compare mean value.
bp < 0.05 considered as significant.
From Table 6, it can be depicted that ΔCt of CYP1A1 gene is significantly higher in lower grades of UBC as compared to higher grades (p = 0.002), which narrates that the CYP1A1 gene expression is upregulated in higher grades of UBC.
Association of CYP1A1 gene expression with grade of UBC.a
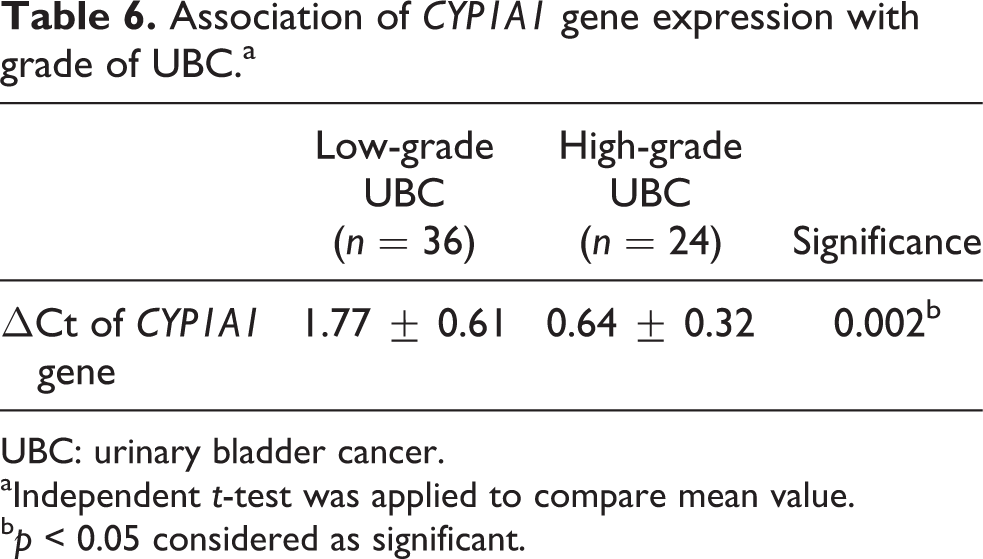
UBC: urinary bladder cancer.
aIndependent t-test was applied to compare mean value.
bp < 0.05 considered as significant.
Table 7 shows that a multiple linear regression analysis was applied taking hematuria episodes as dependent variable and gene expression and OCP levels as independent variables (gene–environment interaction). The interactions between expression and OCP levels were also included in the model after the adjustment of the following confounding factors: age, family history, smoking, alcohol intake, and drinking water. B is an unstandardized coefficient and this represents the mean difference of hematuria episodes. Since we applied multiple comparison tests (nine times), a Bonferroni adjustment was performed and the corrected p value was 0.05/9 = 0.005. Hence, we considered p < 0.005 as statistically significant. A significant interaction was found between the levels of OCPs and CYP1A1 ΔCt gene and increment in hematuria episodes. In other words, when the CYP1A1 ΔCt was high, increasing levels of OCPs in blood resulted in an increase of hematuria episodes of approximately 10 (p = 0.001). The calculation has been made as follows—assuming adjusted covariants are constant: hematuria episodes = B1 × β-HCH + B2 × CYP1A1 + B3 × CYP1A1 × β-HCH, assuming β-HCH = 1 and ΔCt of CYP1A1 = 1. From the table, B1 = 8.536, B2 = 5.434, and B3 = −3.869.
Regression model testing and interactive effect of OCPs (ppb) and CYP1A1 gene expression on hematuria episodes in UBC cases.a
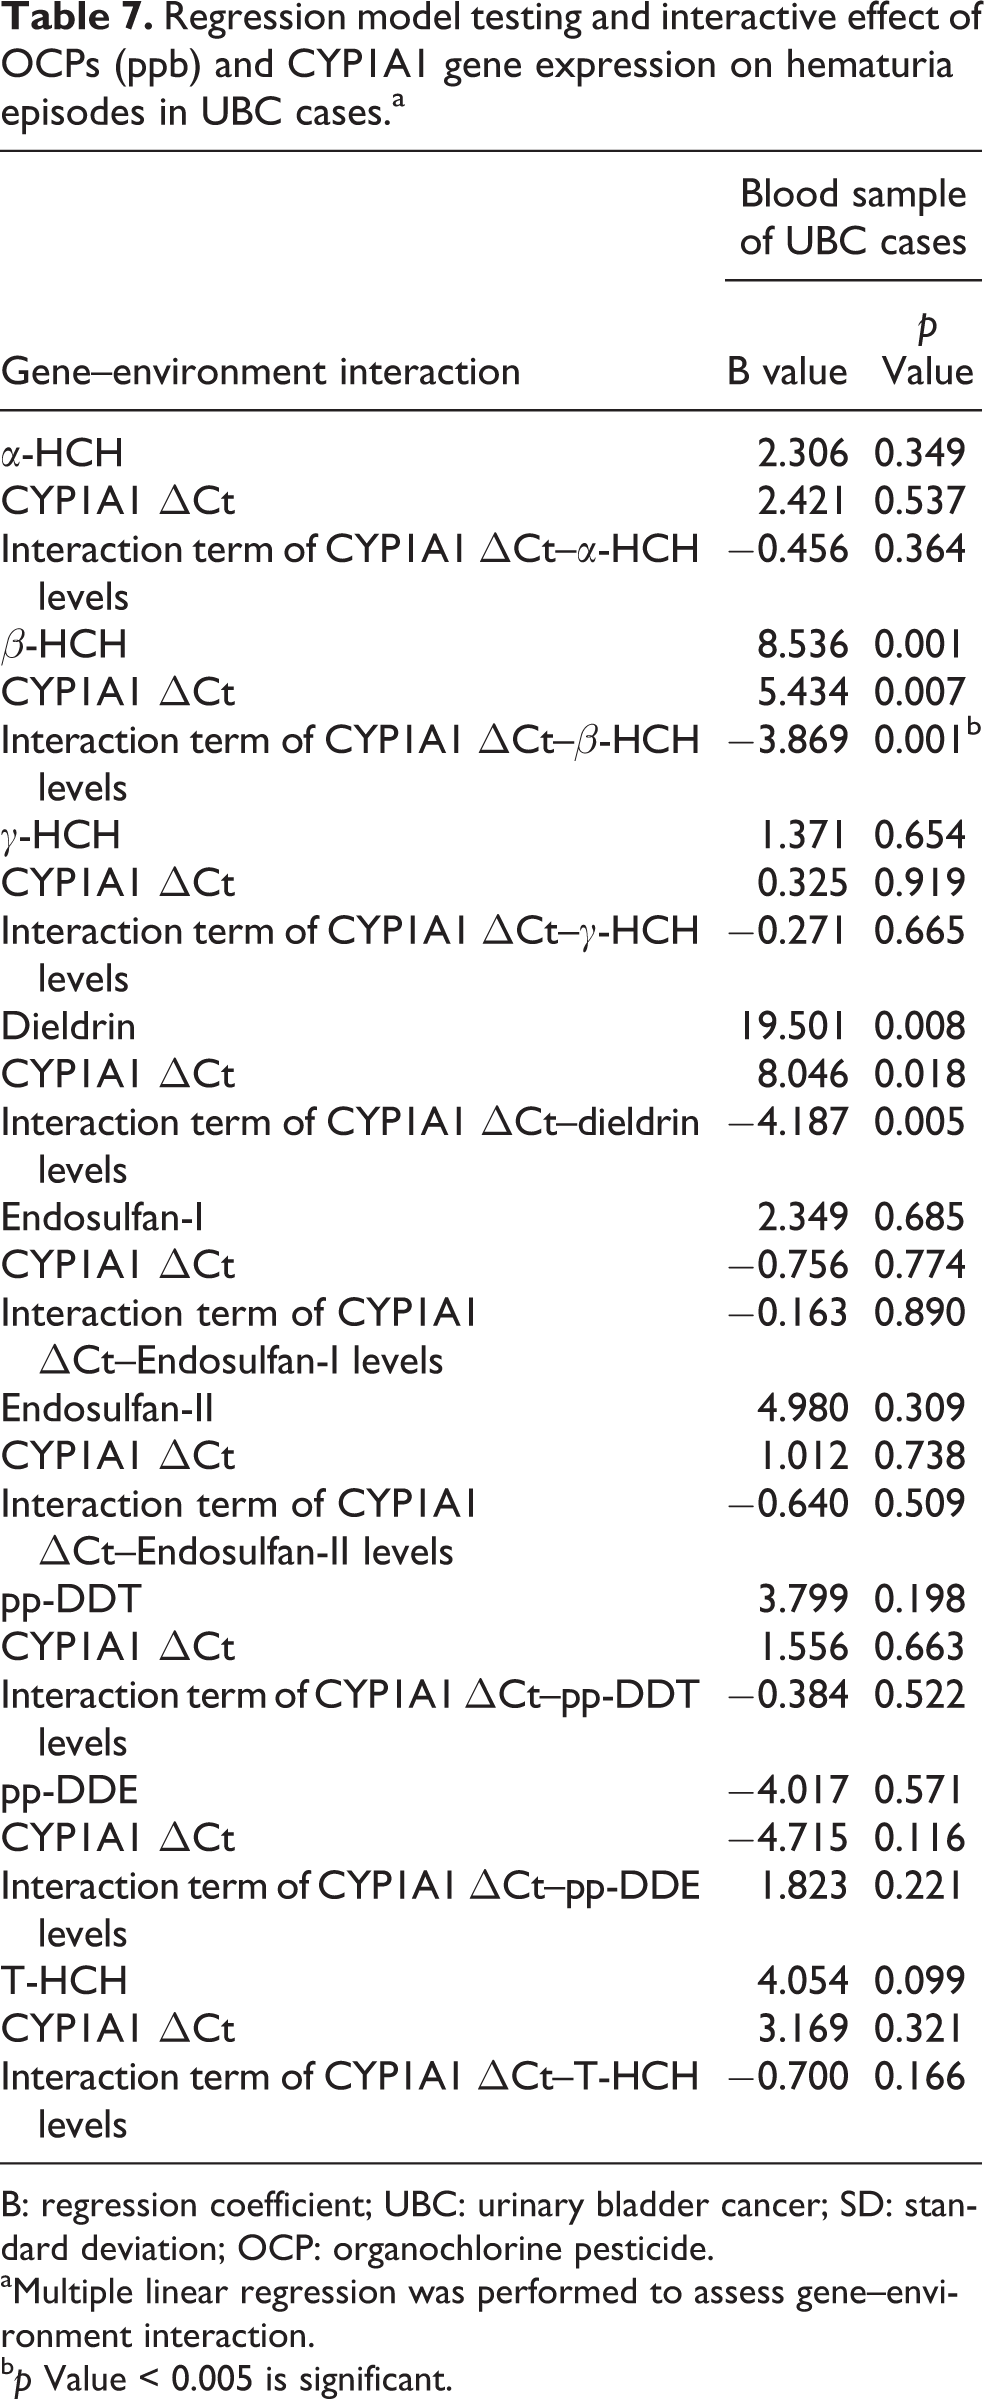
B: regression coefficient; UBC: urinary bladder cancer; SD: standard deviation; OCP: organochlorine pesticide.
aMultiple linear regression was performed to assess gene–environment interaction.
bp Value < 0.005 is significant.
Discussion
UBC is a common malignancy worldwide. While the incidence is higher in the developed countries, the incidence is increasing in the developing countries as well. There is a strong association of UBC with the environmental and genetic factors. This controlled study was performed with the primary objective to correlate the blood levels of OCPs and gene expression of xenobiotic metabolizing enzyme with the risk of UBC.
As UBC is related to environmental factors, its incidence increases with age, peaking in the eighth decade of life. 1 In the present study, the mean age of patients with UBC was 52.76 ± 13.58 years, comparable to other Indian study by Gupta et al. (mean age: 60.2 ± 4.4 years). 7 The mean age of the presentation of patients with UBC in India is lesser in comparison to their counterparts from the West, probably due to a higher exposure to environmental pollutants.
Numerous studies have established cigarette smoking as one of the major risk factors for UBC. Cigarette contains β-naphthylamine and tobacco-specific nitrosamines, which are established carcinogens. A study of bladder cancer epidemiology and prevention by Silverman et al. 8 established that cigarette smoking causes about 65% risk of bladder cancer in men and 20–30% in women. According to studies by Baris et al. 9 and Boffetta, 10 there is a 2–6 times greater chance of developing urothelial cancer in smokers. Another study by Lammers et al. 11 demonstrated that smoking leads to the development of high-grade recurrent bladder cancer. In the present study, smoking was found to be significantly associated with high grade of UBC. In our study, pelvic pain was found to be significantly associated with high grade of UBC. No study which could support and strengthen this result.
Indiscriminate use of OCPs continued till 1970s, after which most of them were banned. This has resulted in their significant accumulation in environment. Some of these pesticides are still used in India for the public health purpose. OCPs induce immunotoxicity and oxidative stress, leading to adverse health effects. 12 Due to their hormone disrupting potential, the role of OCPs in the causation of many cancers is well established. Calle et al. showed the association of OCPs with breast cancer and another study shows their association with prostate and lung cancer also. 13,14,15 One of our previous institutional studies has also shown increased levels of p,p′-DDE in prostate cancer. 12 A study of pesticides in UBC by Viel and Challier showed an increased level of OCPs in patients with UBC but similar mortality rates as normal population. 16 Our study has shown significantly raised serum levels of β-HCH, γ-HCH, T-HCH, and p,p′-DDT in cases of UBC as compared to controls. This study has also shown a significant association of β-HCH, T-HCH, and p,p′-DDT with high-grade UBC. The results are in agreement with another study in which high levels of OCPs were found to be associated with UBC. 17
To the best of our knowledge, only few studies have reported the role of gene expression in the risk of UBC. CYP1A1 is a phase I microsomal enzyme which is involved in the metabolism of environmental pollutants and pesticides in the body. Several polymorphisms of CYP1A1 have been found, corresponding to 15 different allelic variants believed to lead to variance of gene expression or mRNA stability. Putluri et al. showed downregulation in the expression of CYP1A1 and CYP1B1 in patients with bladder cancer. 18 As against this, Sutherland et al. showed the upregulation of CYP1A1 gene expression along with the downregulation of CYP1B1 and CYP1A2 in bladder cancer. 19 These findings are in agreement with the results of the present study as high mRNA expression of CYP1A1 gene was observed in UBC cases as compared to the controls. Ozturk et al. found no significant differences in CYP1A1 genotype frequencies between patients with bladder cancer and controls. 4 However, the same study showed significantly higher GSTM1 null genotype and CYP1A1 Val variant in control group than patients with bladder cancer. 4 Additionally, the CYP1A1 gene expression was significantly downregulated in patients with low-grade UBC as compared to high-grade UBC.
Hematuria is an important symptom present in cases of UBC. It is usually the presenting symptom and seen in almost all cases of UBC. The relation of hematuria with UBC is well established and known to all. So, keeping in view the abovementioned facts, multiple linear logistic regression was applied, taking hematuria episode as dependent variable to assess gene–environment interaction during this present study.
Gene–environment interaction reflects the complex interaction between an individual genetic makeup and environmental agents. This explains why some individuals have fairly low risk of developing diseases as a result of environmental insults, while others are much more susceptible. The present study aimed to explore the synergistic effect of CYP1A1 mRNA expression and nonoccupational exposure to OCPs considering the hematuria episodes as continuous variable. Previous studies including those from our laboratory have reported that exposure to harmful environmental chemicals and CYP and GST gene polymorphism confers an increased risk of adverse health outcomes, such as preterm delivery, fetal growth restriction, prostate cancer, UBC, and so on. 12,17,20 –23
In the present study, regression model testing is done between the mRNA expression of genes and pesticides level to check their interaction effect on hematuria episodes. It has been observed that there is a significant increase in hematuria episodes when ΔCt value of CYP1A1 is low, which reflects an increased mRNA expression and high β-HCH level (Table 7). A significant interaction term of regression model indicates that there is a possible role of gene–environment interaction in the causation/pathogenesis of UBC. The findings of the present study are supported by other study by Sharma et al., 2013 from our laboratory, in which it was shown that when GSTM1 and GSTT1 genotypes are absent, increasing level of pesticides increases the risk of UBC. All these studies support that the regression model testing method is one of the valid and relevant statistical tools to assess the role of gene–environment interaction in the etiology of disease. However, there is no study so far available in which such testing is done for UBC and gene expression among North Indian population or any other population in Indian context. This throws a new highlight in the field of toxicogenomics and one of the strengths of the study.
Evidences are also there which reveal the plausible role of gene–environment interaction in the etiopathogenesis of cancer. 24 In a study by Sinha et al., it has been mentioned that GSTM1 and GSTT1 genes may increase the risk of colon cancer when PAH exposure is there. 25 Similar example is also there with aldehyde dehydrogenase genes and risk of oropharyngeal and laryngeal cancer when alcohol exposure to the individual was present. 26 However, no such study is available for UBC. The present study is first of its kind in which the plausible role of gene–environment interaction is explored in the etiology of UBC through a statistical tool.
In conclusion, our study demonstrates the importance of gene and environmental factors in the context of UBC risk. Significantly higher levels of OCPs in UBC cases indicate the possible role of these compounds as one of the risk factors for UBC. Since both factors are reported to increase risk, individuals with higher levels of these “carcinogenic compounds” especially in “high-risk genotypes” might be more susceptible to UBC risk. Further epidemiological studies with larger population are needed to clearly elucidate the role of OCPs, gene expression, and genetic–environmental interaction in the genesis of UBC. This might be helpful in identifying subpopulation/individuals at higher UBC risk.
Footnotes
Acknowledgment
The authors are grateful to University College of Medical Sciences (Delhi University) for providing Intramural research grant for conducting this study under MS thesis program.
Declaration of Conflicting Interests
The author(s) declared no potential conflicts of interest with respect to the research, authorship, and/or publication of this article.
Funding
The author(s) received no financial support for the research, authorship, and/or publication of this article.