
Abstract
The aim of this study was to evaluate hepatic polyunsaturated fatty acids (PUFAs) and inflammatory response in an animal and cell model of endoplasmic reticulum (ER) stress. Rats were divided into control, tunicamycin (TM)-treated, and TM + tauroursodeoxycholic acid (TUDCA)-treated groups. Hepatic ER stress was induced by TM and the ER stress inhibitor TUDCA was injected 30 min before induction of ER stress. Liver THLE-3 cells were treated with TM and TUDCA was administered in advance to decrease cytotoxic effects. Necroinflammation was evaluated in liver sections, while cell viability was determined using a 3-(4,5-dimethylthiazol-2-yl)-2,5-diphenyltetrazolium bromide assay kit. ER stress was confirmed by immunofluorescence and Western blot analysis of C/EBP-homologous protein and 78-kDa glucose-regulated protein. Arachidonic acid (C20:4n-6), dihomo-γ-linolenic acid (C20:3n-6), eicosapentaenoic acid (C20:5n-3), and docosahexaenoic acid (C22:6n-3) in liver tissue and THLE-3 cells were determined by liquid chromatography tandem mass spectrometry (LC-MS/MS). Phospholipase A2 (PLA2), cyclooxygenase (COX), and prostaglandin E2 (PGE2) were measured in tissue and cell samples. Hepatic ER stress was accomplished by TM and was alleviated by TUDCA. TM treatment significantly decreased PUFAs in both liver and THLE-3 cells compared to controls. PLA2, COX, and PGE2 levels were significantly increased in TM-treated rats and THLE-3 cells compared to controls. TUDCA leads to a partial restoration of liver PUFA levels and decreased PLA2, COX, and PGE2. This study reports decreased PUFA levels in ER stress and supports the use of omega-3 fatty acids in liver diseases demonstrating ER stress.
Introduction
The presence of endoplasmic reticulum (ER) stress is an important contributing factor in various liver diseases, including alcoholic liver disease, nonalcoholic steatohepatitis, drug-induced liver injury, acute-on-chronic liver failure, and hepatocellular carcinoma. 1 Thus, investigating the ER stress response in both animal models and cell cultures can help to understand the pathology of these diseases.
Tunicamycin (TM) is a nucleotide sugar analog that inhibits UDP-N-acetylglucosamine:dolichol phosphate GlcNAc-1-P transferase which catalyzes the first step in protein glycosylation. It blocks N-linked glycosylation and induces ER stress by causing an accumulation of misfolded proteins in the ER. 2 Cells activate an adaptive mechanism known as the unfolded protein response to eliminate toxic protein components which relieves ER stress and restores protein homeostasis. 3 Studies show that TM is a rapid and efficacious inducer of ER stress in hepatocytes. TM is excellent in not only inducing ER stress but also mimicking the metabolic alterations associated with ER stress. 4 Previous studies have demonstrated that ER stress induced by TM leads to increased expression of cyclooxygenase-2 (COX-2), mediated through the NF-κB pathway. 5 Response to ER stress also leads to cytosolic phospholipase A2 activation and production of prostaglandin E2 (PGE2). 6,7
Tauroursodeoxycholic acid (TUDCA) is a hydrophilic bile acid administered to patients with cholestatic liver diseases. 8 Studies show that, as a chemical molecular chaperone, TUDCA can prevent unfolded protein response dysfunction and ameliorate ER stress. It improves protein folding capacity via the activation of transcription factor 6 and by assisting in the transfer of mutant proteins. 9 It also inhibits the phosphorylation of initiation factor 2α, which is normally activated by protein kinase RNA-like ER kinase. 9
Endoplasmic reticulum is a central site for lipid biogenesis, thus ER stress is likely to cause alterations in cellular lipid composition and synthesis. 10 Fatty acids synthesized de novo in the cytoplasm can be converted into long-chain polyunsaturated fatty acids (PUFAs) in the ER. Synthesis of omega-3 and omega-6 PUFAs occurs by sequential elongation and desaturation of linoleic acid (LA, C18:2n-6) and α-linolenic acid (ALA; C18:3n-3). 11 The addition of double bonds and acyl chains is accomplished by desaturases and elongases, respectively. These enzymes are localized in the phospholipid bilayer of the ER. 12
Although studies have shown that TM exposure leads to ER stress in the liver, changes in liver PUFA levels following TM-induced ER stress have not been investigated. This study was designed to determine changes in endogenous PUFA levels in rat liver and human liver THLE-3 cells treated with TM and investigate whether TUDCA attenuated TM-induced metabolic changes.
Materials and methods
Animals
All experimental protocols conducted on rats were performed in accordance with the standards established by the Institutional Animal Care and Use Committee at Akdeniz University Medical School. Male Wistar rats weighing 350–450 g were housed in stainless steel cages and given food and water ad libitum. Animals were maintained at 12-h light–dark cycles and a constant temperature of 23 ± 1°C at all times. Rats were randomly divided into control (n = 10), TM-treated (n = 10), and TM + TUDCA-treated (n = 10) groups. Hepatic ER stress was induced by intraperitoneal (i.p.) injection of 1 mg/kg body weight TM (Abcam, Cambridge, UK) as previously reported. 13,14 TM was prepared in dimethyl sulfoxide (DMSO; Calbiochem, EMD Bioscience Inc., La Jolla, California, USA) at a concentration of 0.52 mg/ml. The ER stress inhibitor TUDCA (EMD Millipore Corp., Billerica, Massachusetts, USA) was dissolved in saline and injected i.p. at a dose of 250 mg/kg body weight 30 min before hepatic induction of ER stress, as previously described. 15 The control group animals received an equal volume of i.p. DMSO and saline. The liver tissues were perfused and collected for evaluation 24 h after TM injection.
Cell culture and treatment conditions
The THLE-3 cell line is a human nonmalignant hepatocyte cell line, which was obtained from American Type Culture Collection (ATCC #CRL-11233, Manassas, Virginia, USA). THLE-3 cells were cultured in flasks precoated with a mixture of 0.01 mg/ml fibronectin (EMD Millipore Corp.), 0.03 mg/ml bovine collagen type I (Sigma-Aldrich, St. Louis, Missouri, USA), and 0.01 mg/ml bovine serum albumin (Sigma-Aldrich) dissolved in BEBM medium (Lonza, Walkersville, Maryland, USA). Cell lines were grown in BEGM media (Lonza, Walkersville, Maryland, USA) supplemented with 5 ng/ml epidermal growth factor, 70 ng/ml phosphoethanolamine (Sigma-Aldrich), 10% fetal bovine serum (Sigma-Aldrich), and 100 U of penicillin–streptomycin (Lonza). Cells were maintained in a humidified incubator at 37°C and a 5% CO2 atmosphere. The THLE-3 cells were passaged by trypsinization (2.5 g/L trypsin-0.2 g/L EDTA in Hank’s balanced salt solution; Sigma-Aldrich) every 7 days. Cells from passages 6 to 8 were used in the studies.
In most of the experiments, cells were treated with 10 μg/ml TM (Sigma-Aldrich) for 24 h to induce ER stress. The dose and duration of TM used to treat cells were based on the results of earlier studies. 16 TUDCA was administered as an ER stress inhibitor. In most of the experiments, cells were treated with 0.5 mM of TUDCA, administered 8 h before TM treatment.
Cell viability assay
Cell viability was measured using the colorimetric 3-(4,5-dimethylthiazol-2-yl)-2,5-diphenyltetrazolium bromide (MTT) assay kit (Millipore Corp.). Living cells reduced MTT to formazan which was quantified by measuring absorbance at 570 nm (MicroQuant plate reader; Bio-Tek Instruments Inc., Winooski, Vermont, USA). Cells were grown to confluence in 96-well plates and incubated with 1 µl/ml DMSO, 1–10 μg/ml TM, 0.1–5 mM TUDCA, or 10 μg/ml TM + 0.1–1 mM TUDCA for 18–48 h. Control cells were prepared in plates containing only medium. At the end of the incubation period, MTT was added to each well and incubation was carried out for 4 h at 37°C. Formazan production was expressed as a percentage of the values obtained from control cells.
Hepatic histopathological evaluation
Livers were fixed in 10% neutral buffered formalin solutions for 24 h. Standard histopathological techniques were used for tissue processing and preparation of paraffin blocks. Necroinflammation was evaluated in sections stained with hematoxylin–eosin using the Ishak-modified hepatic activity index system. 17 Total necroinflammation scores were calculated as the sum of the four categories of necroinflammation: periportal or periseptal interface hepatitis (0–4), confluent necrosis (0–6), focal (spotty) lytic necrosis, focal inflammation (0–4), and portal inflammation (0–4).
Tissue immunohistochemical staining
Liver tissues were fixed in 10% buffered formalin solution, washed in phosphate-buffered saline (PBS; pH 7.4), embedded in paraffin, and cut into 4-µm sections. For peroxidase staining, sections were deparaffinized, rehydrated, and washed with tris-buffered saline. Endogenous peroxidase activity was blocked by incubating tissue sections with 3% hydrogen peroxide for 5 min prior to application of the primary antibody. Primary antibody incubations were for 60 min at 25°C with rabbit polyclonal anti-78 kDa glucose-regulated protein (GRP78; 1:100, #ab53068 Abcam, Cambridge, Massachusetts, USA) or anti-C/EBP-homologous protein (CHOP/GADD 153; 1:200, # sc-575, Santa Cruz Biotechnology Inc., Santa Cruz, California, USA). The sections were washed three times in PBS and incubated with biotinylated anti-rabbit secondary antibody (1:400, #BA1000; Vector Laboratories, Burlingame, California, USA) diluted in dilution buffer for 1 h at room temperature. Tissues were washed and immunostained using the anti-polyvalent/HRP/DAB detection system (Spring Bioscience, Fremont, California, USA). Negative controls were performed by replacing the primary antibody with nonimmune serum followed by immunoperoxidase staining. The presence of a red-brown colored end product in the cytoplasm was indicative of positive staining. All stained tissue sections were visualized via light microscopy (Olympus IX81, Tokyo, Japan). To obtain a quantitative standard for immunostaining within the different experimental groups, morphometric analysis was performed as previously described. 18 The percentage of positive stained cells was scored as follows: 0, less than 5% of the cells/HPF (40×) are stained; 1, 5% to less than 30% of cells/HPF are stained; 2, 30% to less than 50% of cells/HPF are stained; 3, more than 50% of cells/HPF are stained. The intensity of staining within each counted cell was also scored as follows: 0, no staining; 1, weak staining (pale red-brown); 2, moderate staining (red-brown); 3, strong staining (dark red-brown). A final immunostaining score was obtained for all sections by adding the two scores.
Immunofluorescent staining
For immunofluorescence cell-imaging studies, 100,000 cells were plated on poly-
Western blot analysis
Liver tissue was homogenized and 3–5 × 10⁶ cells were sonicated in PBS buffer containing protease inhibitor cocktail (Sigma-Aldrich). Supernatants were stored at −80°C until analyzed. Proteins were denatured at 100°C in sample buffer (# 161-0737; BioRad Laboratories Inc., Hercules, California, USA) and separated on 12% mini-protean TGX precast electrophoresis gels (BioRad Laboratories Inc.). Resolved proteins were transferred to nitrocellulose membranes and incubated with rabbit polyclonal primary antibodies to the proteins of interest. Primary antibody incubations were for 1 h at room temperature with either GRP78 (1:300, #ab53068; Abcam, Cambridge, Massachusetts, USA); anti-CHOP/GADD 153 (1:200, # sc-575; Santa Cruz Biotechnology Inc.), and actin (1:1000, #AANO1; Cytoskeleton Inc., Denver, Colorado, USA). Horseradish peroxidase–conjugated goat anti-rabbit IgG (1:10,000 dilution; Zymed Laboratories, San Francisco, California, USA) was used as a secondary antibody, and immunoreactive proteins were visualized by chemiluminescence via ECL reagent (Amersham Pharmacia Biotech, Buckinghamshire, UK). All Western blots were quantified by densitometric analysis using NIH ImageJ 1.44p software.
Electrospray ionization mass spectrometry
Standards for arachidonic acid (AA; C20:4n-6), dihomo-γ-linolenic acid (DGLA; C20:3n-6), eicosapentaenoic acid (EPA; C20:5n-3), and docosahexaenoic acid (DHA; C22:6n-3) were purchased from Sigma-Aldrich. Deuterium-labeled AA-d8 internal standard (5, 6, 8, 9, 11, 12, 14, 15-AA-d8) was obtained from Santa Cruz Biotechnology. Solutions of AA, DGLA, EPA, DHA, and AAd8 standards were prepared in analytical-grade methanol (Merck, Darmstadt, Germany). An optimized multiple reaction monitoring (MRM) method was developed using ultra-fast liquid chromatography (UFLC) coupled with tandem mass spectrometry (MS/MS) as previously described. 19 A UFLC system (LC-20 AD UFLC XR, Shimadzu Corporation, Japan) was coupled to an LCMS-8040 triple quadrupole mass spectrometer (Shimadzu Corporation). Chromatographic separations were carried out using the Inertsil HPLC column (ODS-4, 2.1 9 100 mm, 3 lm; GL Sciences Inc., Tokyo, Japan) maintained at 40°C. DHA, EPA, AA, and DGLA were separated using a gradient elution with a flow rate of 0.45 ml/min. Mobile phase solvent A was 10 mM ammonium acetate (Sigma-Aldrich) in water and solvent B was acetonitrile (Sigma-Aldrich). Gradient program was solvent B, 70% (0 min), 90% (3 min), 100% (3.01–4 min), and 70% (4.01–8 min). MRM transitions and responses were automatically optimized for individual compounds in negative electrospray ionization (ESI). In the negative ESI–MS mode, the precursor and product m/z values for AA, DHA, EPA, DGLA, and AA-d8 are given in the results section. Responses to AA, DHA, EPA, and DGLA were optimized to a linear calibration range from 100 ng/ml to 30 μg/ml and a sample analysis time of 8 min.
Sample preparation for LC–MS/MS
Liver tissue was homogenized and 4–5 × 10⁶ cells were sonicated in 50 mmol/L sodium phosphate buffer (pH 7.4). Samples were centrifuged (10,000 g for 15 min at 4°C) and supernatants were stored at −80°C. Samples were prepared for LC–MS/MS analysis via a modified protocol as previously described. 20 Briefly, in a glass test tube, 200 µl of supernatant was added to 200 µl AA-d8 internal standard solution. One milliliter of acetonitrile/37% hydrochloric acid (Cayman Chemical, Ann Arbor, Michigan, USA) was added to the mixture in a 4:1 v/v. Tubes were capped with reusable Teflon liner screw caps and samples were hydrolyzed by incubating at 90°C for 2 h in a heating block (VLM, Bielefeld, Germany). After cooling down to room temperature, fatty acids were extracted with 2 ml of hexane. Samples were vortex-mixed for 20 s, left at room temperature for 5 min, and centrifuged at 3000 r min−1 for 1 min. The upper phase containing free fatty acids was transferred to glass tubes and evaporated at room temperature under a constant stream of nitrogen with height adjustable gas distribution unit (VLM). Fatty acids were dissolved in 200 µl methanol–water (180:20, v/v), filtered via 0.2-µm polytetrafluoroethylene syringe filters (Whatman; GE Healthcare Bio-Sciences, Pittsburgh, Pennsylvania, USA), and transferred to autosampler vials (Vertical Chromatography, Nonthaburi, Thailand).
Measurement of cytosolic phospholipase A2
Activity of phospholipase A2 (PLA2) was measured via a PLA2 assay kit (Abcam, Cat No: ab133090, Cambridge, Massachusetts, USA). Liver tissue was homogenized (per gram in 5 ml) and 4–5 × 10⁶ cells were sonicated in ice-cold 50 mmol/L sodium phosphate buffer (pH 7.4) containing 1 mM EDTA. Homogenates were centrifuged (10,000 g for 15 min at 4°C) and supernatants were stored at –80°C. Before performing the assay, low-molecular weight contaminants were removed from the samples using an ultra-filtration unit via centrifugation through a 10-kDa molecular mass cut-off filter (Amicon; Millipore Corp.) for 30 min at 25°C. Samples were reconstituted with 50 mmol/L sodium phosphate buffer (pH 7.4) containing 1 mM EDTA. Arachidonoyl thio-PC synthetic substrate was used to detect PLA2 activity. Hydrolysis of the arachidonoyl thioester bond releases a free thiol which was detected by 5,5′-dithiobis-(2-nitrobenzoic acid). One unit of enzyme activity was defined as the amount of enzyme that hydrolyzes 1 μmol of arachidonoyl thio-PC per minute at 25°C.
Measurement of COX activity
COX activity was measured using a fluorescent activity assay kit (Cayman Chemical) according to the manufacturer’s instructions. Liver tissue was homogenized (per gram in 5 ml) and 5 × 10⁶ cells were sonicated in 0.1 M ice-cold Tris-HCl buffer (pH 7.5) containing protease inhibitor cocktail (Sigma-Aldrich). Tissue homogenates were centrifuged at 10,000 g for 15 min at 4°C and supernatants were kept at –80°C until assayed. The COX activity assay kit measures enzyme activity fluorometrically by monitoring the appearance of resorufin at an excitation and emission wavelength of 530 and 585 nm, respectively. One unit of enzyme activity was defined as the amount of enzyme that caused the formation of 1 nmol of fluorophore per minute at 22°C.
Measurement of PGE2
PGE2 was measured in liver tissue samples by an enzyme immunoassay test kit (Cayman Chemical, Cat No: 514010) according to the manufacturer’s instructions. Liver tissues were weighed and homogenized in 0.1 M ice-cold phosphate buffer at pH 7.4 containing 1 mM EDTA and 10 μM indomethacin. Tissue homogenates were centrifuged at 10,000 g for 15 min at 4°C and supernatants were kept at –80°C until assayed. A standard curve of absorbance values of known PGE2 standards was plotted as a function of the logarithm of PGE2 standard concentrations (pg/ml) using the GraphPad Prism Software program for windows version 5.03 (GraphPad Software Inc., Chicago, IL, USA). PGE2 concentrations in the samples were calculated from their corresponding absorbance values via the standard curve.
Quantitative determination of PGE2 in THLE-3 culture media was done by a fluorescence polarization immunoassay kit (Enzo, catalog # ADI-920-001, Farmingdale, New York, USA) according to the manufacturer’s instructions. The plate was read at an emission wavelength of 535 nm, with excitation at 485 nm. The amount of signal was inversely proportional to the concentration of PGE2 in the standards or samples. A standard curve of fluorescence values of known PGE2 standards was plotted as a function of the logarithm of PGE2 standard concentrations (pg/ml) using the GraphPad Prism Software program for windows version 5.03 (GraphPad Software Inc). PGE2 concentrations in the samples were calculated from their corresponding fluorescence values via the standard curve.
Protein measurements
Protein concentrations were measured at 595 nm by a modified Bradford assay using Coomassie Plus reagent with bovine serum albumin as a standard (Pierce; Thermo Fisher Scientific, Roskilde, Denmark).
Statistical analysis
Statistical analysis was performed using SigmaStat statistical software version 2.0 (Sigma). Statistical analysis for each measurement is described in figure and table legends.
Results
Analysis of liver injury
Hepatic photomicrographs of representative rat from each group are shown in Figure 1. Necroinflammation scores of liver injury are given in Table 1. TM treatment resulted in significant inflammation and necrosis in rat livers. Rats treated with TM + TUDCA showed a significant decrease in hepatic necroinflammation score compared with the TM group.

Hematoxylin and eosin staining of liver sections. Hepatic photomicrographs of representative rat are shown from each of the experimental groups. Magnification: 20×. Bar, 200 µm.
Modified hepatic activity index: Necroinflammation scores.a
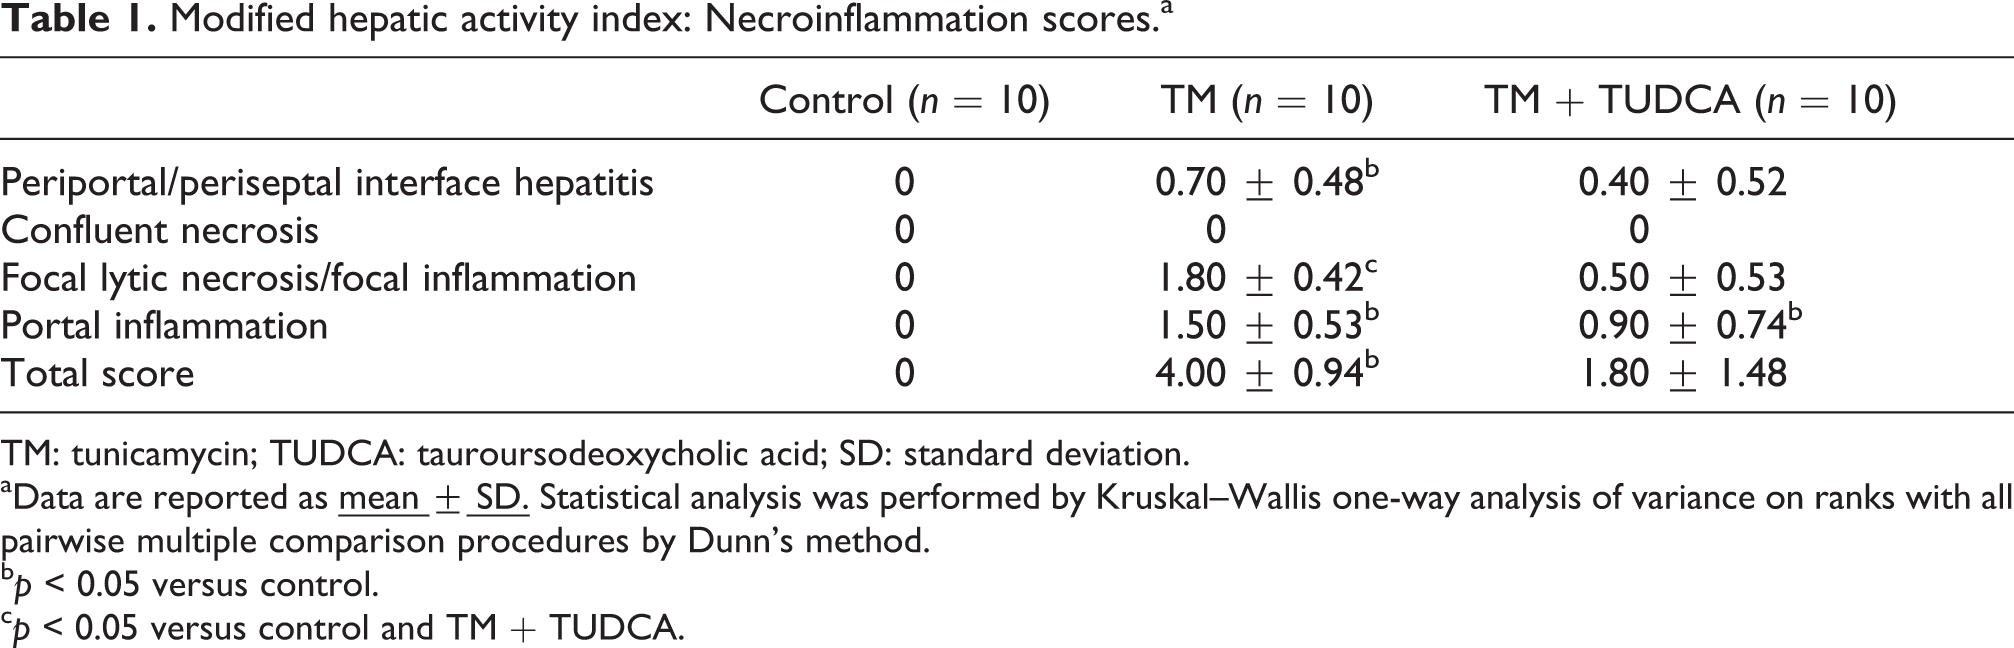
TM: tunicamycin; TUDCA: tauroursodeoxycholic acid; SD: standard deviation.
aData are reported as
cp < 0.05 versus control and TM + TUDCA.
Analysis of cell viability
Incubation of human hepatocytes with 1 µl/ml DMSO, 1μg/ml TM, and 1 mM TUDCA showed no cytotoxicity at 18–48 h, while 5 mM TUDCA and 10 μg/ml TM + 1 mM TUDCA were significantly cytotoxic (Figure 2(a)). Incubation of THLE-3 cells with 10 μg/ml TM for 24 and 48 h significantly decreased cell viability when compared to control and DMSO-treated groups (Figure 2(a)). Treatment of cells with 1 mM TUDCA and 10 μg/ml TM together caused a pronounced decrease in cell viability which was significantly greater than 10 μg/ml TM treatment alone (Figure 2(b)). Treatment of cells with 0.5 mM TUDCA 8 h before administering 10 μg/ml TM significantly decreased the cytotoxic effect of TM (Figure 2(c)). Therefore, 0.5 mM of TUDCA administered 8 h before TM treatment was applied to protect hepatocytes against ER stress.

Cell viability assessed by MTT assay. (a) Data shown are representative of six separate experiments and values are given as mean ± SD. Statistical analysis was performed by Kruskal–Wallis one-way ANOVA with all pairwise multiple comparison procedures done by Dunn’s test. *p < 0.05 versus control, DMSO, and TUDCA 1 mM. **p < 0.05 versus control and DMSO, (b) 24 h TUDCA and tunicamycin treatment together. TM: cells treated with 10 μg/ml tunicamycin. Data shown are representative of six separate experiments and values are given as mean ± SD. Statistical analysis was performed by one-way ANOVS with all pairwise multiple comparison procedures done by Tukey test. *p < 0.001 versus all TM-treated groups. **p = 0.002 versus TM, and (c) TUDCA applied 8 h before tunicamycin treatment. TM: cells treated with 10 μg/ml tunicamycin. Data shown are representative of eight separate experiments and values are given as mean ± SEM. Statistical analysis was performed by Kruskal–Wallis one-way ANOVA with all pairwise multiple comparison procedures done by Dunn’s test. *p < 0.001 versus all TM-treated groups. **p < 0.05 versus TM and TM + TUDCA 1 mM.
Induction of ER stress markers
The presence of ER stress in liver tissue was confirmed by increased intracellular levels of 78-kDa glucose-regulated protein (GRP78) (Figure 3(a) and (c)) and CHOP (Figure 3(b) and (c)). Treatment with the ER stress inhibitor TUDCA significantly decreased the expression of ER stress markers compared to the TM group (Figure 3(a) to (c)). Western blot analysis of GRP78 and CHOP in liver tissue confirmed increased levels of ER stress markers in TM-treated group (Figure 3(d) and (e)) and alleviation of ER stress by pre-treatment with TUDCA (Figure 3(d) and (e)).

Liver ER stress markers (a) Immunostaining of 78-kDa glucose-regulated protein (GRP78), (b) C/EBP-homologous protein (CHOP) in the liver. Photomicrographs of representative rat are shown from each experimental group. Magnification: 20×. Bar, 200 µm, (c) Immunostaining scores of GRP78 and CHOP. Values are mean ± SD, n = 6. Statistical analysis for GRP78 was performed by one-way analysis of variance with all pairwise multiple comparison procedures done by Tukey test. Statistical analysis for CHOP was by Kruskal–Wallis one-way analysis on ranks. All pairwise multiple comparisons were done by Dunn’s Method. *p < 0.001 versus control. #p < 0.01 versus TM, (d) representative Western immunoblots for ER stress markers GRP78 and CHOP in the liver, and (e) the band density of GRP78 and CHOP blots were estimated by ImageJ software. Data shown are representative of three separate experiments and values are given as mean ± SD. Statistical analysis was performed by one-way analysis of variance with all pairwise multiple comparison procedures done by Tukey test. *p < 0.001 versus control. #p < 0.01 versus TM.
Immunofluorescence staining of GRP78 and CHOP in human hepatocytes showed a marked increase of ER stress at 24 h by 10 μg/ml TM treatment (Figure 4(a) and (b)). Pre-treatment of THLE-3 cells with the ER inhibitor TUDCA (0.5 mM) significantly reduced expression of the analyzed ER stress markers following TM (10 μg/ml) treatment (Figure 4(a) and (b)). Western blot analysis of GRP78 and CHOP in liver cells confirmed increased levels of ER stress markers in TM-treated groups (Figure 4(c) and (d)) and alleviation of ER stress by pretreatment with TUDCA (Figure 4(c) and (d)).
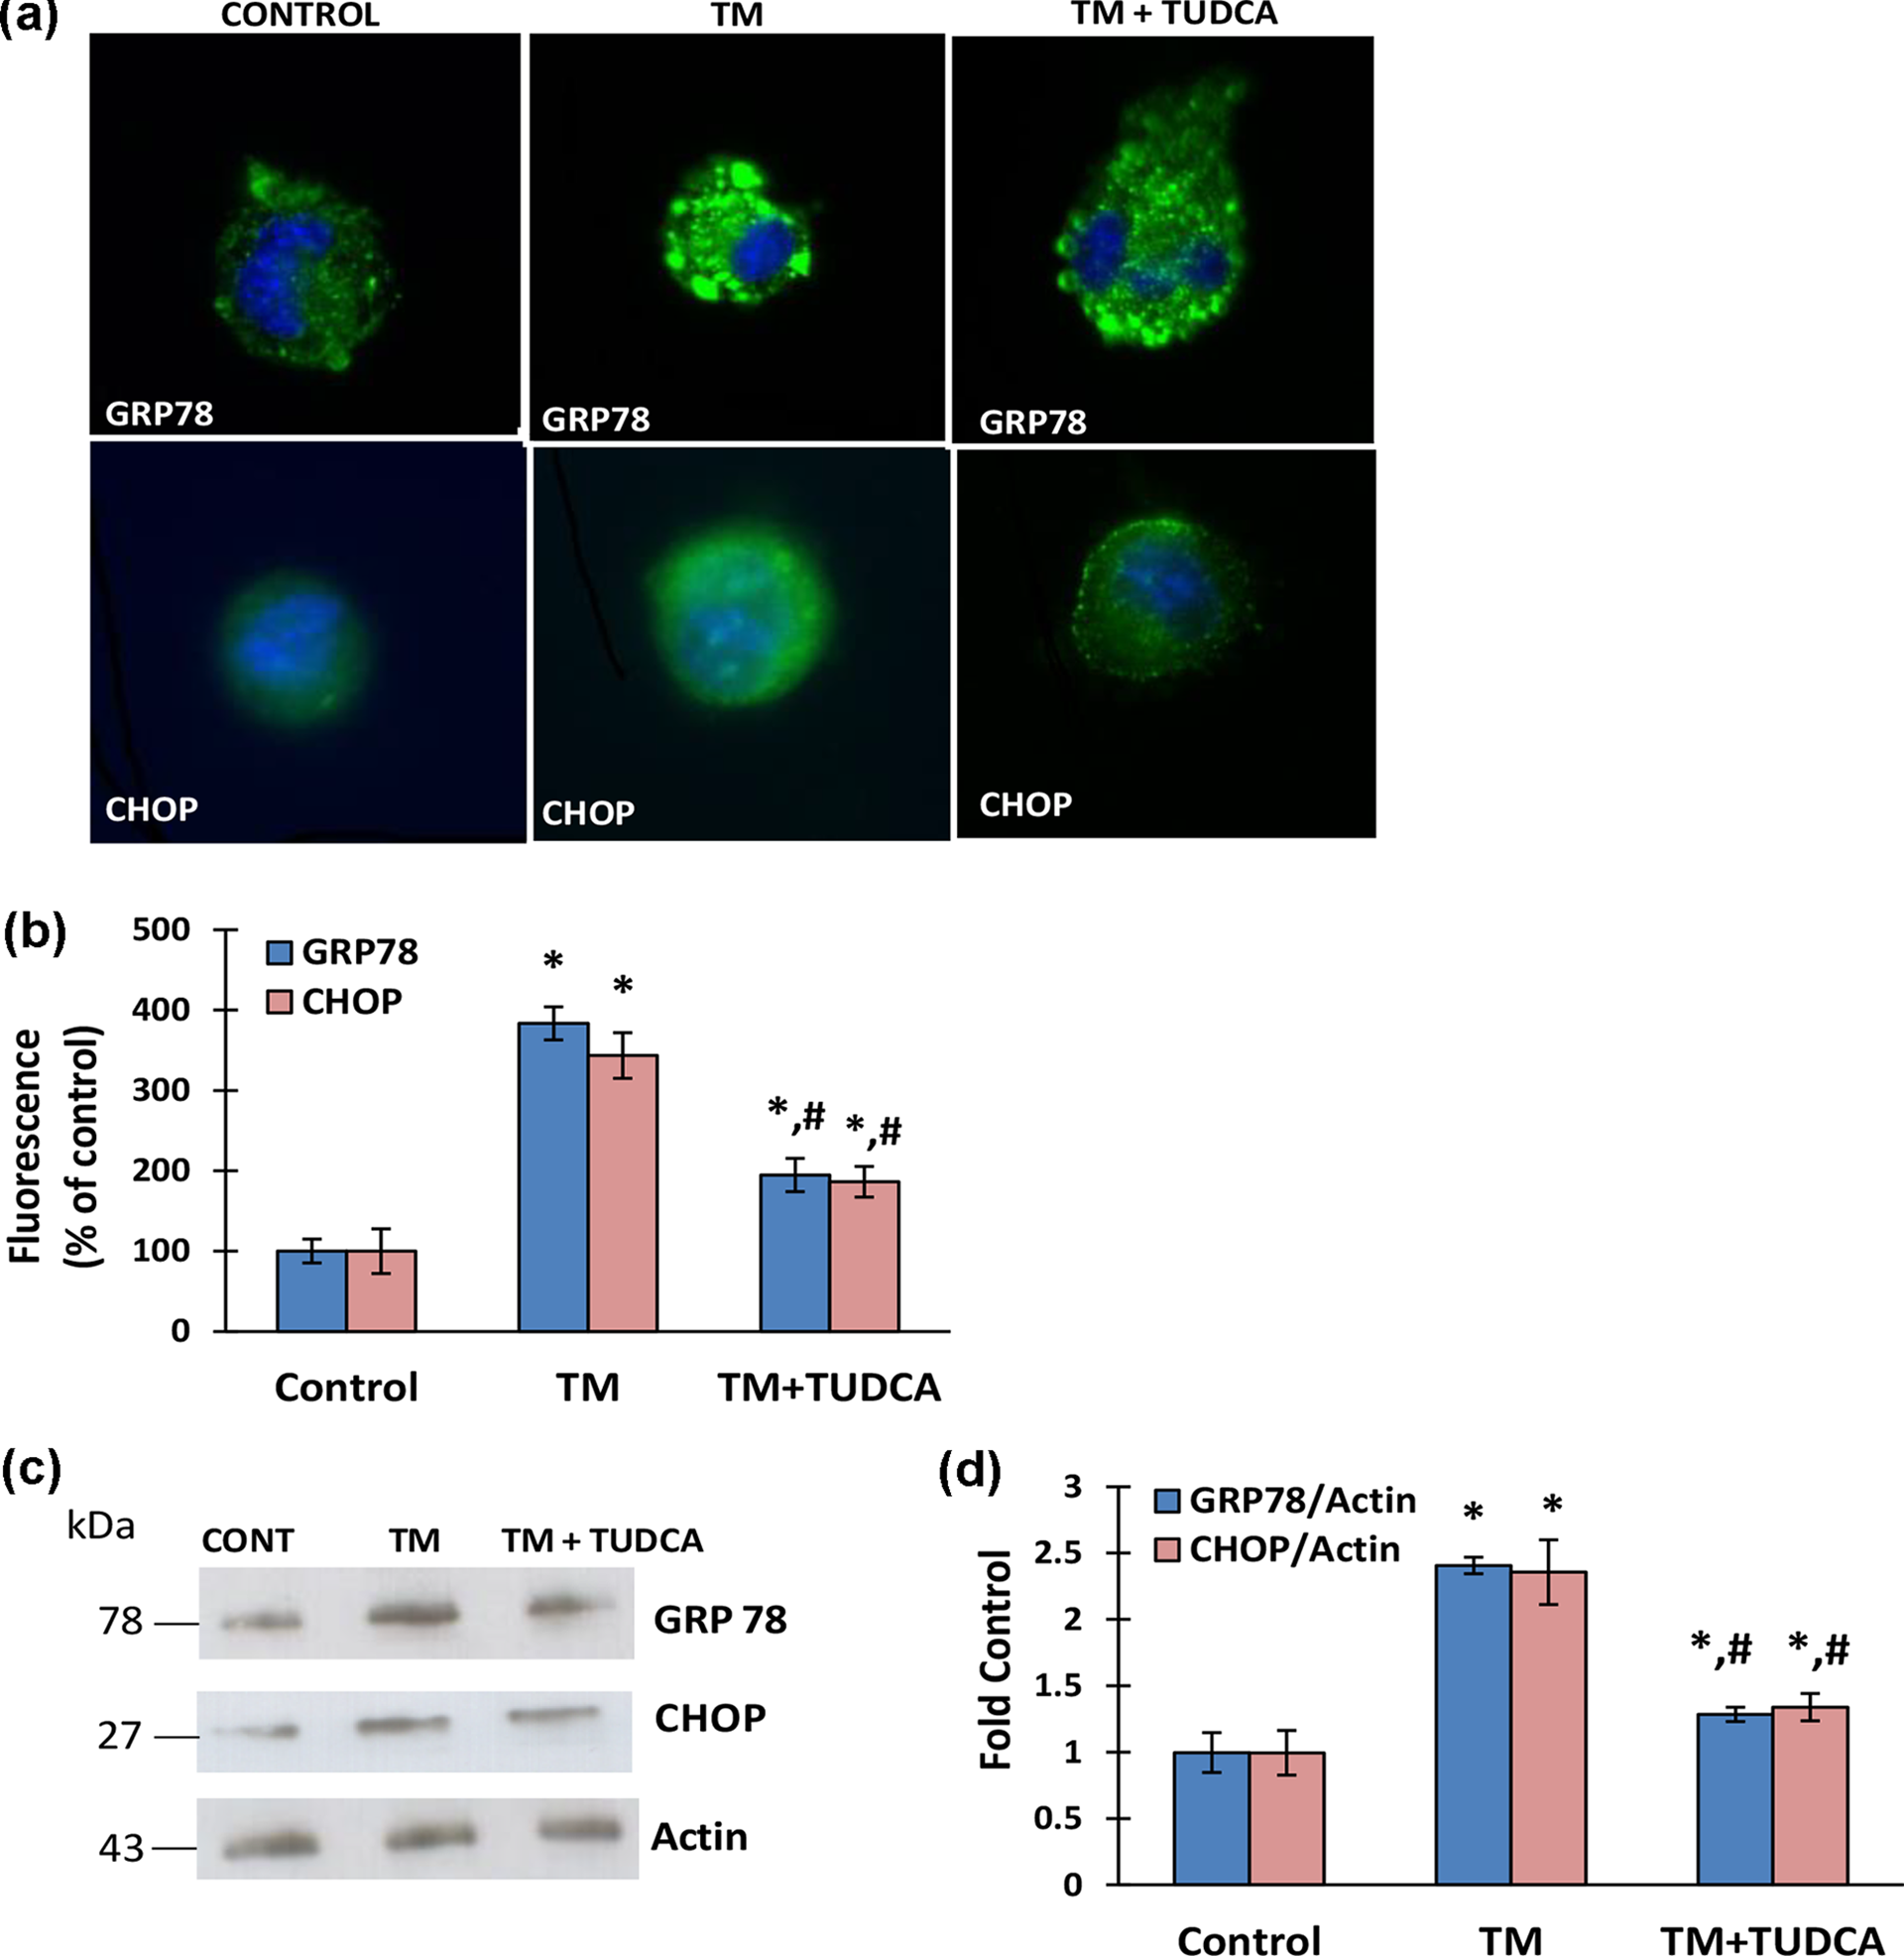
ER stress markers in human liver THLE-3 cells. TM (10 μg/ml) incubations were carried out for 24 h in all experiments. In the TM + TUDCA group, 0.5 mM of TUDCA was administered 8 h before TM treatment. (a) Representative photomicrographs of GRP78 and CHOP immunofluorescent staining in THLE-3 cells (40× magnifications), (b) quantitation of fluorescence staining of GRP78 and CHOP. Data shown are representative of three separate experiments and values are given as mean ± SD. Statistical analysis was performed by one-way analysis of variance with all pairwise multiple comparison procedures done by Tukey test. *p < 0.001 versus control. #p < 0.01 versus TM, (c) representative Western immunoblots for ER stress markers GRP78 and CHOP in THLE-3 cells, and (d) the band density of GRP78 and CHOP blots were estimated by ImageJ software. Data shown are representative of three separate experiments and values are given as mean ± SD. Statistical analysis was performed by one-way analysis of variance with all pairwise multiple comparison procedures done by Tukey test. *p < 0.001 versus control. #p < 0.01 versus TM.
Levels of PUFAs
Levels of endogenous PUFAs measured in liver tissue are given in Table 2. DGLA, AA, EPA, and DHA levels were significantly decreased in TM-treated group compared to control and TM + TUDCA groups. Pretreatment with TUDCA significantly increased all measured PUFAs in TM-treated rats. No significant difference was found in PUFA levels between control and TM + TUDCA groups. A significant increase was observed in AA/EPA ratio in TM and TM + TUDCA-treated groups compared to control. Pre-treatment with TUDCA caused a nonsignificant decrease in AA/EPA ratio following TM treatment.
Analysis of PUFAs in liver tissue.a
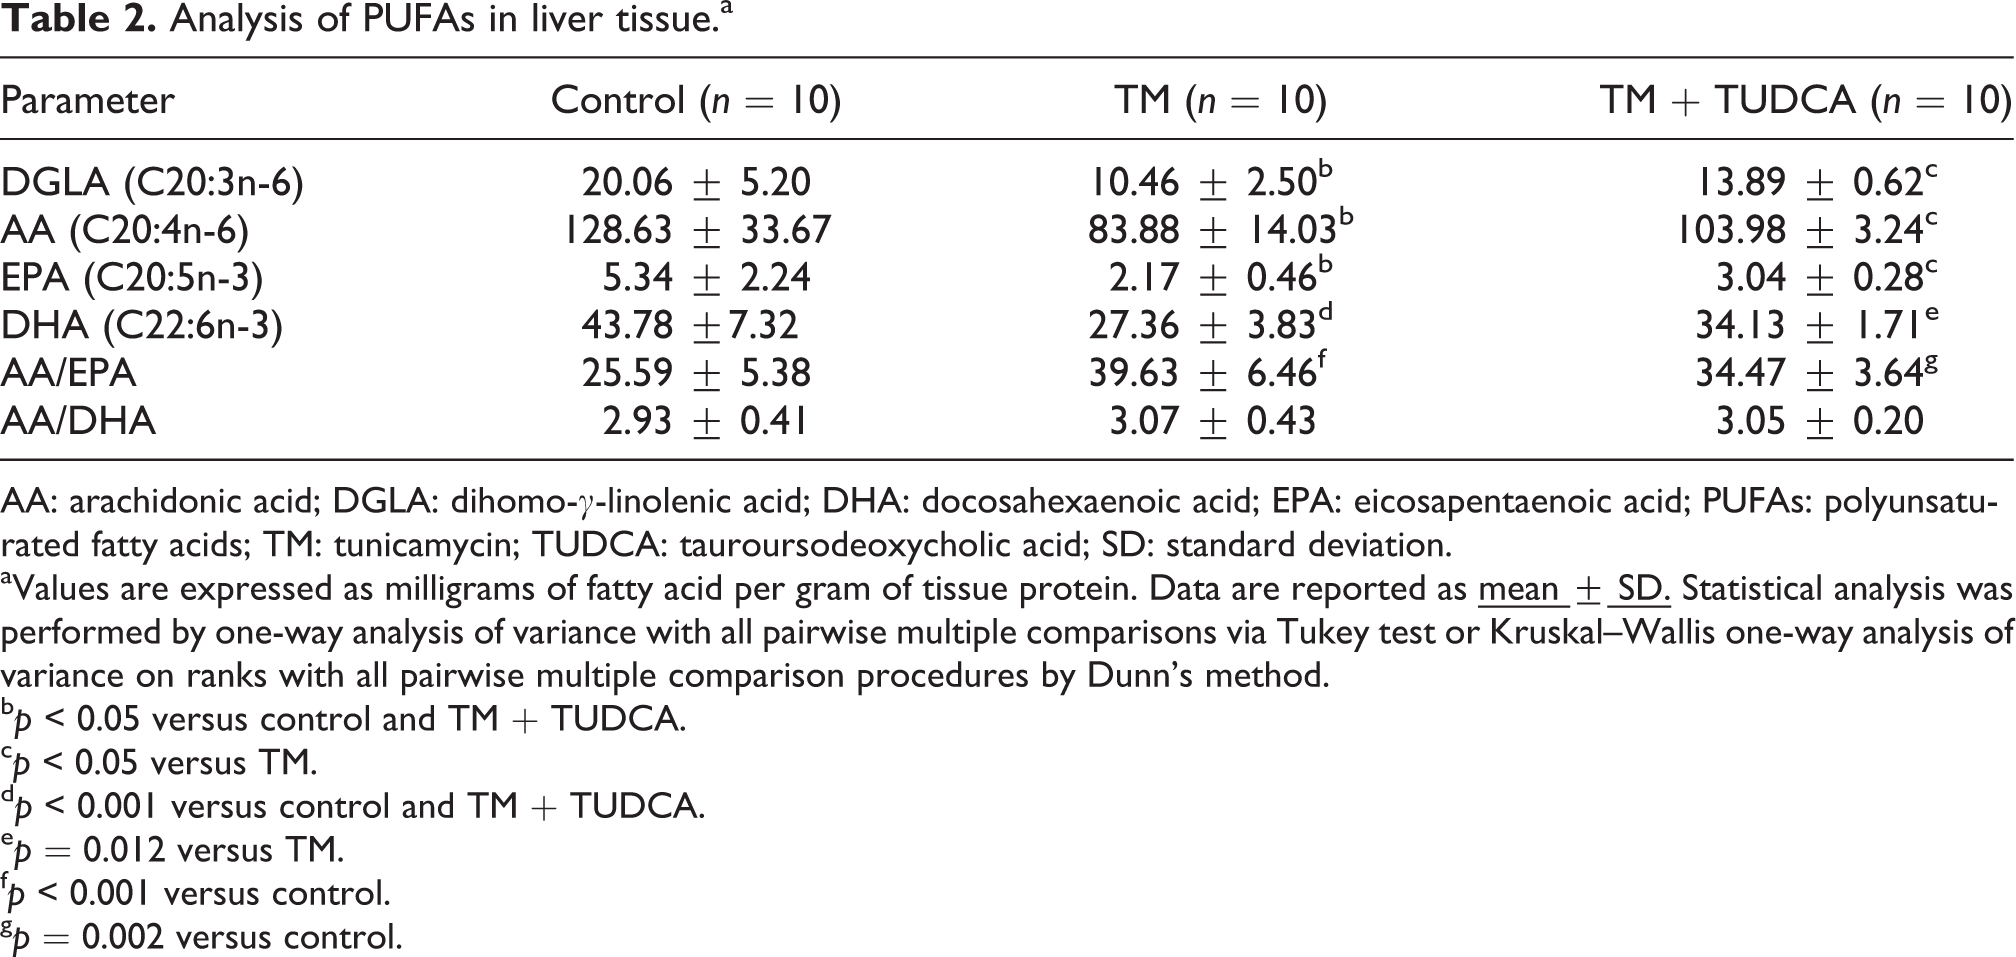
AA: arachidonic acid; DGLA: dihomo-γ-linolenic acid; DHA: docosahexaenoic acid; EPA: eicosapentaenoic acid; PUFAs: polyunsaturated fatty acids; TM: tunicamycin; TUDCA: tauroursodeoxycholic acid; SD: standard deviation.
aValues are expressed as milligrams of fatty acid per gram of tissue protein. Data are reported as
bp < 0.05 versus control and TM + TUDCA.
cp < 0.05 versus TM.
dp < 0.001 versus control and TM + TUDCA.
ep = 0.012 versus TM.
fp < 0.001 versus control.
gp = 0.002 versus control.
Levels of endogenous PUFAs measured in human hepatocytes are given in Table 3. DGLA, AA, EPA, and DHA levels were significantly decreased in TM-treated hepatocytes compared to control. Omega-6 levels (DGLA and AA) were also significantly decreased in TM + TUDCA group compared to control. No significant difference was found in omega-3 PUFA levels (EPA and DHA) between control and TM + TUDCA groups. A significant decrease was observed in AA/EPA and AA/DHA ratio in TM-treated group compared to control.
Analysis of PUFAs in liver THLE-3 cells.a
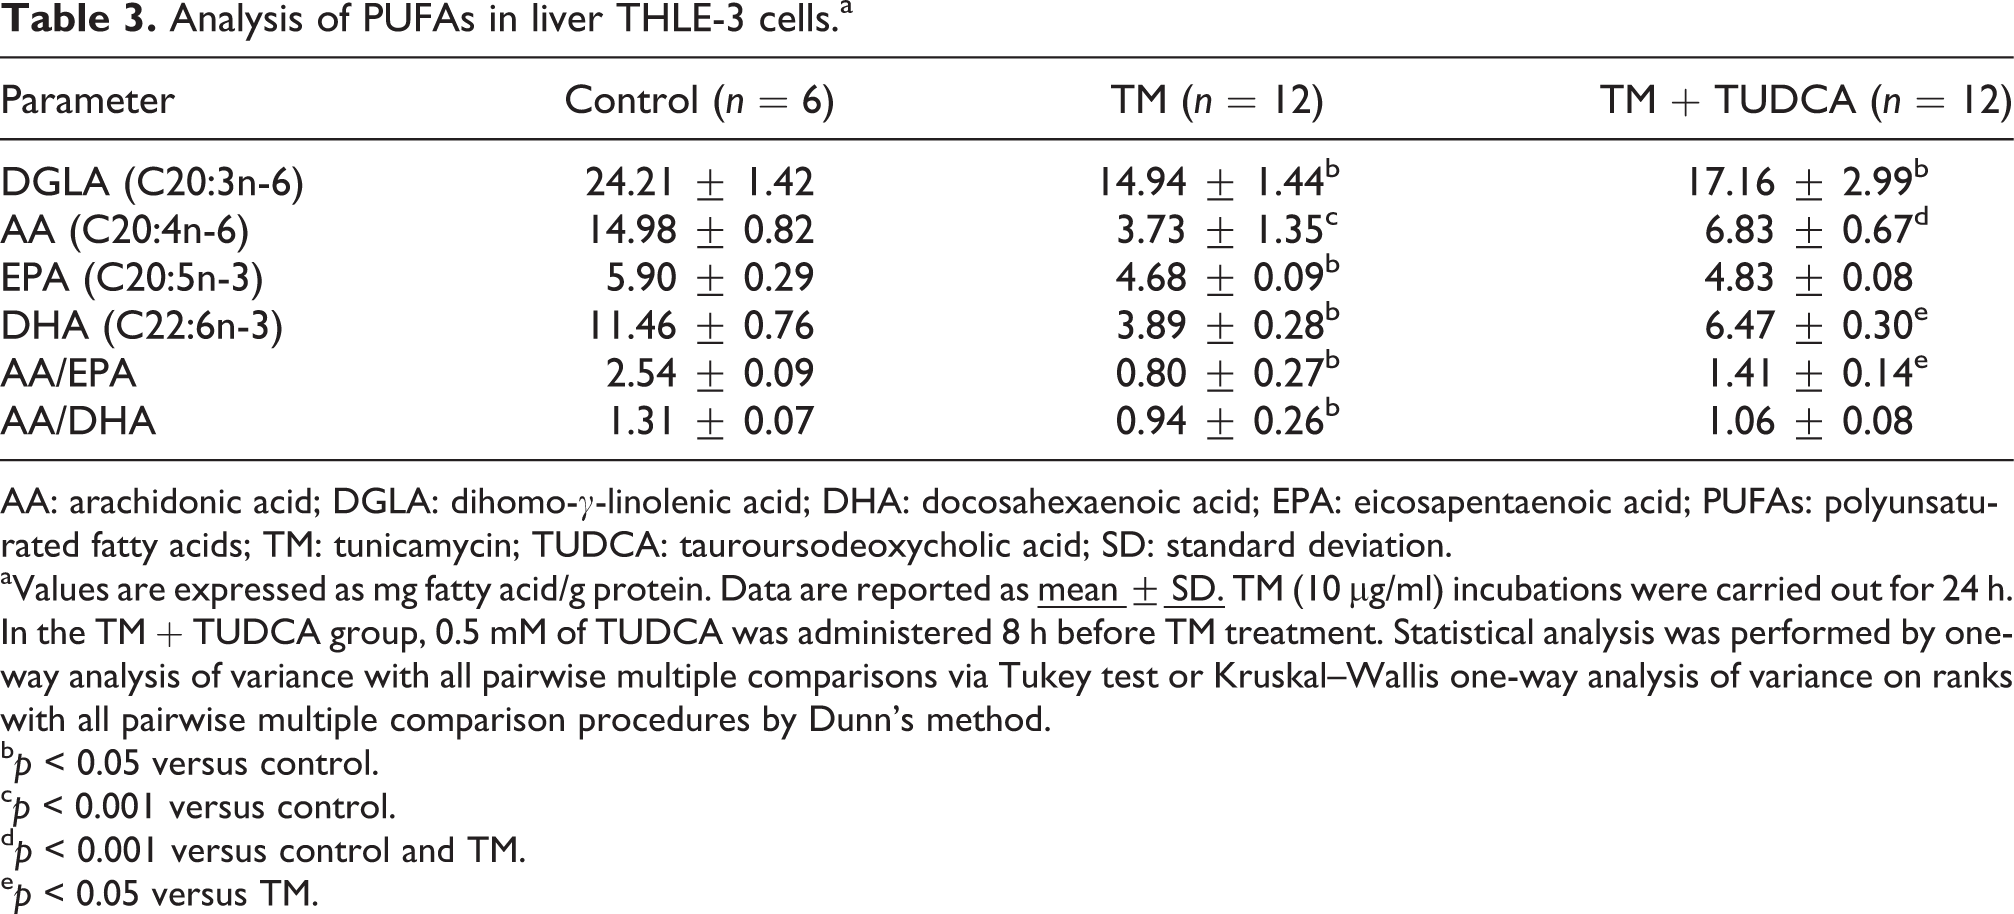
AA: arachidonic acid; DGLA: dihomo-γ-linolenic acid; DHA: docosahexaenoic acid; EPA: eicosapentaenoic acid; PUFAs: polyunsaturated fatty acids; TM: tunicamycin; TUDCA: tauroursodeoxycholic acid; SD: standard deviation.
aValues are expressed as mg fatty acid/g protein. Data are reported as
bp < 0.05 versus control.
cp < 0.001 versus control.
dp < 0.001 versus control and TM.
ep < 0.05 versus TM.
PLA2, COX, and PGE2 levels
Liver tissue cytosolic PLA2, total COX, and PGE2 levels were significantly increased in the TM group compared to control and TM + TUDCA groups. Pretreatment with TUDCA significantly decreased PLA2, total COX, and PGE2 levels in liver tissue (Table 4).
PLA2, COX, and PGE2 levels.a

COX: cyclooxygenase; PGE2: prostaglandin E2; PLA2: phospholipase A2; TM: tunicamycin; TUDCA: tauroursodeoxycholic acid; SD: standard deviation.
aData are reported as
bp < 0.05 versus control and TM + TUDCA.
cp < 0.05 versus control.
dp < 0.001 versus control and TM + TUDCA.
ep < 0.001 versus control.
fp = 0.014 versus control.
Cytosolic PLA2, total COX, and PGE2 levels were also significantly increased in TM-treated human hepatocytes compared to control. Pretreatment with TUDCA significantly decreased PLA2 levels in human hepatocytes. The observed decrease of COX and PGE2 levels via TUDCA pretreatment was not significant in THLE-3 cells compared to TM group (Table 4).
Discussion
This study measured endogenous DGLA (C20:3n-6), AA (C20:4n-6), DHA (C22:6n-3), and EPA (C20:5n-3) levels in rat liver and human hepatocyte cell line following TM treatment. This study makes the novel observation that injection of 1 mg/kg body weight TM in rats and 10 μg/ml TM incubation of human hepatocytes for 24 h results in significantly decreased omega-3 and omega-6 PUFA levels and leads to significantly increased activity of cPLA2, COX, and PGE2 levels. It also shows that TUDCA increased PUFA levels and reduced cPLA2, COX, and PGE2 levels in liver tissue of TM-treated rats.
The results of this study demonstrated that TM directly damages hepatocytes in vivo and acts as a hepatotoxin in cell cultures (Figures 1 and 2). These findings are consistent with previous reports showing hepatotoxicity of TM both in vivo and in vitro. 21,22 When injected in vivo, TM caused acute hepatic damage observed at intervals up to 72 h post-injection. 21 A periportal pattern of hepatocellular damage, with death of many hepatocytes, was consistently observed by 72 h. We have similarly observed periportal hepatitis, focal inflammation, and focal lytic necrosis at 24 h following TM treatment (Table 1).
Accurate modeling of ER stress in vivo and in vitro is important for understanding the development and pathology of liver diseases such as alcoholic liver disease, nonalcoholic steatohepatitis, drug-induced liver injury, acute-on-chronic liver failure, and hepatocellular carcinoma, all of which ER stress is involved. 1 Using both animal and cell models of study, we aimed to determine the efficiency of the major ER stress inducer TM 4 and the ER stress inhibitor TUDCA 9 in recapitulating and alleviating the ER stress response, respectively. Our cell culture experiments showed that TM worked as a rapid and effective inducer of ER stress in human hepatocytes. The in vivo animal model demonstrated that TM was exceptional in not only triggering ER stress but also inducing the metabolic alterations associated with ER stress such as increased cPLA2, 6 COX, 5 and PGE2 levels. 6
TM acts by triggering ER stress through the inhibition of protein glycosylation. 2 The dose of TM administered to rats and human hepatocytes in this study was determined with reference to previous studies designed to investigate the effects of ER stress in animal models 13,14 and in vitro cells cultures. 16 In agreement with previous studies, we found that TM potently induced key ER stress proteins GRP78 and CHOP at the given dose and duration (Figures 3 and 4).
The observed decrease in liver tissue and hepatocyte PUFA levels (Tables 2 and 3) suggests that ER stress suppresses long-chain PUFA synthesis by desaturases and elongases localized in the phospholipid bilayer of the ER. 12 Mammalians can synthesize many fatty acids except the two essential PUFAs which include LA (C18:2n-6) and ALA (C18:3n-3). 23 LA is the precursor of omega-6, while ALA is the precursor of omega-3 series of PUFAs. 24 Even though LA and ALA cannot be synthesized in humans, they can be metabolized to other PUFAs by the addition of double bonds and acyl chains via desaturases and elongases, respectively. 24 AA (C20:4n-6) and EPA (C20:5n-3) can be metabolized to eicosanoids via COX and lipoxygenase (LOX) pathways. The metabolism of DHA (C22:6n-3) via LOX can also yield resolvins and protectins that display potent anti-inflammatory properties and are recognized in the resolution of inflammation. 25 It is known that eicosanoids derived from omega-6 PUFAs have proinflammatory and immunoactive functions, whereas eicosanoids derived from omega-3 PUFAs have anti-inflammatory properties, attributed to their ability to inhibit the formation of omega-6 PUFA-derived eicosanoids. 25 Hence, increased AA to EPA ratio observed in our animal model indicates more precursor for the synthesis of highly inflammatory eicosanoids. The more pronounced decrease of AA in human hepatocytes leads to a decrease in AA to EPA and AA to DHA and did not mimic in vivo conditions observed in our animal model.
We have observed that cPLA2 activity measured in TM-treated liver homogenates and human hepatocytes was significantly higher compared to control and TUDCA groups (Table 4). Accumulating evidence has revealed that cPLA2 plays an important role in ER stress. 6,7 PLA2 degrades cell membrane phospholipids and plays an important role in the synthesis of proinflammatory lipid mediators such as AA (C20: 4n-6) and cytokines during ER stress. 6 PLA2 comprises a large group of enzymes that include secretory (sPLA2), cytosolic PLA2 (cPLA2), and calcium-independent PLA2 families. 26 These enzymes hydrolyze the phospholipid bond at the sn-2 position. Cytosolic PLA2 and calcium-independent PLA2 are localized inside the cell and involved in the breakdown of intracellular membranes, whereas sPLA2 is secreted during inflammatory events. 26
Activity of COX, the initial enzyme of prostaglandin synthesis, was increased in both liver tissue and cell culture following TM treatment (Table 4). These findings are in agreement with previous reports. 5 COX is the rate-limiting enzyme in the production of prostanoids from AA. Research has showed that the COX/prostanoid pathway is activated in hepatic diseases and liver stress reaction, such as alcoholic liver disease, 27 liver fibrogenesis, 28 viral hepatitis C, 29 and liver ischemic/reperfusion injury 30 causing liver damage manifested as inflammation, necrosis, and fatty liver. In agreement with increased liver COX activity, we have also measured significantly increased liver PGE2 levels following TM treatment (Table 4). AA is a precursor of PGE2 synthesis which is produced during inflammatory responses.
We have observed that pretreatment with TUDCA significantly decreased ER stress markers GRP78 and CHOP protein levels in both liver tissue and human hepatocyte cell cultures (Figures 3 and 4). In unstressed cells, GRP78 works as a chaperone within the ER. When unfolded proteins accumulate, GRP-78 releases three ER transmembrane proteins and this initiates the three branches of the unfolded protein response signaling cascade. 3 TUDCA acts as a potent chemical chaperone in the treatment of ER stress-associated diseases by inhibiting the unfolded protein response. 31 TUDCA inhibits the activation of the early signaling steps in the three branches of unfolded protein response, preventing the formation and binding of activated transcription factors to the GRP78 promoter for transcriptional activation. 31
We have seen that pretreatment with TUDCA increased omega-6 and omega-3 PUFA levels and attenuated inflammatory pathway in liver tissue following TM treatment (Tables 2 to 4). These observations are in agreement with studies reporting the beneficial effect of TUDCA as an anti-inflammatory agent. 32 TUDCA has also been shown to act as a potent inhibitor of apoptosis by interfering with the mitochondrial pathway of cell death, inhibiting oxygen-radical production, and caspase activation. 33
In summary, we report that TM treatment results in significantly decreased PUFA levels and leads to significantly increased activity of cPLA2, COX, and PGE2 levels in rat liver and human hepatocytes. We also show that TUDCA increases PUFA levels and alleviates cPLA2, COX, and PGE2 levels in liver tissue of TM-treated rats.
Footnotes
Declaration of Conflicting Interests
The author(s) declared no potential conflicts of interest with respect to the research, authorship, and/or publication of this article.
Funding
The author(s) disclosed receipt of the following financial support for the research, authorship, and/or publication of this article: This study was supported by a grant (#214S223) from The Scientific and Technological Research Council of Turkey (TUBITAK).