
Abstract
Suberoylanilide hydroxamic acid (SAHA) exerts marked anticancer effects via promotion of apoptosis, cell cycle arrest, and prevention of oncogene expression. In this study, serum metabolomics and artificial intelligence recognition were used to investigate SAHA toxicity. Forty rats (220 ± 20 g) were randomly divided into control and three SAHA groups (low, medium, and high); the experimental groups were treated with 12.3, 24.5, or 49.0 mg kg−1 SAHA once a day via intragastric administration. After 7 days, blood samples from the four groups were collected and analyzed by gas chromatography–mass spectrometry, and pathological changes in the liver were examined using microscopy. The results showed that increased levels of urea, oleic acid, and glutaconic acid were the most significant indicators of toxicity. Octadecanoic acid, pentadecanoic acid, glycerol, propanoic acid, and uric acid levels were lower in the high SAHA group. Microscopic observation revealed no obvious damage to the liver. Based on these data, a support vector machine (SVM) discrimination model was established that recognized the metabolic changes in the three SAHA groups and the control group with 100% accuracy. In conclusion, the main toxicity caused by SAHA was due to excessive metabolism of saturated fatty acids, which could be recognized by an SVM model.
Introduction
Histone deacetylase (HDAC), one of the most important enzymes for the regulation of cellular functions, is associated with various hematologic and solid malignancies. 1,2 Suberoylanilide hydroxamic acid (SAHA), also known as vorinostat, is an HDAC inhibitor that targets most human classes 1 and 2 HDAC enzymes. SAHA has excellent oral bioavailability and exerts prominent anticancer activity by promoting apoptosis and cell cycle arrest and preventing oncogene expression. 3 Moreover, SAHA can inhibit the proliferation and angiogenesis of endothelial cells by downregulating the expression of angiogenesis-related genes 4 and enhancing the expression of tumor necrosis factor–related apoptosis-inducing ligand death receptors DR4 and DR5 in human leukemia cell lines. 5
Due to these characteristics, SAHA was the first HDAC inhibitor approved by the Food and Drug Administration and licensed in 2006 for the treatment of cutaneous T-cell lymphoma. 6,7 However, the clinical efficacy of SAHA has only been tested in patients suffering from hematologic and solid tumor malignancies. 8 In addition, the efficacy of SAHA combined with other treatments is currently being investigated in various diseases. 9
However, like other antineoplastic agents, SAHA has side effects, including fatigue, diarrhea, anorexia, and dehydration, which are dose dependent and vary among individuals. Patients treated orally with 300 mg SAHA twice a day for 3 weeks experienced significant thrombocytopenia. 10 When the dose was increased to 400 mg twice a day, the major toxicities were dehydration fatigue, malaise, vomiting, and thrombocytopenia. 11 Since SAHA is a relatively new anticancer drug, few studies have focused on its toxicity.
Metabolic profiling is a useful tool for toxicity analysis as it provides a unique mechanistic perspective on response to toxicity. 12–15 This technique has been widely applied in recent years to biomarker and drug discovery, 16 metabolic fingerprinting in drug discovery, 17 and to investigations of systematic metabolic response to toxins 18 and the associated mechanisms. 19 Gas chromatography–mass spectrometry (GC–MS) is a very effective overall analysis technique due to its high sensitivity and separation efficiency. In addition, the ion suppression observed in liquid chromatography–mass spectrometry is minimal in GC–MS. The identification of metabolites using a commercial mass spectra library is also easier than other techniques. 20 To date, no studies have used metabolic analyses to evaluate toxicity in response to SAHA. The primary goal of this study was to use GC–MS to determine serum metabolic changes in rats in response to SAHA treatment.
Support vector machine (SVM) is a popular artificial intelligence technique that is based on the Vapnik–Chervonenkis dimension theory. It allows for the mapping of sample vectors into a nonlinear, high-dimensional feature space, which can be used to solve nonlinear classification and regression problems. 21,22 This method has been applied for the analysis of metabolomic data and is superior to partial least squares discriminate analysis (PLS-DA) in terms of predictive accuracy. Compared with PLS-DA, SVM results in a better predictive model with fewer features. 23 Therefore, SVM was applied to investigate the relationship between toxicity response and dosage using a discrimination model in this study.
Methods
Reagents
SAHA (purity, >98%) was generously provided by the Shanghai Institute of Pharmaceutical Industry (Shanghai, China). N-methyl-N-(trimethylsilyl) trifluoroacetamide and trimethylchlorosilane (TMCS) were both purchased from Sigma-Aldrich (St. Louis, MO, USA). Methylhydroxylamine hydrochloride and pyridine were from Aladdin Industrial, Inc. (Shanghai, China). HPLC-grade acetonitrile and n-heptane were purchased from Tedia Reagent Company (Shanghai, China).
Instruments
An Agilent 6890N-5975B GC–MS and HP-5ms (0.25 mm × 30 m × 0.25 mm) were used for analysis (Agilent, Santa Clara, California, USA). The GC oven was initially set at 80°C and maintained for 5 min. The temperature was then gradually increased to 260°C at a rate of 10°C min−1 and maintained at 260°C for 10 min. MS detection was conducted in the electron impact (EI) mode with an electron energy of 70 eV and then in full-scan mode with an m/z of 50–550, using splitless mode injection.
Animal studies
Forty Sprague-Dawley rats (male, 220 ± 20 g) were purchased from Shanghai SLAC Laboratory Animal Co., Ltd. Animals were housed under natural light–dark cycle conditions and a controlled temperature (22°C) at Wenzhou Medical University Laboratory Animal Research Center. All experimental procedures were approved by the Wenzhou Medical University Administration Committee of Experimental Animals.
Experimental animals
The 40 rats were randomly divided into a control group and three SAHA-treated groups (low, medium, and high). The rats in the low, medium, and high SAHA groups were intragastrically administered 12.3, 24.5, or 49.0 mg kg−1 of SAHA, respectively, for 7 days; control rats were given saline.
Serum samples from all groups were collected from the caudal vein at 8 am on day 9, which was 2 days after SAHA or saline administration. The blood samples were collected and centrifuged at 8500 r min−1 for 10 min. The serum was then separated and stored at −80°C until use.
After blood collection, the rats were anesthetized with 10% chloral hydrate at a dose of 20 mg kg−1 by intraperitoneal injection. The livers were rapidly removed and immersed in 4% w/v formaldehyde for pathological examination.
Blood sample preparation
To prepare serum samples for GC–MS analysis, the serum was first thawed at room temperature before adding 250 µL acetonitrile into 100 µL serum. The mixture was vortexed for 30 s and then centrifuged at 14,900 × g for 10 min at 4°C with a Beckman Allegra 64R centrifuge. The supernatant (150 µL) was transferred into a GC vial and evaporated to dryness under a stream of nitrogen gas using a pressure blowing concentrator. Fifty microliters of methylhydroxylamine hydrochloride (15 mg mL−1 in pyridine) was added, and methoximation was then performed at 70°C for 24 h. Subsequently, 50 µL N-methyl-trimethylsilyltrifluoroacetamide (MSTFA) with 1% TMCS as the catalyst was added and maintained at 70°C for another hour and then vortexed after adding 150 µL n-heptane. 24 After centrifugation at 14,900 × g for 10 min, the supernatant (1 µL) was injected into the GC–MS system for analysis.
A quality control (QC) strategy was applied to monitor the variability between each analytical batch and to ensure the data quality. 20,25 The QC sample was prepared by mixing the serum from the SAHA and control groups in equal parts. The QCs were then processed together with the samples using the same method.
Liver sample preparation
After the livers were immersed in 4% w/v formaldehyde for 48 h, they were removed, dehydrated overnight, and embedded in paraffin. Paraffin sections (4-µm-thick) were then sliced and dewaxed with xylene three times for 10, 5, and 5 min. The sections were washed with ethyl alcohol solutions (100, 95, 90, and 85%) for 1 min and with water for 2 min. The liver paraffin sections were then stained with hematoxylin and eosin (H&E) using a hydrochloric acid alcohol solution and 1% ammonia. After staining with H&E, the sections were washed with water for 1 min and then 85, 90, 95, and 100% ethyl alcohol for 1 min each. The liver sections were then cleared in xylene and coverslipped with resin. Liver morphology was observed using a light microscope.
Data processing and recognition
Before performing multivariate analyses, the GC–MS metabolite peaks were normalized to the total sum of the spectrum. All data were recorded in Microsoft Excel and processed through principal component analysis and PLS-DA using SIMCA-P 11.5 software (Umetrics, Umea, Sweden). PLS-DA was used to identify the differences in serum composition among the different groups. The corresponding loading plots were used to identify which variables contributed to the separation of samples on the score plot, where each variable (point) represented a metabolite.
Metabolites that strongly contributed to the classification were chosen based on the variable importance for project values (VIP > 1). Metabolites that changed significantly were further identified using similarity searches in the NIST 2005 Mass Spectral Library (National Institute of Standards and Technology, Gaithersburg, Maryland, USA). Statistical analyses were conducted using SPSS software (version 13.0; SPSS, Chicago, Illinois, USA). An independent sample t-test was used to analyze the differences in metabolite levels between two groups.
SVM discrimination model
The target data were set as (xi ; yi ), where i = 1, 2…, n, xi Є Rd is an input vector, yi is the corresponding output, a constant pointing the class to which that point xi belongs, n is the number of training data, and d means the number of dimensions of input data, that is, the metabolites in serum. In this study, the three SAHA groups and the control group were defined as 1 and 2, respectively.
The Gaussian radial basis function (RBF) kernel was selected for SVM classification, which can be expressed as

where g is a kernel parameter that exerts a strong impact on model performance and specifies the radius of the RBF. To optimize the SVM parameters, c and g, the genetic algorithm was used, in which crossover, random mutations, and selection procedures can be applied to generate better models or solutions from an original sample. The SVM model was developed in MATLAB 2011a (MathWorks, Natick, Massachusetts, USA) using the LibSVM package.
Results
Analytical characteristics of global profiling methods
The typical GC–MS metabolic profile of a serum sample is shown in Figure 1. There were 121 metabolic features identified from the GC–MS analyses after pretreatment. The reproducibility of the metabolic features was investigated using six QC samples. The GC–MS analysis showed that more than 70% of the metabolic features had a CV% (coefficient of variance) of no more than 25%. The serum endogenous metabolites were identified using the NIST 2005 Mass Spectral Library.

Typical gas chromatography–mass spectrometry total ion chromatogram of rat serum after intragastric administration of suberoylanilide hydroxamic acid (SAHA).
Changes in serum metabolites
The metabolic changes between the three SAHA groups and control group are listed in Table 1. We found that the most noticeable change in blood metabolites was urea (VIP = 4.23723), followed by
Summary of the changes in relative levels of metabolites in rats after intragastric administration of SAHA.a
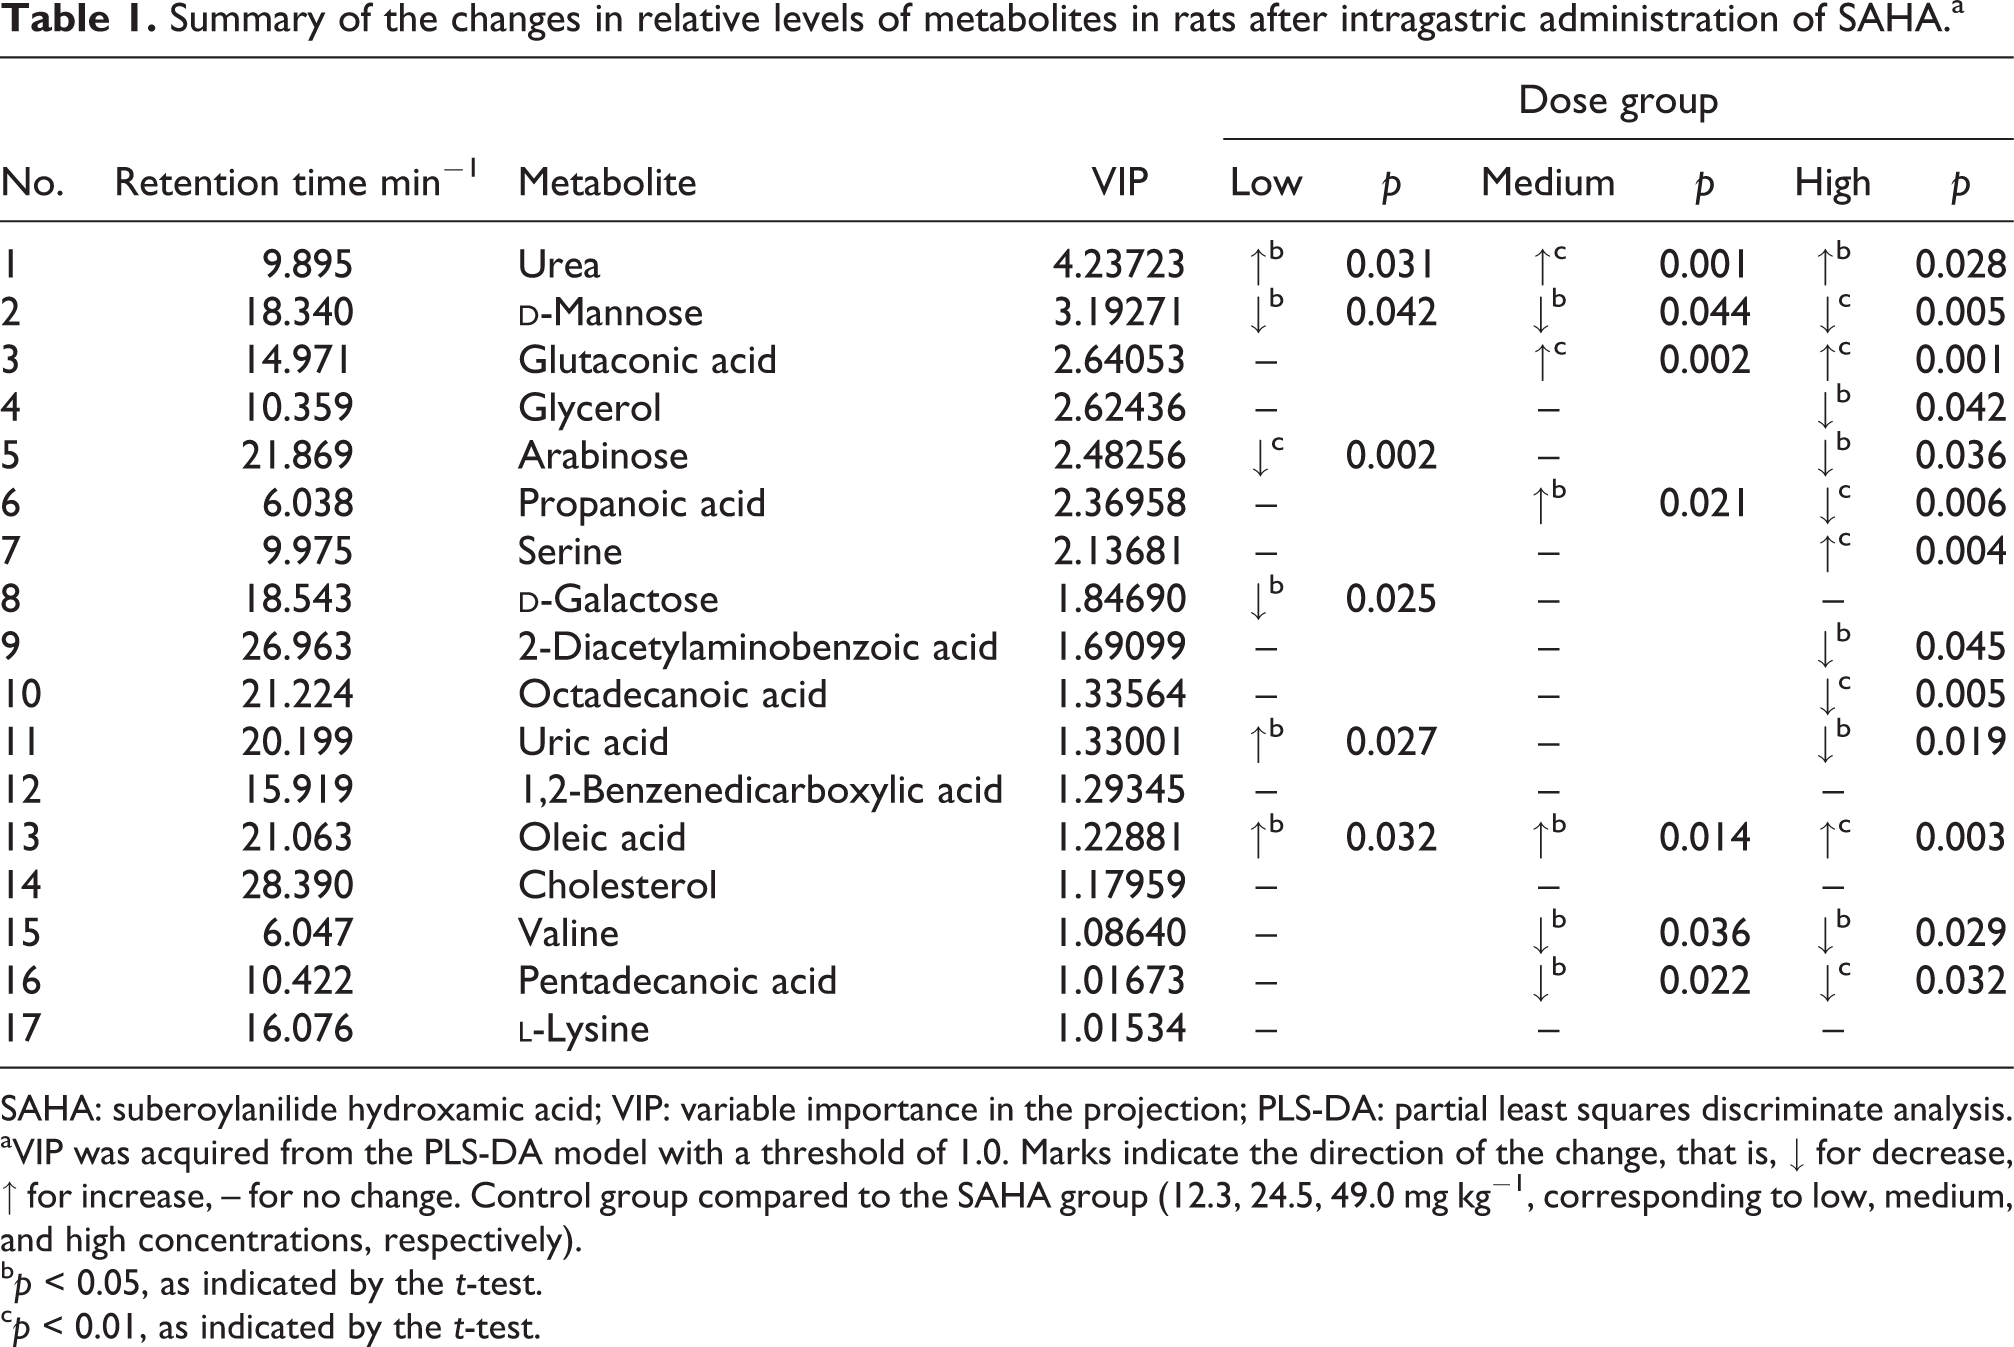
SAHA: suberoylanilide hydroxamic acid; VIP: variable importance in the projection; PLS-DA: partial least squares discriminate analysis.
aVIP was acquired from the PLS-DA model with a threshold of 1.0. Marks indicate the direction of the change, that is, ↓ for decrease, ↑ for increase, – for no change. Control group compared to the SAHA group (12.3, 24.5, 49.0 mg kg−1, corresponding to low, medium, and high concentrations, respectively).
b p < 0.05, as indicated by the t-test.
c p < 0.01, as indicated by the t-test.
The concentrations of most metabolites were significantly different in the high SAHA group compared with the control group (p < 0.05). Compared with the control group, the metabolism of glycerol, arabinose, propanoic acid, 2-diacetylaminobenzoic acid, octadecanoic acid, uric acid, valine, pentadecanoic acid, and
The SAHA treatment–induced metabolic changes were dose dependent, and the rats in the control group were analyzed by PLS-DA as shown in Figure 2. The PLS-DA score chart indicated that the first principal components in the SAHA groups (low, medium, and high) were distinguishable from the control group. The PLS-DA three-dimensional score chart (Figure 2(b)) indicated that the rats in the SAHA group were more distinguishable from the rats in the control group than when the two-dimensional score was used (Figure 2(a)).

PLS-DA score results from rat serum samples (a), PLS-DA three-dimensional (3-D) score results from rat serum samples (b) after intragastric administration of SAHA (low 12.3 mg kg−1, medium 24.5 mg kg−1, and high 49.0 mg kg−1); control (class 1), low (class 2), medium (class 3), high (class 4), and the corresponding load diagram (c). PLS-DA: partial least squares discriminate analysis.
Morphological changes in the liver
There were no significant morphological differences observed in the livers of SAHA-treated rats compared with the control rats. The hepatic lobules and portal areas were intact, and the hepatic cord radiated out in all directions in all four groups. There was no obvious swelling or necrosis of hepatocytes in any of the groups. Although there seemed to be a gradual increase in the size of the sinusoid space with SAHA treatment, the liver structure was clear, with liver cells arranged tightly along with central veins, and no infiltrating inflammatory cells. Therefore, no obvious morphological damage occurred in the SAHA groups (Figure 3).

Morphological changes of the liver in the control group (a) and three SAHA groups at low 12.3 mg kg−1 (b), medium 24.5 mg kg−1 (c), and high 49.0 mg kg−1 (d) doses (hematoxylin–eosin, ×100).
The SVM model of discrimination
Based on the retention time and GC–MS spectra data, 121 peaks were detected in serum samples within 30 min. The SAHA groups and control group were represented as a 121-dimensional feature vector and normalized by parameter premnmx into the interval of [−1, 1]. We included all 121-dimensional feature vectors in the SVM model and separated data from the SAHA groups and the control groups. The SAHA groups were coded as 1, while the control group was coded as 2. The results of the best c, g, cross validation accuracy, classification accuracy, and mean squared error of regression are shown in Table 2.
Discrimination parameters of support vector machine between different groups.

IND: infinitely small.
Discussion
Metabolomics, which focuses on low-molecular-weight endogenous metabolites in biological samples, is one of the newest “omics” areas. 27 This newly emerging approach has been used to investigate metabolic changes induced by environmental or endogenous factors. 28 The use of metabolomics has shown promising results in health-related fields, including in disease diagnosis and in the investigation of drug-induced metabolic changes. 29,30 This technique is also used to assess drug toxicity and to identify toxicity-related biomarkers 31,32 In this study, biomarkers related to the toxicity of SAHA were investigated by GC–MS, a method commonly used in metabolomics. The most notable finding was increased blood urea levels.
Increased blood urea levels can be an indicator of decreased glomerular filtration rate, a high-protein diet, gastrointestinal hemorrhage, and increased catabolism of nitrogen compounds. Since no concurrent increases in blood creatinine or bleeding were observed in this study, the increase in blood urea in the SAHA-treated groups was likely due to increased catabolism.
Octadecanoic acid and pentadecanoic acid are saturated fatty acids. Octadecanoic acid, also named stearic acid, is one of the most common saturated fatty acids. It is desaturated by stearoyl-CoA desaturase to form the monounsaturated fat, oleate. 33 Both of these fatty acids, along with glycerol and propanoic acid, were decreased in SAHA-treated rats, indicating that the rats were using fat as a source of energy. The increased catabolism of aliphatic acid then resulted in the increase in oleic acid and glutaconic acid.
Previous studies have demonstrated that SAHA induces cell death by generating reactive oxygen species (ROS), which include hydroxyl radicals (OH·), superoxide anions (O2 ·−), and hydrogen peroxide (H2O2). 34 These ROS are very active and can induce a variety of cellular events, including the activation of transcription factors and cell damage via lipid oxidation. 35 The peroxidation of lipid further yields alcoxyl radicals (RO·) and organic hydrogen peroxide (ROOH), which induce more lipid oxidation. These reactions result in the consumption of aliphatic acid, which may be one mechanism by which SAHA results in increased aliphatic acid catabolism.
Uric acid is created by breaking down purines, which are found in some foods and drinks. Common causes of reduced uric acid levels are medical conditions, such as Fanconi syndrome, hyperthyroidism, or nephritis, and drugs that reduce production of uric acid, such as xanthine oxidase inhibitors. 36 Consuming a diet low in purines can also result in hypouricemia. During this experiment, we observed weight loss and a decrease in food intake in SAHA-treated rats. However, morphological examination of the liver did not reveal any obvious changes in the SAHA groups. Therefore, it is more likely that low purine consumption was responsible for the decreased uric acid levels.
We applied the SVM discrimination model, a widely used artificial intelligence technique, to identify metabolic changes among groups. The model showed that all three SAHA groups could be effectively discriminated from the control group. Comparing the high SAHA group to the control group achieved the best results with the greatest accuracy and lowest mean squared error of regression. When all three SAHA groups were included together and compared with the control group, the results showed that when the number of dimensions was reduced to two dimensions, the accuracy of the model was 93.9394% for the training set at c = 256, g = 256, and rate = 87.8788. A visualization of the 2D SVM model is shown in Figure 4. Therefore, the developed SVM model can be used to discriminate serum metabolic changes and identify SAHA toxicity early.
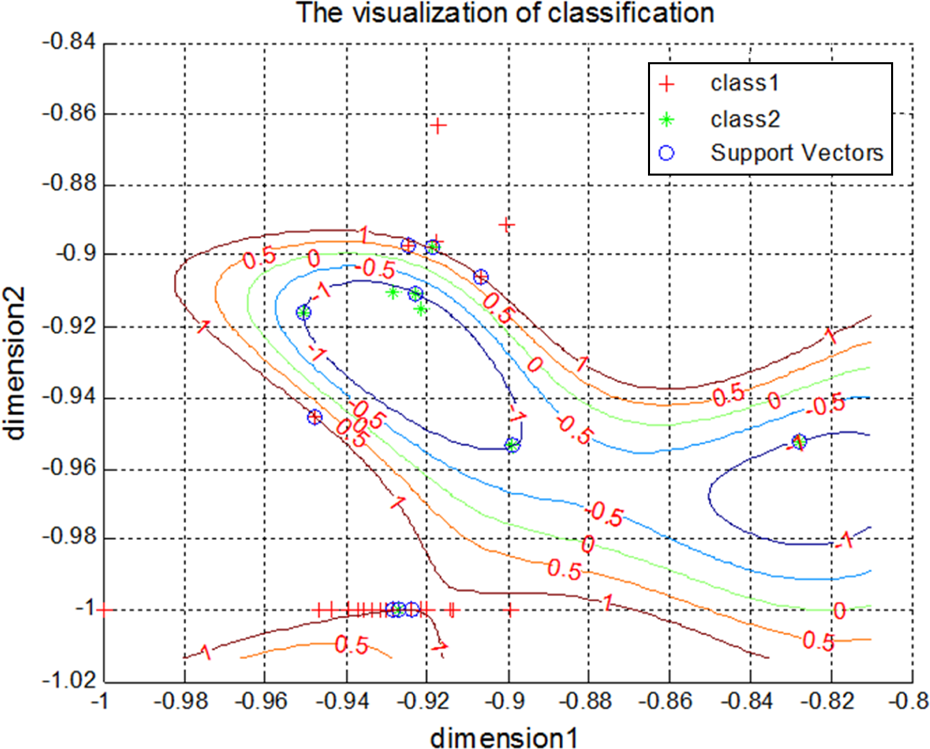
Support vector machine discrimination model of two dimensions based on metabolomics in three SAHA groups (class 1) and control group (class 2).
Conclusions
According to the GC–MS analysis results, urea was the most remarkable change in serum metabolites upon administration of SAHA between the SAHA and control groups. The SVM discrimination model built from the metabolomic data possessed high classification accuracy and could be a useful tool to identify SAHA toxicity. Since serum levels of urea, oleic acid, and glutaconic acid increased, and the levels of octadecanoic acid, pentadecanoic acid, glycerol, propanoic acid, and uric acid decreased, patients should consume low-protein and high-carbohydrate foods to combat SAHA toxicity.
Footnotes
Author contribution
JY and HW have contributed equally to this work.
Declaration of Conflicting Interests
The author(s) declared no potential conflicts of interest with respect to the research, authorship, and/or publication of this article.
Funding
The author(s) disclosed receipt of the following financial support for the research, authorship, and/or publication of this article: This work was supported by funds from the Zhejiang provincial natural science foundation (LY16H300005), Health Department of Zhejiang province (2014KYB100, 2015KYA154), Zhejiang Public Welfare Project, China (2016C37027), the National Natural Science Foundation of China, No. 81401558, and the Young Talents Project from the First Affiliated Hospital of Wenzhou Medical University (qnyc 043). In addition, many thanks for contributions from Meiling Zhang, Kezhi Lin, and Guanyan Lin, who performed the experiments.