
Abstract
There are no common recommendations regarding electrocardiographic monitoring in occupationally exposed workers. Therefore, the present study was designed to investigate whether exposure to lead results in an increase of selected electrocardiography (ECG) pathologies, such as QT interval prolongation and repolarization disorders, in occupationally exposed workers. The study group included 180 workers occupationally exposed to lead compounds. The exposed group was divided according to the median of the mean blood lead level (PbBmean) calculated based on a series of measurements performed during 5-year observation period (35 µg/dl) into two subgroups: low exposure (LE, PbBmean = 20.0–35.0 µg/dl) and high exposure (HE, PbBmean = 35.1–46.4 µg/dl). The control group consisted of 69 healthy workers without occupational exposure to lead. ECG evaluation included the analysis of heart rate (HR), QT interval and repolarization abnormalities. Mean QT interval was significantly greater in the exposed population than in the control group by 2%. In the HE group, mean QT interval was significantly greater than in the control group by 4% and significantly different from those noted in the LE group. Positive correlations between QT interval and lead exposure indices were also reported. Besides, there was a negative correlation between HR and blood lead level. Increased concentration of lead in the blood above 35 μg/dl is associated with the QT interval prolongation, which may trigger arrhythmias when combined with other abnormalities, such as long QT syndrome. Therefore, electrocardiographic evaluation should be a part of a routine monitoring of occupationally exposed populations.
Introduction
Lead is one of the most dangerous toxicants. Despite technical development, lead is still widely used in the industry. Occupational and environmental exposure to this xenobiotic is still an unsolved problem of public health. Toxic action of lead has been extensively investigated; however, accumulated data on this topic are not satisfactory. 1
There are many proposed mechanisms of lead toxicity. First of all, lead competes with divalent cations, such as zinc, calcium, magnesium, and iron, thus affecting various fundamental cellular processes like intra- and intercellular signaling, cell adhesion, protein folding and maturation, apoptosis, ionic transportation, enzyme regulation, and release of neurotransmitters. Secondly, lead induces oxidative stress. In the presence of lead ions, increased generation of reactive oxygen species has been observed. Besides, lead depletes antioxidant reserves, such as glutathione content, and interferes with antioxidant enzymes. 2
All systems of the human body are affected adversely by lead toxic action, including cardiovascular system. 3 It has been shown that blood lead levels correlate positively with significant increases in all-cause circulatory mortality. 1 Studies on the cardiovascular effects of lead exposure were focused mainly on the associations between lead levels and blood pressure. However, the cardiovascular effects of lead are not limited to increased blood pressure but include also an increased incidence of clinical cardiovascular end points, such as coronary heart disease, stroke, left ventricular hypertrophy, alterations in cardiac rhythm, and peripheral arterial disease. 4 Above-mentioned pathologies are related to lead’s influence on the function and structure of myocardium. Animal studies have shown that exposure to lead is associated with the negative inotropic effect, conduction abnormalities, inflammatory changes in myocardium, and its increased susceptibility to arrhythmogenic effect of noradrenaline. 5,6
Cardiac dysfunction in lead exposure may manifest as electrocardiographic abnormalities; 4 however, there are no common recommendations regarding electrocardiographic monitoring in occupationally exposed workers. According to the current state of knowledge, it is not possible to exclude that allowable concentrations of lead cause myocardial damage. Therefore, the present study was designed to investigate whether exposure to lead results in an increase of electrocardiography (ECG) pathologies, such as QT prolongation and repolarization disorders, in occupationally exposed workers.
Materials and methods
Study subjects
The Bioethics Committee of the Medical University of Silesia in Katowice approved the experimental protocol (no. KNW/0022/KB1/108/14 in 2014 year).
The study group included 180 male workers occupationally exposed to lead compounds.
Lead concentration in the blood and the blood concentration of zinc protoporphyrin served as markers of exposure. According to Polish current regulations, maximal acceptable blood levels of lead and zinc protoporphyrin in occupationally lead-exposed males are 50 µg/dl and 5 mg/g of haemoglobin (Hb), respectively, while in environmental exposure, they are equal to 10 µg/dl and 2.5 mg/g Hb.
Blood lead levels had been determined, on average, every 3 months during 5 years of observation before ECG performing. Based on the obtained values, mean levels of lead and zinc protoporphyrin in the blood (PbBmean and ZPPmean) were calculated and served as long-term markers of exposure. The levels of lead and zinc protoporphyrin in the blood measured concomitantly with ECG performing (PbB, ZPP) served as short-term markers of exposure. The inclusion criterion for the study was PbBmean > 20 µg/dl. Exclusion criteria were defined as follows: abnormalities in physical examination, a history of any chronic disease, such as malignant neoplasm, diabetes, and coronary artery disease. The exposed group was divided based on the median of the PbBmean (35 µg/dl) into two subgroups: low exposure (LE, PbBmean = 20.0–35.0 µg/dl) and high exposure (HE, PbBmean = 35.1–46.4 µg/dl).
The control group consisted of 69 healthy administrative workers without occupational exposure to lead compounds (PbB < 10 µg/dl).
Methods
ECG performing
Standard 12 leads resting ECGs using Aspel Mr Blue model ECG machine in all patients were taken. Three-channel recordings were made with 1000 Hz resolution and two filters: 50 and 35 Hz, paper speed 50 mm/s, and the voltage of 100 mm/mV. ECG parameters were calculated manually, using ECG liner and the compass. The first 20 ECGs were assessed by two independent operators. Because of totally the same results, remaining ECGs were assessed by one operator. ECG criteria were assessed based on Polish Cardiac Society Statement on ECG Evaluation 2010. 7
ECG evaluation included the analysis of heart rate (HR), QT interval, and HR-corrected QT (QTc) interval using Bazett’s formula and other repolarization abnormalities.
Sampling and toxicological analysis
The blood in an amount of 5 ml was taken from the antecubital vein into the tubes containing EDTA in order to obtain the whole blood.
PbB level
Analysis of PbB was done by graphite furnace atomic absorption spectrophotometry using Unicam 929 and 939OZ Atomic Absorption Spectrometers (ATI Unicam, Cambridge, UK) with GF90 and GF90Z Graphite Furnaces. Data are shown in microgram per deciliter.
ZPP level
Concentration of zinc protoporphyrin in the blood (ZPP) was measured directly using Aviv Biomedical haematofluorometer model 206 (AVIV Biomedical, New Jersey, USA). The light is filtered by means of an interference filter transmitting at 415 nm. The excitation light controlled on a drop of blood. The emitted light passes through a narrow band interference filter that transmits at 596 nm. The instrument measures the ratio of fluorescent substance (ZPP) to absorption of the light in the sample (by Hb) and is demonstrated as milligrams of ZPP per gram of Hb (mg/g Hb).
Statistical analysis
The statistical analysis was performed using Statistica 9.1 PL software. Data were expressed as the mean ± standard deviation. Levene’s test was used to verify the homogeneity of variances, while Shapiro–Wilk’s test was used to verify the normality. Statistical comparisons between the study groups and the controls were made using the t-test, the t-test with separate variance estimates, or the Mann–Whitney U test. Spearman nonparametric correlation was calculated as well. A value of p < 0.05 was considered to be significant.
Results
The exposed population and the control group were not different in age, body weight, years of work, smoking habits, and alcohol consumption. Only the mean height was higher in the control group than in the exposed population (Tables 1 and 2).
Epidemiologic data.

p Value: comparison between exposed group and the control group; p* value: comparison between the exposed groups.
Epidemiologic data.

p Value: comparison between exposed group and the control group; p* value: comparison between the exposed groups.
aHypertension, diabetes, and pulmonary disorders.
All measured lead exposure markers were higher in the HE and LE groups as compared to the control group what is determined by a study design and divisions of the study populations (Table 3).
Lead exposure indices.
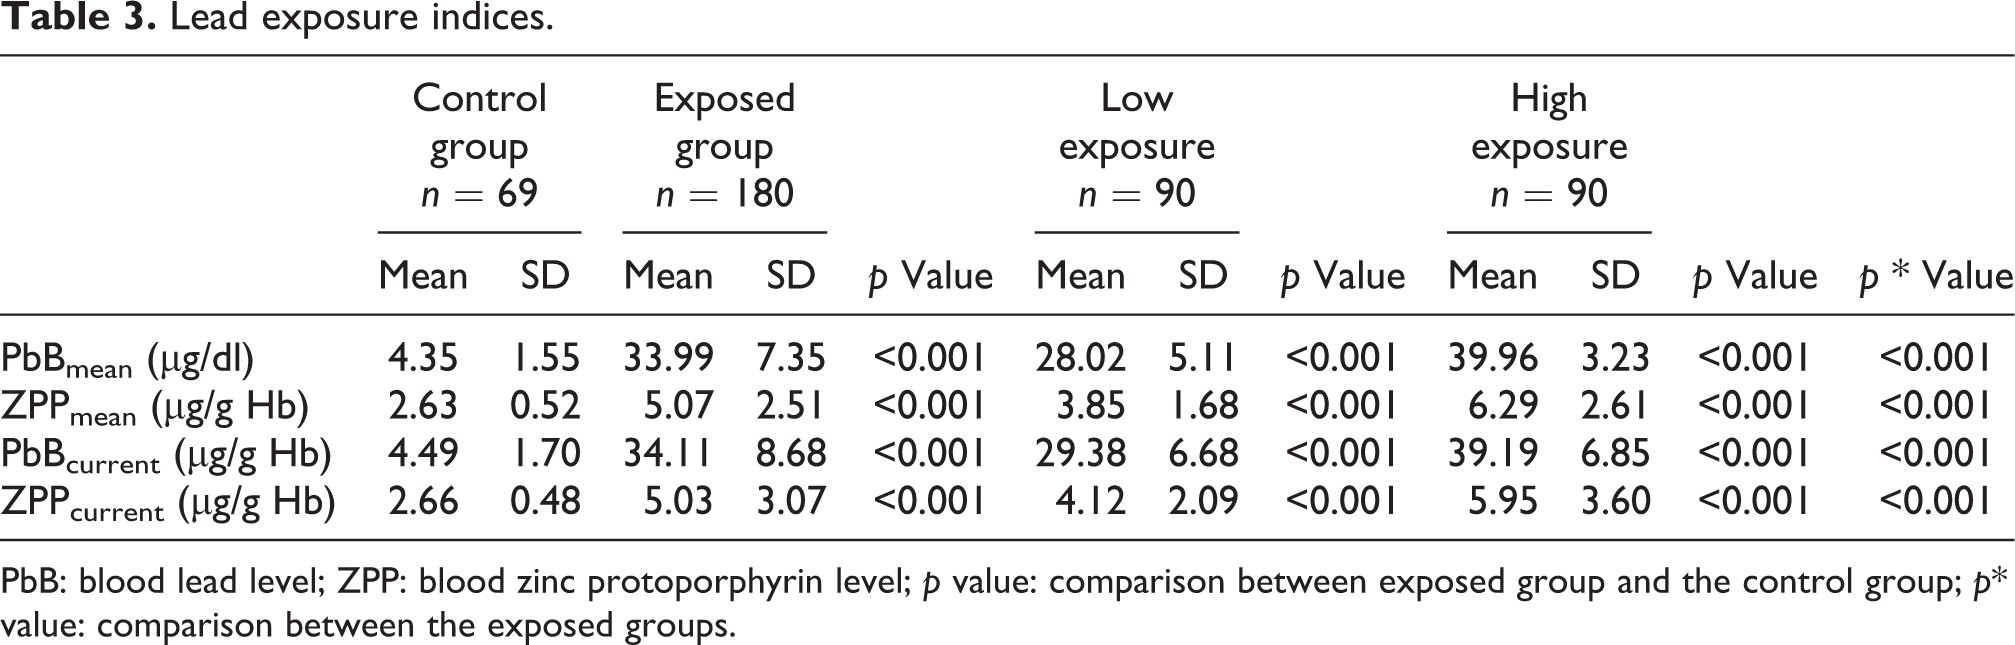
PbB: blood lead level; ZPP: blood zinc protoporphyrin level; p value: comparison between exposed group and the control group; p* value: comparison between the exposed groups.
HR and HR-QTc did not differ between the exposed and control group. However, the mean QT interval was significantly greater in the exposed population than in the control group by 2%. In the HE group, the mean QT interval was significantly higher than in the control group by 4% and significantly different from those obtained in the LE group. The QT intervals were not different in the LE and control group (Table 4).
HR, QT, and QTc intervals in examined population.

HR: heart rate; p value: comparison between exposed group and the control group; p* value: comparison between the exposed groups.
There were no differences between the exposed and control population in terms of repolarization abnormalities (Table 5).
Frequency of the repolarization abnormalities.

p Value: comparison between exposed group and the control group; p* value: comparison between the exposed groups.
The analysis of correlations showed positive correlations between QT interval and lead exposure indices, such as PbBmean, PbB, and ZPPmean (Table 6, Figure 1). There was also a negative correlation between HR and PbB (Table 6).
Spearman’s correlations between lead exposure indices and HR and QT and QTc intervals.

HR: heart rate; NS: non-significant.
a p < 0.05.
b p < 0.001.
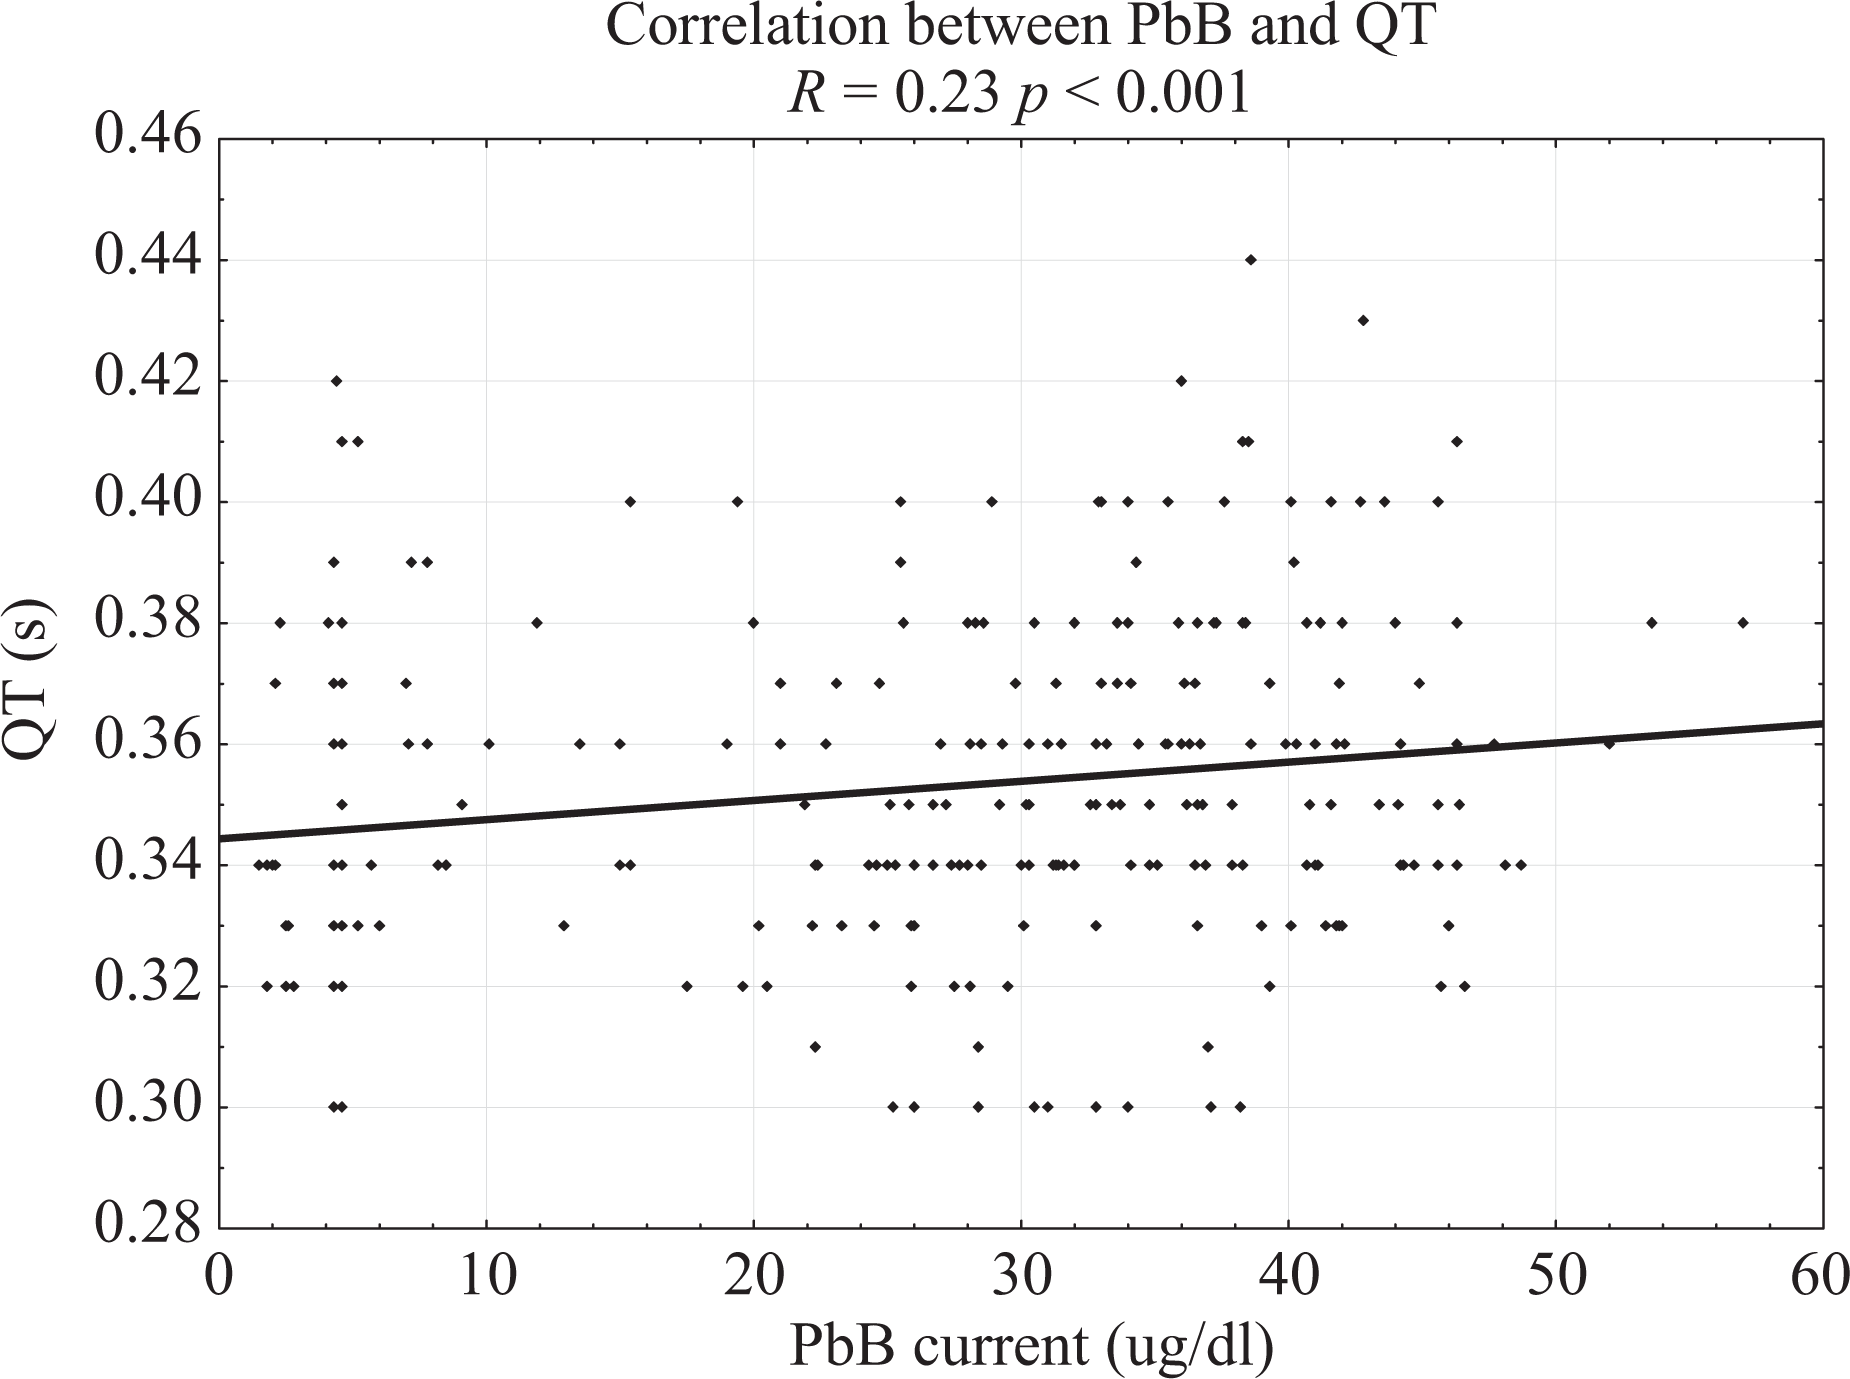
Correlation between PbB and QT. R = 0.23 p < 0.001. PbB: blood lead level.
Discussion
Many in vitro and in vivo studies have shown that lead exposure may result in sinus bradycardia. 8 In the present study, there were no differences in HR between the exposed and control group; however, a negative weak correlation (R = −0.13) between HR and PbB was observed. Results of the other human studies are more pronounced. In a study conducted on a group of 43 copper smelters exposed to lead (PbB = 46.8 µg/dl) and 43 healthy subjects, a 24-h ECG Holter monitoring showed lower HR due to lead exposure. Authors postulate decreased parasympathetic activity in the exposed population. 9 An inverse relation between blood lead level and HR was also shown in the two older studies 10,11 conducted on lead-exposed workers. A part of them developed bradycardia with HR below 35 b/min. However, there is one study 12 on lead-exposed smelters and refiners (PbB = 24.5 µg/dl), compared with unexposed controls (PbB = 7.5 µg/dl), which showed an increased HR in the exposed population. The lead’s impact on HR may occur through its interactions with calcium ions and neurotransmitting, resulting in the impairment of autonomic nervous control of the heart. 6 This control is based on the shift from parasympathetic to sympathetic modulation, which results in the adaptive fluctuations of the HR. Therefore, heart rate variability (HRV) is believed to be a marker of cardiac autonomic function. Decreased HRV indicates autonomic dysfunction and has been associated with increased all-cause mortality in large prospective cohort studies. 4 Decreased HRV was reported in populations chronically exposed to lead. 13 –15 Level of lead exposure in these studies was estimated based on tibia and patella lead levels measured by K-shell X-ray fluorescence. These results confirm the ability of lead to induce cardiac dysautonomia.
Results of the present study support the hypothesis that lead exposure may elongate the QT interval. Besides, the comparison made between the LE and HE groups suggests that this association is dose dependent. Results of the previous studies are consistent. The association between blood lead level and QT interval prolongation was shown in a group of 153 males employed in a crystal glass foundry. 16 There are two other studies on occupationally exposed subjects with concordant results. 12,17 However, results of the Normative Aging Study 18 showed that bone lead level, a marker of cumulative exposure, is more strongly related to electrocardiographic conduction abnormalities than the blood lead level. In this study, blood lead and bone lead levels measured with K-shell X-ray fluorescence were determined in 496 men who also underwent a standard ECG recording. The levels of lead exposure indices were similar to those found in samples from the general US population. Both QT and QTc intervals were greater in the highest tertile of tibia lead compared to the lowest tertile. Results were weaker for patella lead and non-significant for blood lead level. In the present study, QTc intervals were the same in the exposed and control groups. These negative results suggest that observed simultaneously QT prolongation in the exposed group may be partially due to simultaneously decreased HR. Authors of studies regarding the influence of lead on heart conductivity generally postulate that QT prolongation is a result of the autonomic nervous system dysfunction. 10,11,13,16,17,19,20 Besides, lead may interfere with myocardium function directly via the impairment of calcium channels, cellular signaling pathways, phosphorylation of myofibrils, and Na+/K+-ATPase function. 6 All of these mechanisms potentially lead to worse cardiac conductivity and may be associated with the increased risk of sudden cardiac death (SCD).
The repolarization disorders, such as ST elevation or depression, and T-wave changes, were not reported in the present study. Several authors also did not report repolarization abnormalities in lead-exposed subjects. 17,21 Authors of other studies reported only a percentages of subjects who met criteria of repolarization abnormalities in the examined lead-exposed populations 10 –12,16,19 without concluding whether they are higher than those observed in general population.
Conclusions
Increased concentration of lead in the blood above 35 μg/dl is associated with impaired cardiac conductivity in the ventricular myocardium, which manifests as QT interval prolongation.
As a method of the early prediction of cardiovascular disorders, the noninvasive electrocardiographic evaluation should be a part of a routine monitoring of occupationally exposed populations because lead-induced QT interval prolongation may trigger arrhythmias when combined with other abnormalities, such as long QT syndrome.
Footnotes
Declaration of Conflicting Interests
The author(s) declared the following potential conflicts of interest with respect to the research, authorship and/or publication of this article: Beata Średniawa discloses consultation fee of Medtronic Bakken Research Center and fee lectures from Bayer, Reynolds Medical.
Funding
The author(s) disclosed receipt of the following financial support for the research, authorship and/or publication of this article: This work was supported by Medical University of Silesia in Katowice.