
Abstract
Arsenic (As) is widely distributed in the environment, and humans can be exposed to As from various sources such as air, water, soil, and food. This study was performed to evaluate the As exposure levels in Korean adults by measuring total As in urine and its relation with the consumption of seafood, a favorite food in Korea. A total of 2077 adults were the study subjects; they ranged in age from 19 to 83, and they were recruited by probability sampling stratified by area, sex, and age. None of the subjects had been exposed to As occupationally. We collected information about the demographic characteristics, lifestyles, and food consumption of study subjects using a questionnaire and followed urine sampling. Diet was assessed in individual interviews using the 24-h recall method. Total As in urine was analyzed using inductively coupled plasma mass spectrometry (PerkinElmer NEXION 300S; Concord, Ontario, Canada). The geometric mean concentration of total As in urine was observed to be 97.6 µg/L and was higher in males (103.9 µg/L) than in females (93.0 µg/L). Total As levels in urine were affected by sex, age, seafood intake, and geographic location. In this study, total As in urine was positively correlated with fish and shellfish consumption, and was mainly determined by As intake through fish and shellfish/grains/flavors. These findings suggest that seafood consumption might be a major contributor to urinary As levels in Korean adults.
Keywords
Introduction
Arsenic (As) is an abundant metalloid that is dispersed in the natural environment through air, soil, water, and other means. The toxicity of As depends on its form. Inorganic As, trivalent and pentavalent, is a known carcinogen in humans and leads to a variety of strong but noncarcinogenic toxicities that can cause ailments such as skin disease, diabetes, cardiovascular disease, and neurotoxicity. 1 –3 Previous studies reported that people who were exposed to inorganic As had increased risk of cancers of the skin, lung, bladder, liver, and kidney. 4,5 Although monomethylarsonic acid (MMA) and dimethylarsinic acid (DMA) are metabolites of inorganic As that have been regarded as less toxic to the human body than inorganic As, a number of studies have demonstrated that trivalent forms of MMA and DMA have strong toxic effects both in vitro and in vivo. MMA3+ can induce oxidative stress in bladder cells at lower concentrations compared with As3+, 6 and DMA3+ can cause genetic toxicity in mammalian cells 7,8 as well as carcinogenicity in rats. 9
Human exposure to As can be estimated based on As levels in the blood, hair, nails, and urine. 10 Hair and nails generally reflect past and chronic exposure to As, while blood and urine As can be used as biomarkers for recent As exposure. As is distributed in all tissues of the body after exposure, is metabolized relatively quickly in the body, and diminishes rapidly in blood before being excreted, mainly through urine. 11 About 45–85% of ingested inorganic As is excreted within 1–4 days, and the amount of As excretion is highest within the first day after ingestion. Inorganic As (As3+ and As5+) and their metabolites (MMA and DMA) are excreted in urine after inorganic As ingestion. Excretion of total As (As3+, As5+, MMA, DMA) after inorganic As ingestion increases within 5–10 h, peaks at 12–24 h, and is maintained at 24–48 h, mainly MMA and DMA, then decreases gradually; whereas ingested MMA and DMA are excreted mostly within 24 h. 11,12 For organic As compounds, arsenobetaine is rapidly excreted after ingestion, but excretion of arsenosugars is relatively delayed and peaks at around 24 h after ingestion because some of them are metabolized to DMA. 12 –16 Therefore, As concentration in urine is the most valuable biomarker of As exposure within the last several days. In this study, we estimated the exposure levels by measuring total As concentration in urine.
As metabolism in the human body may be influenced by a number of factors such as sex, age, exposure levels, smoking, nutritional status, and genetic differences. 17,18 As exposure from the diet can occur from drinking As-contaminated water, grains harvested on As-contaminated ground, and seafood. 1 Previous studies have reported relationships between As intake from food, especially seafood, and urinary As concentration levels in general populations. 19 –22 Korea has one of the highest per capita seafood consumption levels in the world (Republic of Korea, 58.1; the United States, 21.7; Canada, 22.3; Portugal, 56.8; China, 32.8; Japan, 53.7 kg/capita/year), 23 and Korea consumes much more seaweed than do other countries (Republic of Korea, 17.5; China, 8.5; Japan, 1.0 kg/capita/year). 23 Fish, shellfish, and seaweed are favored foods in Korea that also contain high amounts of organic forms of As such as arsenobetaine and arsenosugars. It is understood that organic As is essentially harmless to human health, however, organic As forms such as arsenosugars can be converted to DMA, which is more toxic than other organic As forms in the human body. 1,14,16 Accordingly, DMA can be derived from exposure to both inorganic and organic forms of As, and thus, it is necessary to take heed of As exposure from a variety of sources. Korean people may have higher exposure to As due to consuming a diet with abundant fish/shellfish and seaweeds. It is essential to evaluate the level of human exposure to As to control the risk of As in the general population. However, there is little information about As exposure in the general Korean population.
Inductively coupled plasma mass spectrometry (ICP-MS) can detect both organic and inorganic As in the urine, reflecting As exposure levels from various sources. In addition, there is the advantage that urine samples can be screened quickly because ICP-MS is a much faster method of analyzing As in urine than other methods such as hydride generation with atomic absorption spectrophotometry, which requires pretreating of the samples, or high-performance liquid chromatography with ICP-MS, which takes much longer. Although total As in urine does not contain information about the type of As, it can rapidly provide information on As exposure levels in populations.
In this study, we analyzed total As in human urine and determined the contributing factors to As levels in the human body; we also evaluated the relationship between As exposure and seafood consumption.
Materials and methods
Study subjects
The study subjects were Korean individuals over the age of 19 who were selected using stratified probability sampling by area, sex, and age, and recruited over the period of 2010–2011 from 102 sampling sites across the country excepting Jeju province. The number of study subjects at each site was allocated proportionally to the square root of the population size of the district. 24 The study recruited 2118 subjects, and 2102 of these took the food survey. Urine samples were ultimately collected from 2077 subjects (900 males and 1177 females). This study was approved for design and process by the Chung-Ang University Ethical Committee for Medical Research and Other Studies Involving Human Subjects.
Personal interviews and urine sampling
Well-trained personnel conducted individual interviews using a structured questionnaire that included demographic information as well as information on the subjects’ smoking and drinking habits, education levels, drinking water, residence areas, geographic locations, and food consumption. Residence area was classified according to the number of living subjects as metropolitan (population ≥ 1 million), urban (1 million ≥ population ≥ 50,000), and rural (population < 50,000); and geographic location was categorized as inland or coastal. Food consumption during the last 24 h was recorded using 24-h recall. Additionally, we asked the subjects whether they had consumed seafood within 72 h before their personal interviews. Urine sampling for 24 h is the best method for evaluating urinary As excretion, but it is very difficult to apply in epidemiologic studies on the general population. Additionally, a spot urine has a limitation due to variation. We tried to obtain as much urine samples as possible over a long period of time. Urine samples were collected from each subject over approximately 15 h starting from dinner on the day before the interview to the next morning and included the first voiding on the next day. Urine samples were stored at −70°C.
Analysis of total As concentration in urine
Total As concentration in urine was measured using inductively coupled plasma dynamic reaction cell-mass spectrometry (PerkinElmer NEXION 300S, Concord, Ontario, Canada), which can assess the sum of exposure levels to all As forms, for example, As3+, As5+, MMA, DMA, arsenobetaine, arsenocholine, arsenosugars, and others. For the analyses, 0.1 mL of each urine sample was diluted in 0.9 mL of 1% nitric acid to determine the presence of As monoxide. The analytical conditions for ICP-MS are described below: radio frequency power 1600 W, plasma gas (Ar) flow 18 L/min, auxiliary gas (Ar) flow 1.2 L/min, nebulizer gas (Ar) flow 1.0 L/min, and carrier gas (oxygen) flow 0.5 mL/min. The analysis of As in urine was validated in terms of the linearity of the standard curve, accuracy, precision, and using a standard reference material (SRM, Bio-Rad, Irvine California, USA). Interlaboratory analyses were also performed using 50 urine samples (r 2 = 0.965). The As detection limit was 0.002 μg/L.
Estimation of total As intake from diet
Estimated individual daily total As intake from the diet in this study’s subjects was calculated based on the amount of daily food consumption and total As content in each food item according to the total As content database for 138 specific food items prepared by Seo et al. 25 in a previous study.
Statistical analyses
All data were organized in Microsoft Excel, and the statistical analyses were performed with SAS version 9.1. The distribution of the measured values for total As in urine was skewed farther to the left than the normal distribution, while the distribution of log-transformed values was closer to the normal distribution than the measured values. Therefore, As concentrations in urine are presented as geometric means (GMs) and geometric standard deviations (GSDs), and other parameters are expressed as arithmetic means (AMs) and standard deviations (SDs). Statistical evaluations for means were performed using either Student’s t test or analysis of variance following multiple comparison tests using Duncan’s method. Comparison of the adjusted means for urinary As concentrations by demographic characteristics or the amount of fish/shellfish consumption after controlling for various confounding variables, such as smoking, alcoholic drinking, education, residence area, drinking water, geographic location, and seafood intake within 72 h before collection of the urine sample as well as sex and age, was performed using analysis of covariance. Correlations of total As in urine with food consumption or dietary total As intake were analyzed using Pearson’s correlation coefficient. Prediction of food groups that contributed to total As concentration in urine, based on the amount of food consumption or dietary As intake, was performed by principal component analysis (PCA). In PCA from 16 food groups, the gap between eigenvalues above 1 and those below 1 was too narrow for food consumption and dietary As intake and both retained 10 components. The cumulative percentage of variance was relevant to 70% or 74% of total variance in food consumption or dietary As intake, respectively. Each component retained items based on the factor loadings >0.4. Contributing components to total As in urine among the newly created variables were determined by a multiple linear regression model. The level of statistical significance was set at p < 0.05.
Results
The GM concentration of total urinary As in the study subjects was 97.6 µg/L, and total As was higher in males (103.9 µg/L) than in females (93.0 µg/L). The AM, median, and 95th percentile of total As concentration was 155.1 µg/L, 98.5 µg/L, and 426.4 µg/L, respectively (Table 1). Table 2 presents total As concentrations by demographic characteristics. Urine levels in the group aged 19–39 were significantly lower than those of the groups aged 40–59 and 60 or over. Gender- and age-related differences for total As were still observed after the adjustment for various confounding variables such as smoking, alcoholic drinking, education, residence area, drinking water, geographic location, and seafood intake within 72 h before urine sampling as well as sex and age. No significant differences in total As concentrations were observed by personal habits such as smoking and drinking after the adjustment for various confounding variables. Urinary As level was different by education status; specifically, As levels were higher in the less educated groups, but the difference disappeared after controlling for the confounding variables. There were no differences in urinary As levels by size of the residence area and drinking water sources, but they did differ by geographic location; levels were significantly higher in coastal (138.6 µg/L) areas compared with inland (87.2 µg/L). In addition, the levels in the subjects who had consumed seafood within the last 72 h prior to urine sampling were higher than the levels in those who had not. Multivariate analyses indicated that the influential factors on total As concentration in the urine of Korean adults were sex, age, geographic location, and seafood consumption within 72 h before urine sampling (Table 2).
Mean concentrations of total As in the urine of study subjects.
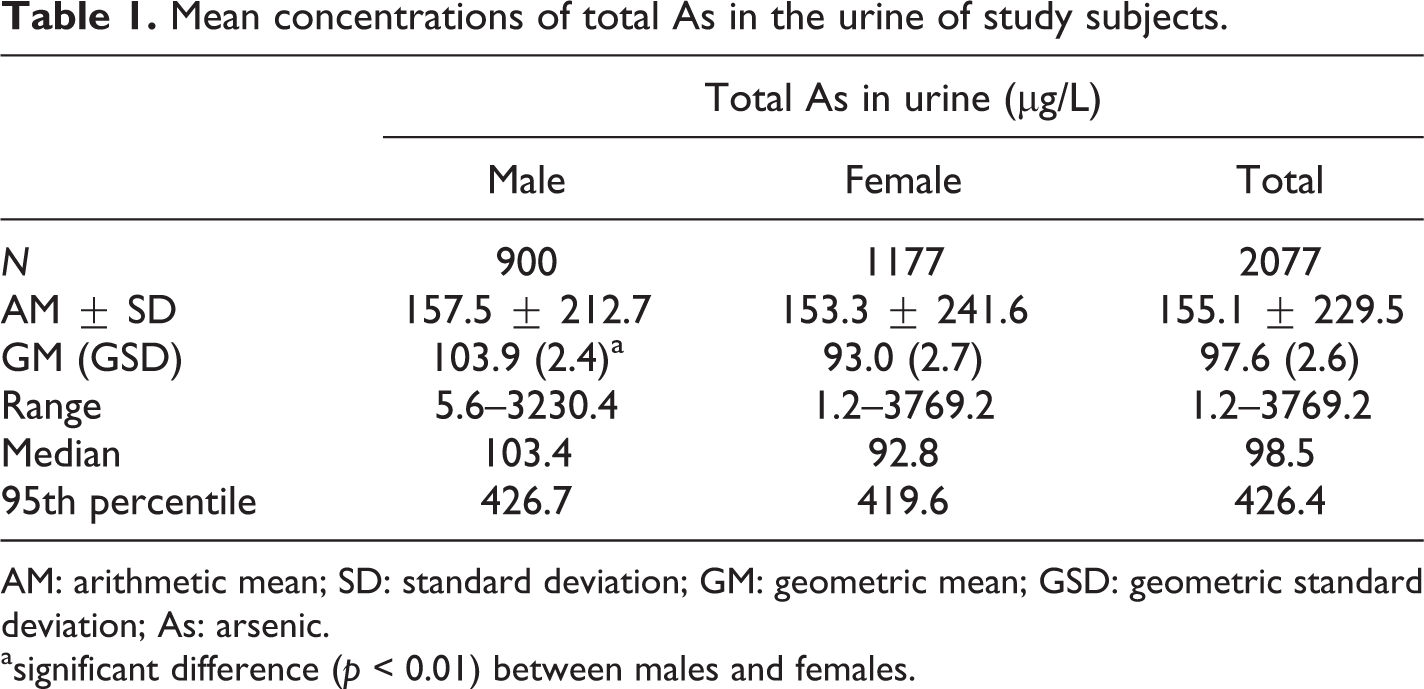
AM: arithmetic mean; SD: standard deviation; GM: geometric mean; GSD: geometric standard deviation; As: arsenic.
asignificant difference (p < 0.01) between males and females.
Crude and adjusted (sex and age, multivariate) GM concentrations of total As in urine by demographic characteristics in the study subjects.a

GM: geometric mean; CI: confidence interval; As: arsenic.
aadjusted for sex, age, smoking, alcoholic drinking, education, residence area, drinking water, geographic location, and seafood intake.
In this study’s subjects, the daily food consumption and estimated total As intake was 1372.9 g/day and 146.0 μg/day, respectively (Table 3). Total As in urine was not associated with daily total food consumption, but was significantly correlated with estimated total As intake from the diet (r = 0.239, p < 0.01). Total As in urine was positively highly correlated with fish/shellfish consumption (r = 0.259, p < 0.01) and so was As intake from fish/shellfish (r = 0.263, p < 0.01). In fact, the GM concentrations of total As in urine increased with fish/shellfish intake in a dose-dependent pattern (p < 0.01; Table 4), and the association remained after the adjustment for various confounding variables. Urinary total As was also positively correlated with As intake from grains and flavors, respectively (p < 0.01). A negative relationship, however, was observed between total urinary As and the consumption of meats (r = −0.061, p < 0.05) and eggs (r = −0.049, p < 0.05), similar to As intake from meats (r = −0.060, p < 0.05; Table 3).
Pearson’s correlation coefficients between total urinary As and daily food consumption as well as dietary total As intake.

As: arsenic.
a p < 0.01.
b p < 0.05.
Crude and adjusted (sex and age, multivariate) GM concentrations of total As in urine according to the amount of fish/shellfish consumption in the study subjects.

GM: geometric mean; CI: confidence interval; As: arsenic.
aadjusted for sex, age, smoking, alcoholic drinking, education, residence area, drinking water, geographic location, and seafood intake.
Among the 10 components for food consumption predicted from PCA, component 2 (fish and shellfish/flavors) was statistically significant and was positively correlated with total As in urine, whereas components 3 (meats/beverages), 4 (potatoes), 6 (milk/eggs), and 10 (pulses) were negatively correlated. Namely, these five components were significant contributing factors to urinary total As in multiple regression analysis. Specifically, higher consumption of fish and shellfish and flavors resulted in higher As levels in urine, while higher consumption of meats/beverages, potatoes, milk/eggs, and pulses resulted in less urinary As (Table 5). In dietary As intake, total urinary As was positively correlated with component 1 (fish and shellfish/grains/flavors), but negatively related with component 2 (meats/oils) and component 3 (potatoes/vegetables). In multiple regression analysis, these three components significantly contributed to the urinary As level, namely, As intake from fish and shellfish/grains/flavors mainly affected the total As level in urine (Table 5).
Multiple linear regression of dietary contributing components to total As levels in urine.

As: arsenic.
a p < 0.01.
Discussion
In this study, we analyzed total As concentration in the urine of Korean adults and evaluated contributors to total urinary As levels. The GM concentration of total As in this study’s subjects was 97.6 μg/L. The total As in the Korean population was higher than levels in western countries such as the United States (GM, 7.3 μg/L for no seafood; 24.6 μg/L for any seafood), Germany (GM, 12.7 μg/L), Canada (GM, 12.00 μg/L), France (GM, 11.96 μg/g creatinine), and Portugal (AM, 67.46 μg/g creatinine) 20,26 –29 but similar to or lower than levels in Italy (GM, 81.7 μg/L), China (AM, 86.0 μg/g creatinine), and Japan (median, 141.3 μg/L). 30 –32 These findings suggest that Asians, including Koreans, have been more exposed to As than have residents of western countries. Variations in urine As levels among countries might be affected by factors such as lifestyles, diet habits, nutritional status, and genetic susceptibility as well as geological contamination. 17,18
In this study, total As concentration was influenced by sex, age, seafood intake within 72 h before urine sampling, and geographic location. Total As concentration was higher in males than in females and was lower in the population group aged 19–39 than in older groups. Gender- and age-related differences in total urinary As concentrations in the general population who have not been occupationally exposed to As are still controversial. 20,33 –35 In this study, no statistical difference was observed in the AM As concentration between males and females. However, the GM concentration of total As in urine still showed a significant difference by gender after adjustment for various confounding variables, including geological location and seafood intake within 72 h before urine sampling. Additionally, the daily consumption of seafood was different between genders (66.5 g/day in males, 53.6 g/day in females; data not presented), which might significantly contribute to As levels in urine. In the present study, urine As levels were lowest in the highest educated group, but the statistical significance disappeared after controlling for various confounding variables as well as sex and age by multivariate analysis. Human exposure to environmental contaminants, such as lead, mercury, and cadmium, is usually affected by the residential area (metropolitan, urban, rural) and personal habits such as smoking and drinking, 36 –38 but these did not contribute to As levels in this study. Several epidemiologic studies presented evidence that carcinogenic and noncarcinogenic health effects were caused by contaminated drinking water. 2 –5 Although we did not measure As levels in drinking water in this study, total As levels in urine did not differ according to the drinking water source. In Korea, As level in drinking water is well regulated with a standard of <10 μg As/L, and waterworks cover approximately 98.5% of the total population, specifically, 99.9% in metropolitan areas, 99.3% in urban areas, 96.4% in towns, and 89.8% in townships. In addition, no report has been published on excess As levels in drinking water evaluated recently at water supply facilities in Korea. 39 However, these findings do not suggest that ground water is safe from As in Korea.
Previous studies reported that seafood also might play a role as a major source of As exposure in general populations, 28,40 –42 which is concurrent with this study. Namely, urinary As concentrations were higher in the study subjects who had eaten seafood within the last 72 h before their urine was sampled compared with those who had not, and levels also increased dose dependently based on the amount of fish/shellfish consumed during the 24 h prior to urine sampling. These associations remained after adjustment for various confounding variables including sex and age. In this study, total As levels in inhabitants of coastal areas were significantly higher than the levels for residents of inland areas. This report does not present the data, but the daily consumption of seafood was also higher in coastal areas (76.0 g/day) than inland (53.4 g/day), and this could have contributed to the significant difference in As levels between the two areas. These findings indicate that seafood may be a major contributor to As exposure in Korean adults. Seafood contains essentially harmless organic As forms such as arsenobetaine and arsenosugars. However, previous studies reported that seafood consumption resulted in notably increased DMA as well as organic As in urine. 16,43,44 DMA is a metabolite of inorganic As that is much less toxic than arsenite and arsenate but more toxic than organic As. The ICP-MS analysis of total urinary As levels in this study could not provide information regarding specific As forms; it was restricted to evaluating the metabolic aspects and potential health effects of each As form in the human body. As a result, As species analysis is necessary to assess the risks of As exposure and should be conducted in additional studies. However, the rapid analysis of total As by ICP-MS is also useful for screening As exposure in epidemiologic studies in Korea, where seafood is a favorite food. In addition, previous epidemiologic studies suggested that total As in urine is responsible for health effects such as chronic kidney disease and renal cell carcinoma. 45,46 Further, Wen et al. 47 observed a positive relationship between total urinary As and the damage indexes of exon 5 on the p53 gene in exposed workers.
Diet is a major route of As exposure in general populations. In the present study, there was no significant relationship between total diet intake estimated by 24-h recall and total urinary As concentration in the study subjects. As mentioned above, total urinary As was significantly associated with the consumption of only fish/shellfish among the 16 studied food groups. In additional analyses for the relationships between total urinary As and other specific food items (data not shown), total As was positively related with various specific fish and shellfish, such as mackerel, white fish, squid, croaker, crab, shrimp, and freshwater eels; in addition, total urinary As was significantly associated with the consumption of dried tangle seaweeds. No relationship was observed between total urinary As and grain consumption, but there was a significant positive relationship with only rice consumption among the 17 specific grains that were studied. Rice contains a good deal of As compounds than do other crops, 48 although the As in rice is understood to be mainly inorganic; 49 the bioaccessibility of As in rice does, however, increase to 63–99% with cooking. 50 Rice is a staple food worldwide, particularly in Asia, which, accordingly, may significantly contribute to dietary As exposure in the general population. 51 –53 In this study, the PCA for specific food groups indicated that higher consumption of fish and shellfish/flavors contributed to higher levels of total As in urine, whereas the consumption of meats/beverages, potatoes, milk/eggs, and pulses were negatively correlated with urinary As. Also, As intake through fish and shellfish/grains/flavors was the most influential component for As levels in urine. These findings correspond with previous results, specifically that fish/shellfish was responsible for about 73% of total As intake from the diet, which is a major exposure source for As from the diet. 25 Though a negative association was observed between total urinary As and meat consumption, this reason remains unclear. Meat generally contains less As than both grains and seafood, 41,54 and therefore, As levels in the body could depend on individual favorite foods and geographic locations, namely, the amount of fish and shellfish consumption was negatively associated with meat consumption in the study subjects (r = −0.107, p < 0.01). Meat contains high methionine, which may facilitate the supply of sulfur amino acids that are required for reforming s-adenosyl methionine, and it could also accelerate As metabolism and excretion. This study was confined to subjects aged 19 years and above, but it is necessary to extend the analysis to the young population because they are more susceptible to environmental pollutants including As.
In summary, the GM concentration of total urinary As in Korean adults was 97.6 µg/L and was significantly affected by sex, age, seafood intake, and geographic location. Total As in urine was positively correlated with fish and shellfish consumption, and was mainly determined by As intake through fish and shellfish/grains/flavors. These findings suggest that seafood consumption might be a major contributor to urinary As levels in Korean adults.
Footnotes
Declaration of Conflicting Interests
The author(s) declared no potential conflicts of interest with respect to the research, authorship, and/or publication of this article.
Funding
The author(s) disclosed receipt of the following financial support for the research, authorship, and/or publication of this article: This research was supported by a grant (13162MFDS783) from the Ministry of Food and Drug Safety in 2013. This research was supported by the Chung-Ang University Research Scholarship Grants in 2015.